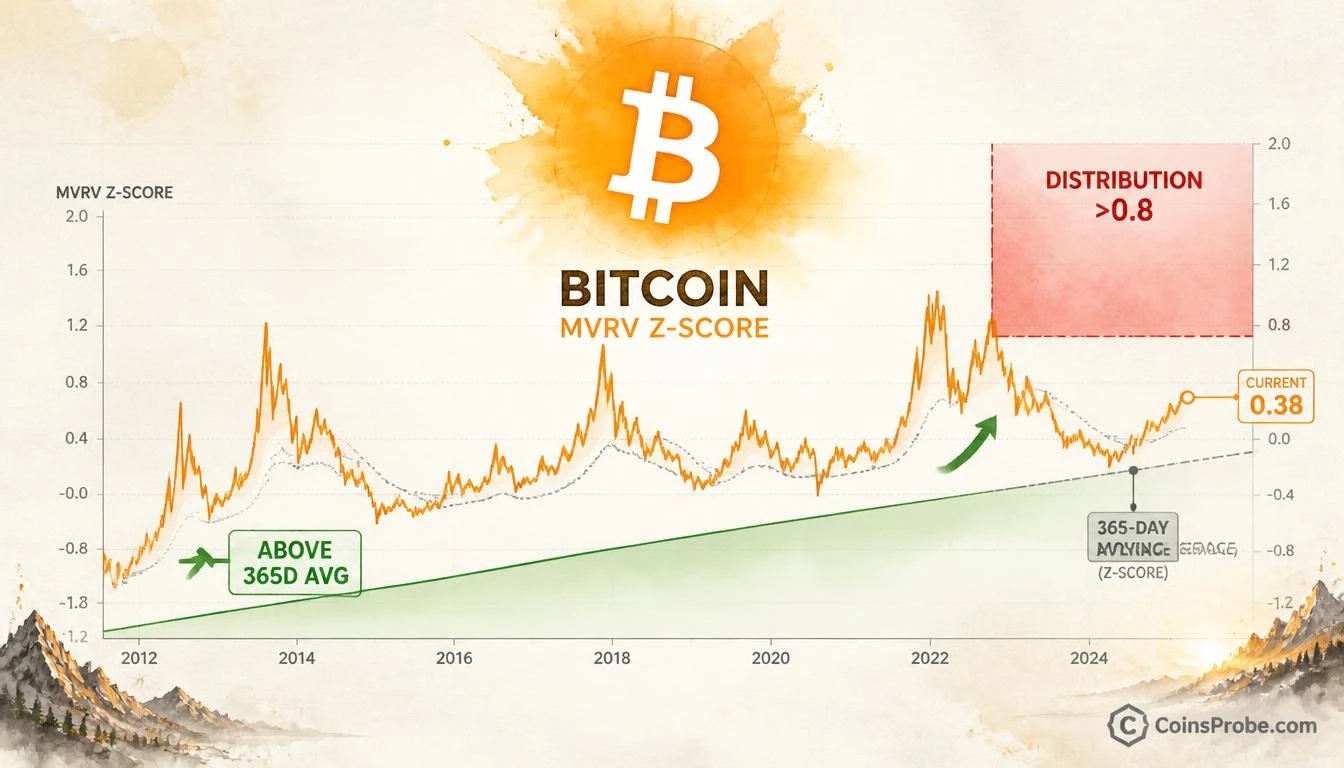
- Bitcoin trades at $83,510 (+0.16%) with MVRV Z-Score holding above its 365-day average — a structural bull market signal
- Per @TraderGemin via CryptoQuant: 365-day MVRV average has acted as dynamic support across every prior Bitcoin bull phase since 2012
- Z-Score remains below the +0.8 red zone distribution threshold seen at 2017 and 2021 cycle peaks — not overheated
- Sustained Z-Score breakdown below the 365-day SMA is the single on-chain condition that would invalidate the bullish macro structure
Bitcoin is trading at $83,510 — up 0.16% in the past 24 hours — with a market cap of $1.678 trillion. Beneath the surface of this consolidation, one of the most reliable long-term on-chain valuation metrics is delivering a structurally bullish reading: the MVRV Z-Score is holding above its 365-day moving average, a condition that has historically defined the support floor of Bitcoin’s broader bull phases.
The observation comes from analyst @TraderGemin, published via @cryptoquant_com. His exact words: “Historically, once the MVRV Z-Score moved above its 365-day average, that average often acted as support during the broader bullish phase.” That is not a speculative call — it is a pattern documented across every major Bitcoin market cycle since 2012.
What the MVRV Z-Score Actually Measures
Before interpreting the current reading, the mechanics matter. The MVRV Z-Score is a composite on-chain metric derived from three components: Market Value (current market cap), Realized Value (the aggregate cost basis of every coin at its last on-chain movement), and a Z-Score normalization that removes cyclical extremes. The result is a single number that tells you whether Bitcoin is trading at a premium or discount relative to what the aggregate market actually paid for it.
The chart’s zones clarify the thresholds with precision: readings above approximately +0.8 have historically marked distribution and peak euphoria — the red zone seen at the 2017 and 2021 cycle tops. Readings below approximately -0.8 have marked deep undervaluation — the green accumulation zones of 2018–2019 and 2022 bear market bottoms. The zero line represents fair value equilibrium. Everything above zero, with the 365-day SMA acting as a rising floor, is the structural bull market range.
The 365-Day Average as Dynamic Support — The Historical Record
The critical insight from @TraderGemin is not the raw Z-Score level — it is the relationship between the Z-Score and its own 365-day average. Once the Z-Score crosses above that annual moving average and sustains the position, the average has historically functioned as a trailing stop line for the bull market structure. Each retest of that average from above has, in prior cycles, preceded a resumption of the uptrend rather than a breakdown.
The chart published by @cryptoquant_com shows this pattern across the 2012–2026 data set. In the 2016–2017 cycle, the Z-Score held above its 365-day average throughout the bull run until the December 2017 peak — at which point the score spiked deep into the red zone before collapsing. In the 2020–2021 cycle, the same structure held: the annual average provided support across multiple pullbacks before the score peaked in early 2021. In both cases, the danger signal was not a retest of the average — it was a spike into the red zone above +0.8.
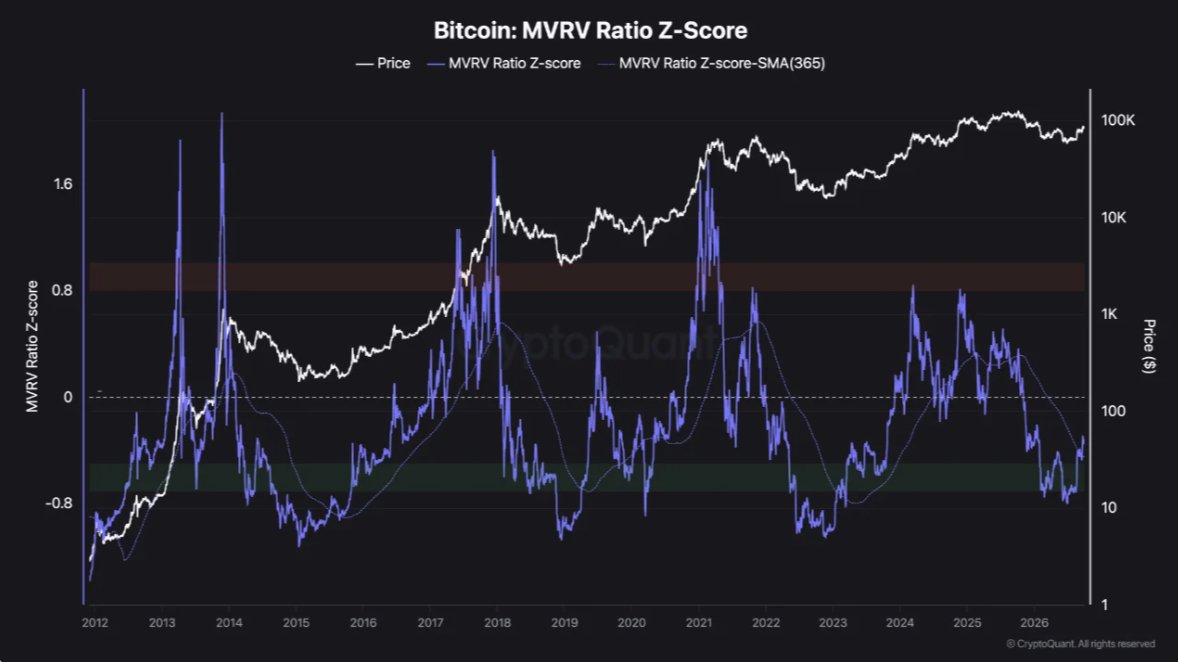
The current reading matters for one specific reason: the Z-Score has pulled back significantly from its 2021 peak levels but remains above the 365-day SMA. That is the definition of mid-cycle positioning — elevated enough to confirm a bull market, not elevated enough to signal distribution. The chart caption is precise: this is “cautiously bullish with macro structure intact.”
What the Current Reading Confirms — and What It Doesn’t
The MVRV Z-Score holding above its 365-day average confirms one thing with precision: the long-term cost-basis structure of the market remains in a zone where aggregate holders are in profit at a level consistent with ongoing bull market dynamics. It does not confirm direction for the next 30 days. It does not guarantee any specific price target. It is a regime indicator — it tells you which macro environment you are in, not when the next leg starts.
What it explicitly does not show: the red zone. The current Z-Score is below the +0.8 distribution threshold that marked the 2017 and 2021 cycle exits. That asymmetry is structurally significant. Prior bull markets ended when the Z-Score entered the red zone — not when it pulled back toward the annual average. The current reading has done the latter, not the former.
For context on how the realized value metric has behaved in prior stress events, see Bitcoin LTH MVRV Exits Stress Zone — What History Says Happens Next.
The One Level That Changes the Thesis
@TraderGemin’s framework identifies a single invalidation condition: if the MVRV Z-Score drops below the 365-day SMA, the historical precedent shifts from bullish to neutral-to-bearish. That level is not a fixed price — it is a moving threshold on the on-chain metric itself. But the implication for price is concrete: every prior instance where the Z-Score broke below its annual average for a sustained period corresponded to macro trend reversal in Bitcoin’s price — not a temporary correction.
The secondary risk is the opposite extreme. A spike into the red zone above +0.8 — driven by rapid price appreciation without proportional growth in realized value — would signal a distribution phase, historically a sell signal for long-term holders. Neither condition is present at $83,510.
Bullish Scenario
The MVRV Z-Score continues to hold above its 365-day average as Bitcoin consolidates in the $80K–$90K range. Each retest of the annual average from above is absorbed — consistent with the 2016–2017 and 2020–2021 precedents. The next macro leg higher follows, with the red zone above +0.8 remaining the only indicator-defined exit signal for long-term structure.
Bearish Scenario
A sustained breakdown of the MVRV Z-Score below its 365-day SMA — not a brief intraday dip, but a multi-week close below — would break the structural pattern that has defined every Bitcoin bull market since 2012. That would shift the regime signal from bullish to reversal-watch. The $80,000 price level, previously identified as the critical realized-value support zone, would become the immediate focus. For broader context on where Bitcoin sits in the current market cycle, Is Crypto in the Disbelief Phase? What Market Cycle Psychology Says Now provides the sentiment overlay.
The MVRV Z-Score above its 365-day average is a macro regime signal, not a price prediction. What it confirms at $83,510 is this: Bitcoin is operating within the on-chain structure that has characterized every bull market phase since 2012 — elevated above realized value, not overheated into the distribution zone, with the annual average acting as a rising floor. The one level that changes the entire structural read is a sustained Z-Score breakdown below the 365-day SMA. Until that happens, the long-term cost-basis structure of the market still favors the upside. Watch the 365-day MVRV average as the single most important trailing indicator of macro trend health.
Frequently Asked Questions
What does it mean when Bitcoin’s MVRV Z-Score holds above its 365-day average?
Is Bitcoin’s MVRV Z-Score currently in the danger zone?
What on-chain condition would turn the MVRV Z-Score signal bearish?
How is the MVRV Z-Score different from simple price-based indicators like RSI?
Source: CryptoQuant · Published by CoinsProbe Markets Desk
The opinions and market insights shared on CoinsProbe represent the views of individual authors based on prevailing market conditions at the time of publication. Cryptocurrency investments carry significant risk and volatility. Readers are encouraged to conduct their own research and seek professional financial advice before making investment decisions. CoinsProbe and its contributors do not accept responsibility for financial losses or decisions made based on published content.
CoinsProbe may publish sponsored articles, affiliate links, or promotional collaborations. All sponsored material is clearly labeled to maintain transparency with our audience. Our editorial decisions remain fully independent, and advertising partnerships do not influence reviews, rankings, or published opinions.
Since 2023, CoinsProbe has delivered reliable insights on cryptocurrency, blockchain, and digital assets. Our content is created by experienced researchers and analysts who follow strict editorial standards focused on accuracy, transparency, and credibility. Every article is carefully reviewed and verified using trusted sources and current market data. We provide unbiased analysis and timely updates covering everything from emerging crypto projects to major industry developments.