
- Bitcoin trades at $83,047 — down 1.13% — as its 90-day Buy/Sell Pressure Delta stalls at +0.01, per CryptoQuant analyst @MorenoDV_
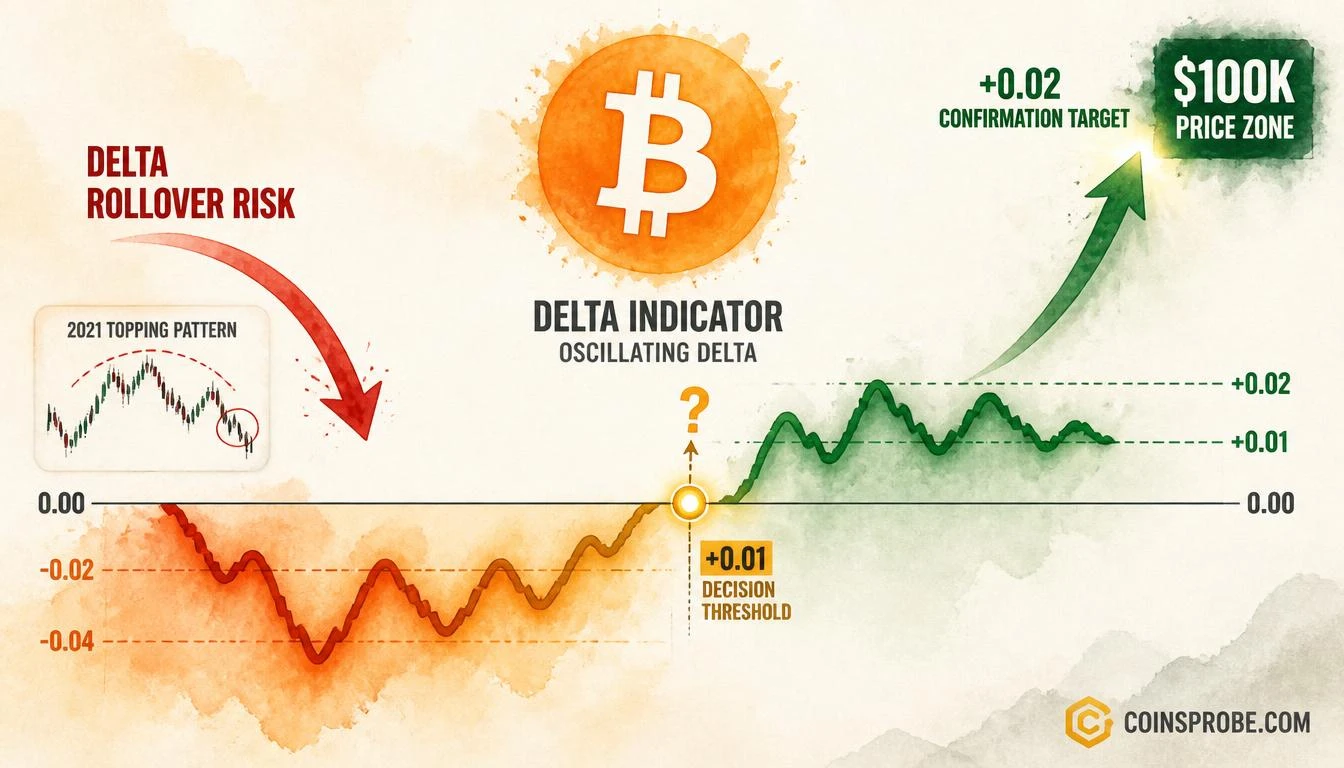
- Current delta reading of +0.01 is 75% below the 2021 cycle peak of +0.04, raising bearish divergence risk near $100K resistance
- Bulls need delta to break above +0.02 to confirm structural buying support; a rollover below +0.005 reopens the 2021 topping pattern
- Watch $83,000 as immediate support — loss of this level alongside a delta rollover would be the clearest structural warning signal
Bitcoin is trading at approximately $83,047 — down 1.13% in the last 24 hours — with a market cap of $1.67 trillion. Beneath the surface, one on-chain pressure indicator is flashing a warning that every serious trader should understand before adding long exposure near all-time highs.
CryptoQuant analyst Matias Moreno (@MorenoDV_), writing via the official @cryptoquant_com channel, identifies the current moment as a structural fork in the road: “If the delta stalls near its current level and rolls over while price pushes higher, the divergence would suggest that the rally is losing support.”
What the Buy/Sell Pressure Delta Actually Measures
Before citing the reading, the mechanism deserves precise explanation. The Buy/Sell Pressure Delta (90-Day) is not a price indicator — it measures the net difference between aggressive buying and aggressive selling activity on-chain and across spot markets over a rolling 90-day window. Positive delta (green/blue territory, approximately +0.02 to +0.04) means buyers are overwhelmingly initiating trades. Negative delta (yellow/orange territory) means sellers are in control of flow. The indicator crosses zero at the boundary between accumulation regimes and distribution regimes — making that zero line the single most important threshold in the current setup.
This is not a sentiment survey. It is a direct measure of who is hitting the bid versus who is lifting the offer, aggregated across 90 days to filter noise.
The Current Reading — And Why It Is a Problem
The 90-day delta is recovering from negative territory back toward the green zone, with the current reading registering approximately +0.01 — barely positive, and critically, showing signs of momentum stalling. The chart shared by @cryptoquant_com shows the recovery circled at a decision zone that aligns with Bitcoin’s historical $20K level — once the cycle peak, now structural support — and maps this recovery against the full 2018–2026 cycle history.
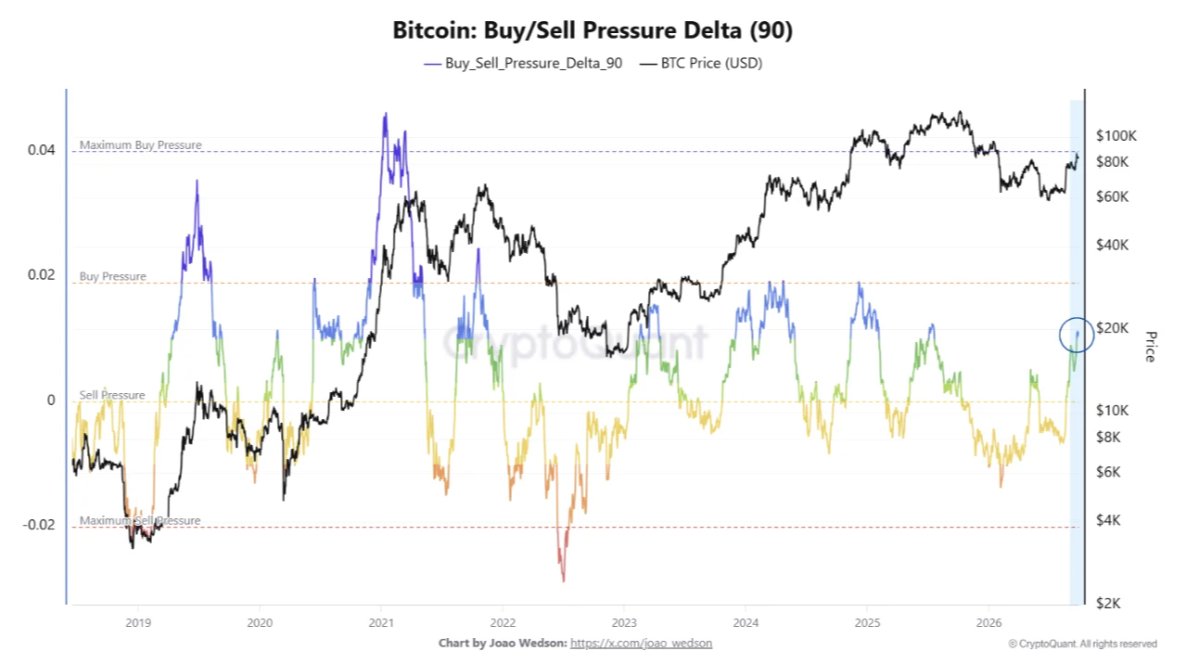
The problem is not the direction of recovery — it is the magnitude. At peak cycle conviction in 2021, the Buy/Sell Pressure Delta reached a reading of approximately +0.04, confirming deep and broad buyer participation before Bitcoin reached its then-all-time high. The current reading of approximately +0.01 is 75% below that 2021 peak conviction level — while Bitcoin’s price is pushing toward the same $100K resistance zone that capped the prior cycle.
That gap is the divergence Moreno is flagging. Price is higher. Buy pressure conviction is lower. If the delta rolls over here — stalling at +0.01 and declining while Bitcoin attempts new highs toward $100K — the pattern would mirror the 2021 topping structure, where maximum buy pressure preceded the collapse, not the continuation.
The Historical Parallel — 2021 Topping Pattern
The 2021 comparison is not decorative. The Buy/Sell Pressure Delta hit its cycle peak of +0.04 approximately two to three months before Bitcoin’s November 2021 all-time high near $69,000. By the time price reached its peak, the delta had already begun rolling over — a classic leading indicator divergence. The subsequent decline took Bitcoin from $69,000 to a cycle low near $15,500, a drawdown of approximately 77.5%.
The current structure shows the delta recovering but stalling at +0.01 — one-quarter of the 2021 peak conviction — while price is approaching the same general zone of prior resistance ($100K). Moreno’s warning is that this configuration could produce a second instance of the same divergence pattern. Bitcoin’s recent price resilience near the $83K–$84K zone — as covered in detail in our earlier report on Bitcoin absorbing $276M in Bitget outflows while holding $83K–$84K — demonstrates genuine structural demand, but on-chain pressure must now confirm it.
What Bulls Need to See
The setup is not automatically bearish. It is conditional. The bullish resolution requires the 90-day delta to break decisively above +0.02 — crossing from tentative recovery into confirmed buy pressure territory — as Bitcoin pushes toward $100K. That would confirm the rally has structural support, not just price momentum on thin volume.
The specific threshold to watch:
| Delta Reading | Market Interpretation | Historical Analog |
|---|---|---|
| Below 0.00 (negative) | Seller-controlled flow | 2022 bear market |
| +0.01 (current) | Tentative recovery — decision zone | Mid-cycle inflection points |
| +0.02 to +0.03 | Confirmed buyer dominance | Early 2023 bull resumption |
| +0.04 | Peak cycle conviction | Q1–Q2 2021 bull top |
Buy/Sell Pressure Delta thresholds | Source: CryptoQuant via @MorenoDV_
A sustained move to +0.02 or above would invalidate the bearish divergence thesis and confirm this as a genuine bull continuation. Failure to clear that level — followed by a rollover — keeps the 2021 topping parallel alive.
For broader context on what a confirmed bull regime looks like using composite on-chain metrics, see our prior analysis on Tom Lee’s bull market declaration, which outlines the macro framework within which this on-chain reading sits.
Bullish Scenario — Delta Breaks Above +0.02
If the 90-day Buy/Sell Pressure Delta clears +0.02 with sustained momentum as Bitcoin holds above $83,000, the divergence thesis is invalidated. The path to $100,000 — the maximum buy pressure resistance zone identified in the chart — becomes structurally supported. A confirmed delta breakout at this stage of the cycle would be the highest-conviction on-chain confirmation of bull continuation currently available.
Bearish Scenario — Delta Rolls Over Below +0.01
If the delta stalls at the current +0.01 reading and begins declining while Bitcoin’s price pushes higher — even toward $90,000 or $95,000 — the divergence pattern is live. The 2021 analog suggests that price peaks formed two to three months after the delta began rolling over. A rollover here would not guarantee an immediate top, but it would remove the on-chain confirmation that bulls require and flag $83,000 as a critical support level to monitor for structural breakdown.
The One Number That Settles the Debate
The Buy/Sell Pressure Delta at +0.01 is neither confirming nor negating the rally. It is at the exact inflection point where the market’s structural conviction will be revealed. The $100K resistance zone is 20.4% above current price. Whether Bitcoin reaches it on genuine buying pressure or on deteriorating flow — that answer is not in the price chart. It is in the delta reading over the next four to six weeks.
Watch the 90-day Buy/Sell Pressure Delta on CryptoQuant. A decisive move above +0.02 confirms the bull. A rollover below +0.005 while price climbs reopens the 2021 divergence playbook. The current reading of +0.01 demands patience before conviction.
Source: x.comFrequently Asked Questions
What is the Buy/Sell Pressure Delta and why does the +0.01 reading matter for Bitcoin?
What specific level must the Buy/Sell Pressure Delta reach to confirm Bitcoin’s rally is structurally supported?
How does the current Bitcoin on-chain setup compare to the 2021 cycle top?
What price level should traders monitor as the critical support if the delta begins rolling over?
Source: CryptoQuant · Published by CoinsProbe Markets Desk
The opinions and market insights shared on CoinsProbe represent the views of individual authors based on prevailing market conditions at the time of publication. Cryptocurrency investments carry significant risk and volatility. Readers are encouraged to conduct their own research and seek professional financial advice before making investment decisions. CoinsProbe and its contributors do not accept responsibility for financial losses or decisions made based on published content.
CoinsProbe may publish sponsored articles, affiliate links, or promotional collaborations. All sponsored material is clearly labeled to maintain transparency with our audience. Our editorial decisions remain fully independent, and advertising partnerships do not influence reviews, rankings, or published opinions.
Since 2023, CoinsProbe has delivered reliable insights on cryptocurrency, blockchain, and digital assets. Our content is created by experienced researchers and analysts who follow strict editorial standards focused on accuracy, transparency, and credibility. Every article is carefully reviewed and verified using trusted sources and current market data. We provide unbiased analysis and timely updates covering everything from emerging crypto projects to major industry developments.