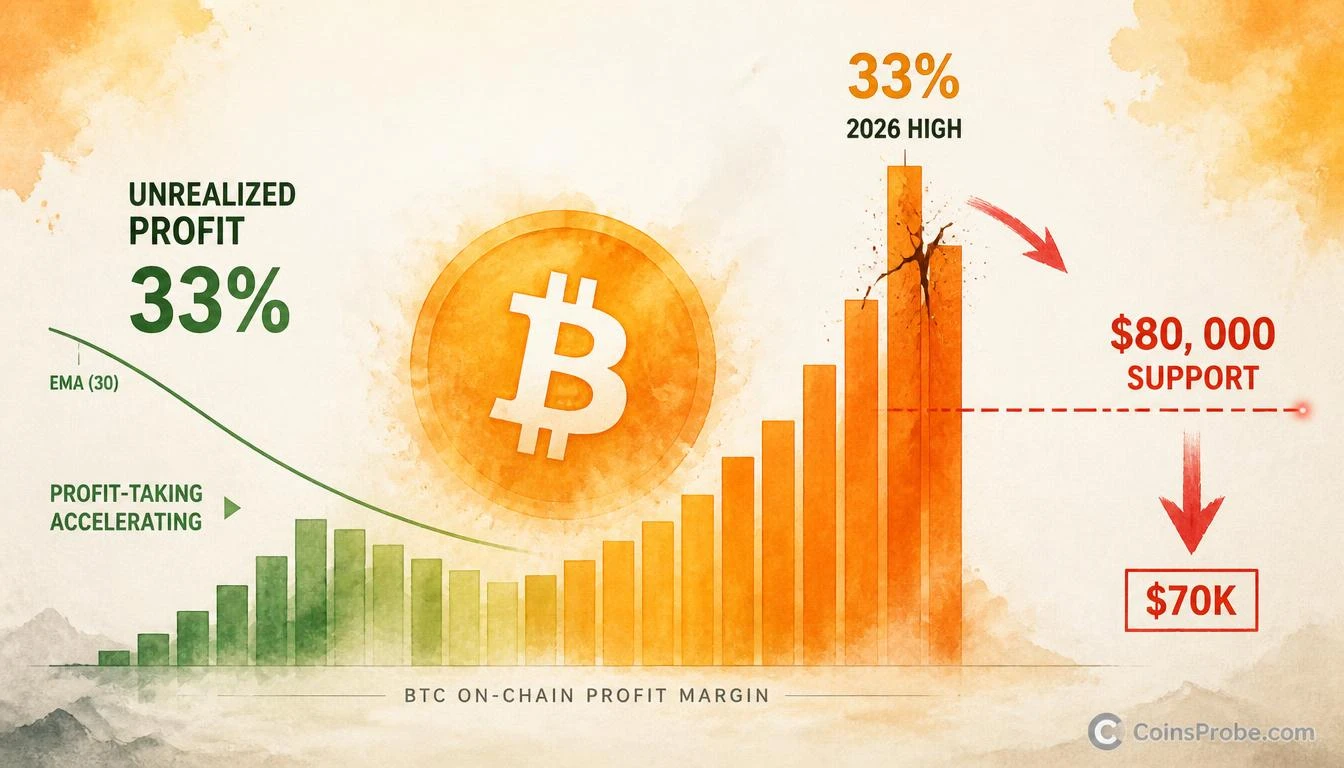

- Bitcoin's unrealized profit margin hit 33% — a 2026 high and the highest reading since December 2024, per CryptoQuant
- Profit-taking volume reached its highest point of 2026, with demand metrics simultaneously fading
- $80,000 is the first critical on-chain support — loss of this level risks a deeper retracement toward $70,000
- Bull market structure remains intact: Bitcoin is still trading above its realized price on-chain
Bitcoin is trading near $82,600–$83,600 as on-chain data delivers one of its clearest distribution warnings of the year. Traders are locking in gains at the fastest pace since the cycle began, unrealized profit margins have hit a 2026 high of 33%, and demand is measurably softening. The bull market structure remains intact — but the rally is showing real cracks, not sentiment noise.
That assessment comes directly from CryptoQuant, the on-chain analytics platform whose analysts track Bitcoin’s realized profit and loss flows in real time. Their exact words: “Holders are cashing in. Profit-taking just hit a 2026 high, trader unrealized profits reached 33%, and demand is fading. The bull market is intact, but the rally is showing cracks. $80K is the first support to watch.” That is not a hedged observation — it is a declarative, data-backed conclusion with a specific level attached.
The On-Chain Signal — Unrealized Profit Margin at 33%
The Unrealized Profit/Loss Margin measures what percentage of Bitcoin’s circulating supply is sitting in profit relative to its cost basis, expressed as a margin above or below breakeven. When this reading climbs sharply, it signals that a large share of the market is deep in profit — and historically, that is when distribution pressure intensifies as holders convert unrealized gains into realized ones.
CryptoQuant’s chart shows the margin has reached approximately 33% — the highest reading in 2026 and the highest since December 2024. The green bars representing unrealized profit are expanding while the 30-period EMA on the margin line is curling lower, a configuration that has historically coincided with local tops rather than continuation. Critically, prior 40%+ margin readings — seen during Bitcoin’s run toward $103,000–$105,000 — preceded significant pullbacks, including the correction from roughly $110,000 back toward $75,000. At 33%, the current reading sits just below that historically dangerous threshold, suggesting sellers are active but not yet exhausted.
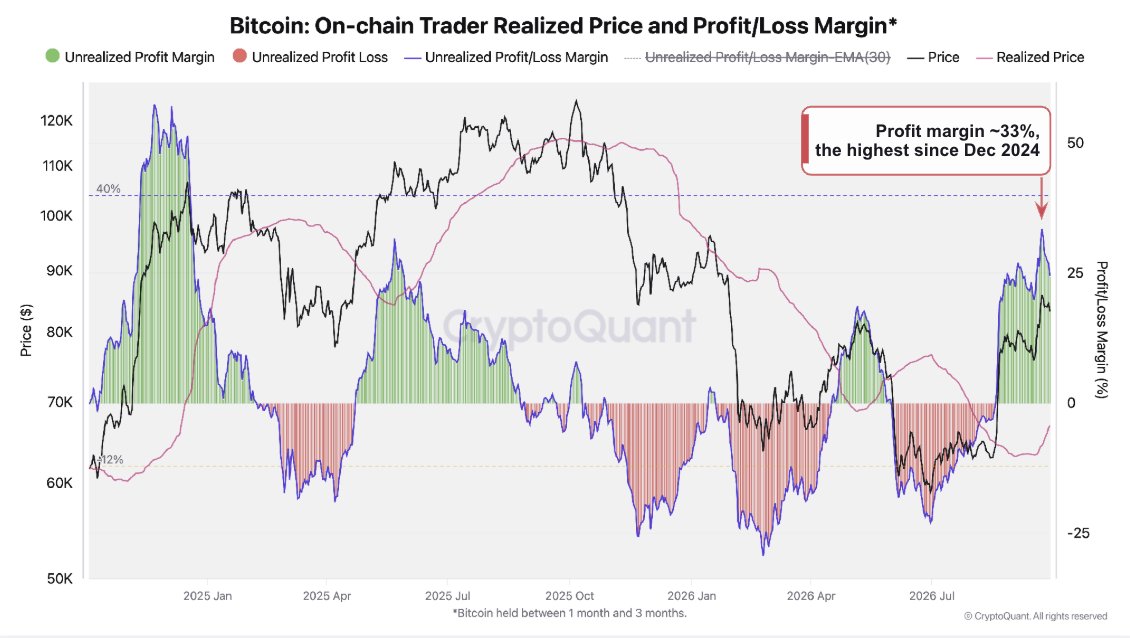
The bull market structural argument remains supported by one key data point: Bitcoin’s price is still trading above its realized price — shown in pink on the CryptoQuant chart — meaning the average coin in circulation was acquired at a lower price than today’s market price. That is the technical definition of a bull market regime on-chain. The warning is not about regime change. It is about near-term distribution within a functioning bull market.
Profit-Taking at a 2026 High — What That Actually Means
Profit-taking metrics measure the volume of Bitcoin being moved on-chain at a price higher than its acquisition cost — in other words, coins moving into exchanges or wallets at a realized gain. When this metric hits a cycle high, it means more Bitcoin is being sold for profit right now than at any prior point in 2026. That is supply entering the market from a position of strength, not panic.
This matters for price because realized profit is not a lagging indicator — it is a direct measure of sell-side pressure. Every Bitcoin sold for profit is a coin that moved from a long-term holder to a shorter-term buyer, typically at or near current market prices. If demand cannot absorb that flow at current levels, price must fall to find clearing prices where buyers are willing to step in. CryptoQuant’s note that demand is fading compounds the concern: rising supply from profit-takers meeting declining new demand is the textbook setup for a near-term correction.
For context on how these dynamics have played out historically, the Bitcoin LTH MVRV analysis at CoinsProbe tracks how long-term holder behavior has historically preceded major price inflections — the current profit-taking surge follows a similar script.
$80,000 — Why This Level Is Structural, Not Arbitrary
CryptoQuant’s designation of $80,000 as the first critical support is grounded in on-chain cost basis data, not technical charting preference. The $80,000 zone represents a dense cluster of realized prices for coins acquired during Bitcoin’s prior accumulation range — meaning a large cohort of holders have a cost basis near this level. A sustained close below $80,000 would push those holders into unrealized loss territory, historically the point at which conviction weakens and selling accelerates.
The chart analysis reinforces this: below $80,000, the next meaningful support cluster sits in the $70,000 zone, with the 12% loss threshold from current levels placing a floor near $60,000 in an extended drawdown scenario. Those are not targets — they are the levels where historical on-chain data shows buyers have previously absorbed distribution pressure and reversed price.
One useful parallel: the $70,000–$75,000 reload zone cited by CryptoQuant’s chart as a potential re-entry area sits just below the $80,000 support. If profit-taking volume does not abate and demand continues to fade, that is the range where compression of the margin toward 0% — a historical capitulation signal — would be expected to emerge.
Bull Market Intact — But Cracks Are Measurable
The distinction CryptoQuant draws is precise and worth preserving. This is not a bear market call. Bitcoin trading above its realized price means the structural bull market regime is technically unchanged. What the data identifies is a local exhaustion signal — a period where the rally has generated enough profit to incentivize mass distribution, and where demand has not kept pace with that supply.
This mirrors the setup that preceded corrections earlier in the cycle. When the margin was at 40%+ near the $103,000–$105,000 resistance zone, the subsequent correction reached $75,000 — a drawdown of approximately 28%. The current 33% margin reading, if it follows the same arc without reaching the 40% threshold, implies a shallower but still meaningful pullback, with $80,000 as the first test.
For traders who have tracked Bitcoin’s demand metrics across timeframes, this aligns with broader observations about cycle behavior — the same on-chain framework that flagged recovery in earlier stress periods is now quantifying the cooling at the top of the rally range.
Bullish Scenario — $80K Holds as Support
If Bitcoin defends the $80,000 level on a closing basis — particularly a weekly close — the profit-taking wave could be absorbed without structural damage. A compression of the unrealized profit margin back toward 20%–25% would signal that distribution has run its course and a new demand cohort has stepped in at lower prices. In that case, the path back toward $103,000–$105,000 resistance reopens, with the prior all-time high zone as the next meaningful target above.
Bearish Scenario — $80K Fails on a Close
A sustained daily or weekly close below $80,000 removes the structural on-chain support that has kept this bull market intact. In that scenario, the chart identifies $70,000 as the next demand zone, with $60,000 representing the 12% loss threshold from realized price — a level that has historically triggered capitulation and forced selling from weaker hands. The margin compression toward 0% in that range would be the on-chain signal to watch for a potential reversal and re-entry.
Bitcoin’s broader on-chain regime has not broken. But the data from CryptoQuant is unambiguous: profit-taking is at a 2026 high, unrealized profit margins are at their most elevated reading since December 2024, and demand is measurably fading. That combination has preceded corrections within bull markets before. Watch $80,000 — a weekly close below it opens the $70,000 test. A hold at $80,000 keeps the continuation case alive.
Frequently Asked Questions
What does a 33% unrealized profit margin mean for Bitcoin right now?
Why is $80,000 specifically the level CryptoQuant is watching?
Is this profit-taking signal a sign the Bitcoin bull market is ending?
What on-chain metric would signal a safe re-entry after a pullback?
Source: CryptoQuant · Published by CoinsProbe Markets Desk
The opinions and market insights shared on CoinsProbe represent the views of individual authors based on prevailing market conditions at the time of publication. Cryptocurrency investments carry significant risk and volatility. Readers are encouraged to conduct their own research and seek professional financial advice before making investment decisions. CoinsProbe and its contributors do not accept responsibility for financial losses or decisions made based on published content.
CoinsProbe may publish sponsored articles, affiliate links, or promotional collaborations. All sponsored material is clearly labeled to maintain transparency with our audience. Our editorial decisions remain fully independent, and advertising partnerships do not influence reviews, rankings, or published opinions.
Since 2023, CoinsProbe has delivered reliable insights on cryptocurrency, blockchain, and digital assets. Our content is created by experienced researchers and analysts who follow strict editorial standards focused on accuracy, transparency, and credibility. Every article is carefully reviewed and verified using trusted sources and current market data. We provide unbiased analysis and timely updates covering everything from emerging crypto projects to major industry developments.