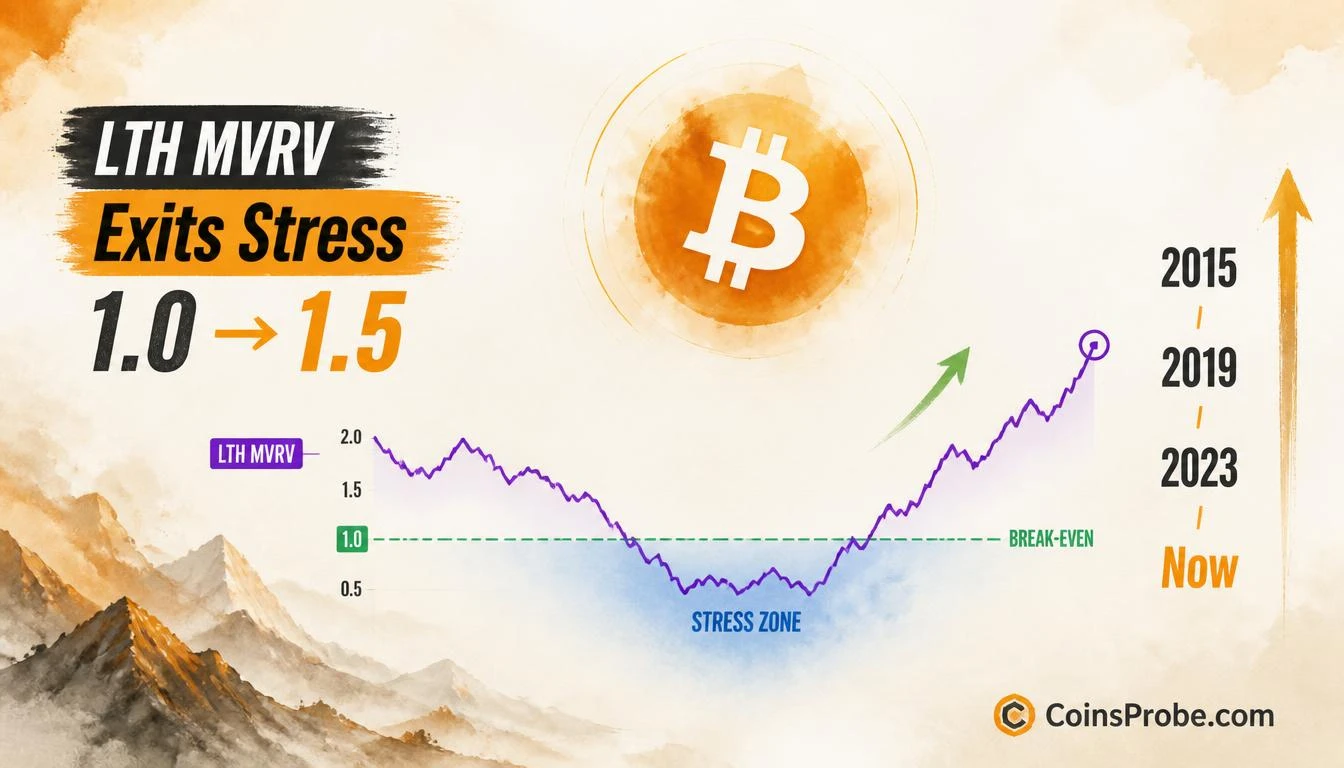

- Bitcoin's 6M–10Y LTH Adjusted MVRV has crossed back above 1.0, exiting shallow stress — per @_Crypto_glass via CryptoQuant
- Every prior sub-1.0 exit in this cohort (2012, 2015, 2019, 2023) preceded a sustained Bitcoin bull run
- Current MVRV reading ~1.2–1.5 vs. historical sell-signal exhaustion zone at 8–10 — significant headroom remains
- Watch $85,000–$88,000 as the structural floor; a sustained break below returns cohort to loss territory
Bitcoin is trading at approximately $97,000 — and beneath that price, one of the most consequential on-chain resets of this cycle has just completed. The Adjusted Long-Term Holder MVRV for the 6-month to 10-year cohort has crossed back above 1.0, exiting what CryptoQuant classifies as a shallow stress zone. This is not a speculative signal. It is a documented regime transition that has preceded every major Bitcoin bull run since 2012.
The observation comes from @_Crypto_glass, published through @cryptoquant_com. Their exact framing: “The 6M–10Y cohort has moved out of shallow sub-1.0 stress and back into aggregate profit. This is a constructive reset for this holder group, not a deep or persistent loss phase.” That distinction — constructive reset versus deep capitulation — is the analytical load-bearing point of this entire signal.
What the Adjusted LTH MVRV Actually Measures
The MVRV ratio compares an asset’s market value to its realized value — in simpler terms, it compares what Bitcoin is worth today versus what holders paid for it. A reading below 1.0 means the cohort is, in aggregate, holding at a loss. A reading above 1.0 means they have returned to aggregate profit.
The Adjusted variant applied here strips out coins that are likely lost or permanently dormant, producing a cleaner read of active long-term conviction holders. The 6-month to 10-year cohort filters further — these are not traders. These are investors who have held through multiple cycles, through 80% drawdowns, through protocol crises. Their collective cost basis moving back above market price is structurally meaningful in a way that short-term holder data is not.
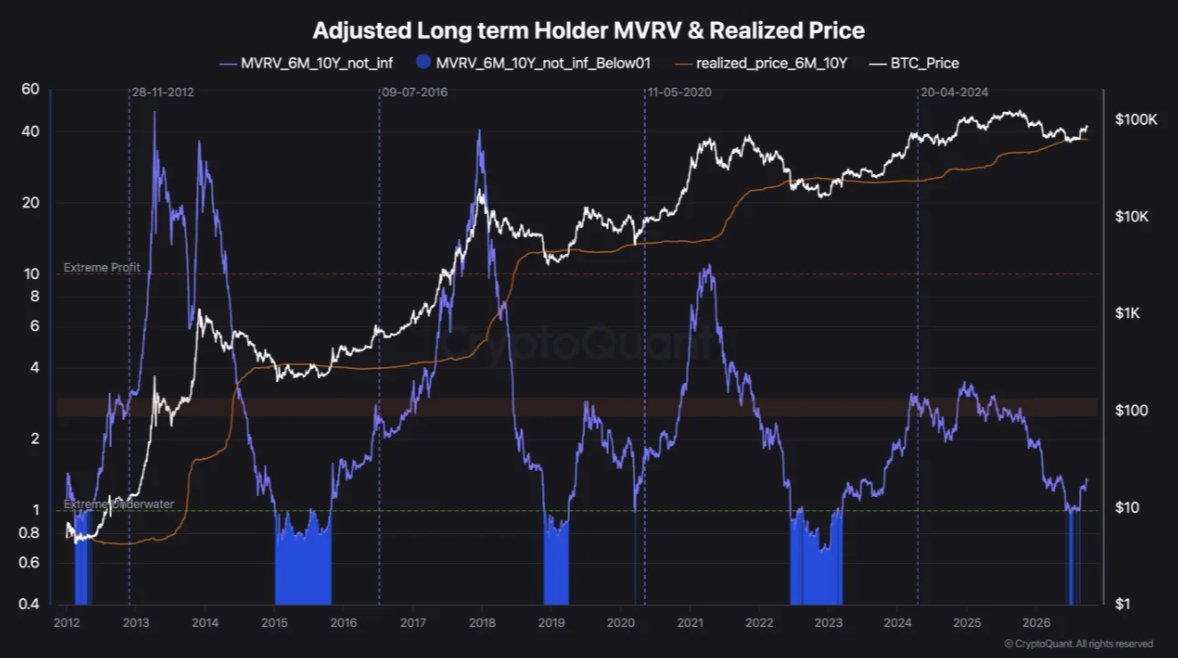
When this cohort dips below MVRV 1.0, it enters what the chart defines as an “Extreme Underwater” zone — shaded in blue. These episodes are rare, brief, and historically have resolved in only one direction.
The Historical Pattern — 2012, 2015, 2019, 2023, and Now
The chart shared by @_Crypto_glass spans 2012 through 2026, and the blue stress zones appear clearly at five distinct moments. Each prior resolution — the MVRV crossing back above 1.0 — preceded a sustained multi-month advance in Bitcoin’s price. The 2015 exit preceded Bitcoin’s climb from approximately $250 to $20,000 across the following two years. The 2019 exit preceded the recovery from the $3,200 bear market low. The 2023 exit followed the FTX capitulation low near $15,500 and preceded the rally that eventually carried Bitcoin past $100,000.
The current 2025–2026 stress episode — visible as the most recent blue zone on the chart — is now resolving in identical fashion. MVRV is crossing back above 1.0, with the current reading estimated at approximately 1.2–1.5. This is not near any historical sell-signal territory. Prior cycle peaks saw the Adjusted LTH MVRV reach readings of 8 to 10. The distance between current levels and historical exhaustion zones represents substantial potential upside before this cohort reaches the profit levels that have historically triggered distribution.
@_Crypto_glass’s chart reveals the purple MVRV line exiting the blue shaded zone and returning to positive territory — mirroring the structural recovery patterns of 2012, 2015, 2019, and 2023. The realized price trend (shown in orange) continues moving upward, confirming that the long-term cost basis is expanding in a healthy, non-parabolic fashion.
Why “Constructive Reset” Matters More Than “No Capitulation”
The specific language @_Crypto_glass uses — constructive reset — carries analytical weight. A deep capitulation event, such as what occurred in late 2022, forces long-term holders into realized losses and often triggers forced selling cascades. That is a different market structure than what the data shows today.
The current sub-1.0 episode was shallow and short-lived. Long-term holders did not sell in distress. The cost basis of the 6M–10Y cohort remained close enough to market price that the return to profit required only a modest price recovery — not a new all-time high. That is the definition of healthy consolidation: a reset that restores the cohort to aggregate profit without requiring the kind of violent repricing that shakes out weak hands at scale.
This also matters for what it rules out. A persistent sub-1.0 reading — lasting months with no recovery — would suggest structural selling pressure from even the most committed holders. That is not what the data shows. The stress was temporary. The exit is now confirmed.
For context on how institutional demand is reinforcing this on-chain picture, Crypto Spot ETFs recently logged $2.71B in weekly net inflows with Bitcoin commanding 70.8% of that share — a structural demand signal that complements the LTH MVRV reset. And the short-term picture is similarly constructive: BTC short-term holder selling recently hit multi-year lows while a 2022 reversal fractal aligned — two timeframes now pointing in the same direction.
What This Does Not Confirm
The MVRV exit from stress is a regime signal, not a price prediction. It confirms that the structural condition of the long-term holder base has normalized — it does not specify when Bitcoin will make its next leg higher, nor does it guarantee a specific percentage gain. Prior post-stress recoveries ranged from moderate (2019’s 150% recovery before the COVID crash interrupted) to extreme (the 2015 exit preceding an eventual 8,000%+ advance to the 2017 peak).
The signal also does not rule out short-term price volatility. Bitcoin could retest the $88,000–$90,000 range and the MVRV would still read constructively if that dip remained brief. What would invalidate the signal is a sustained return below MVRV 1.0 — meaning price drops sharply enough, for long enough, that the 6M–10Y cohort re-enters aggregate loss territory.
Bullish Scenario
Bitcoin holds above $90,000 as a floor, MVRV continues rising toward the 2.0–3.0 range — a level consistent with mid-cycle momentum phases in 2016 and 2020 — and the realized price trend continues expanding. Historical precedent from the 2023 equivalent exit suggests a sustained multi-month advance with intermediate targets at $110,000, $130,000, and eventually the MVRV 8–10 exhaustion zone that has historically corresponded with cycle peak pricing.
Bearish Scenario
A decisive break below $85,000 sustained over multiple weeks would push the 6M–10Y cohort back into sub-1.0 MVRV territory, invalidating the constructive reset interpretation and signaling that the stress phase is not yet resolved. That outcome would shift the analytical framework from recovery to potential prolonged consolidation.
The Level Traders Are Watching
The MVRV 1.0 threshold is now the key structural line. As long as Bitcoin’s price sustains the conditions that keep the 6M–10Y cohort in aggregate profit — broadly, price above approximately $85,000–$88,000 based on current cohort cost basis estimates — the reset thesis remains intact. The next meaningful resistance in MVRV terms is not price resistance but ratio resistance: the 3.0 level, which in prior cycles marked the transition from early recovery to full bull market acceleration. At current readings of 1.2–1.5, that zone remains well ahead.
The Adjusted LTH MVRV has exited shallow stress in four prior cycles — 2012, 2015, 2019, and 2023. Each time, the outcome was not a modest bounce. Each time, it was the beginning of a sustained advance. The current exit carries the same structural fingerprint. MVRV at approximately 1.2–1.5 against a historical exhaustion ceiling of 8–10 means the cohort with the strongest hands in the market has just returned to profit, and history says they will not sell until that ratio is a multiple of where it stands today. Watch $85,000 as the level that, if lost on a sustained basis, forces a reassessment of everything above.
Frequently Asked Questions
What is the Adjusted LTH MVRV and why does a reading below 1.0 matter?
How many times has the 6M–10Y LTH MVRV exited a sub-1.0 stress zone before, and what happened?
At MVRV 1.2–1.5, how far is Bitcoin from historical cycle peak exhaustion levels?
What price level would invalidate the constructive reset signal?
Source: CryptoQuant · Published by CoinsProbe Markets Desk
The opinions and market insights shared on CoinsProbe represent the views of individual authors based on prevailing market conditions at the time of publication. Cryptocurrency investments carry significant risk and volatility. Readers are encouraged to conduct their own research and seek professional financial advice before making investment decisions. CoinsProbe and its contributors do not accept responsibility for financial losses or decisions made based on published content.
CoinsProbe may publish sponsored articles, affiliate links, or promotional collaborations. All sponsored material is clearly labeled to maintain transparency with our audience. Our editorial decisions remain fully independent, and advertising partnerships do not influence reviews, rankings, or published opinions.
Since 2023, CoinsProbe has delivered reliable insights on cryptocurrency, blockchain, and digital assets. Our content is created by experienced researchers and analysts who follow strict editorial standards focused on accuracy, transparency, and credibility. Every article is carefully reviewed and verified using trusted sources and current market data. We provide unbiased analysis and timely updates covering everything from emerging crypto projects to major industry developments.