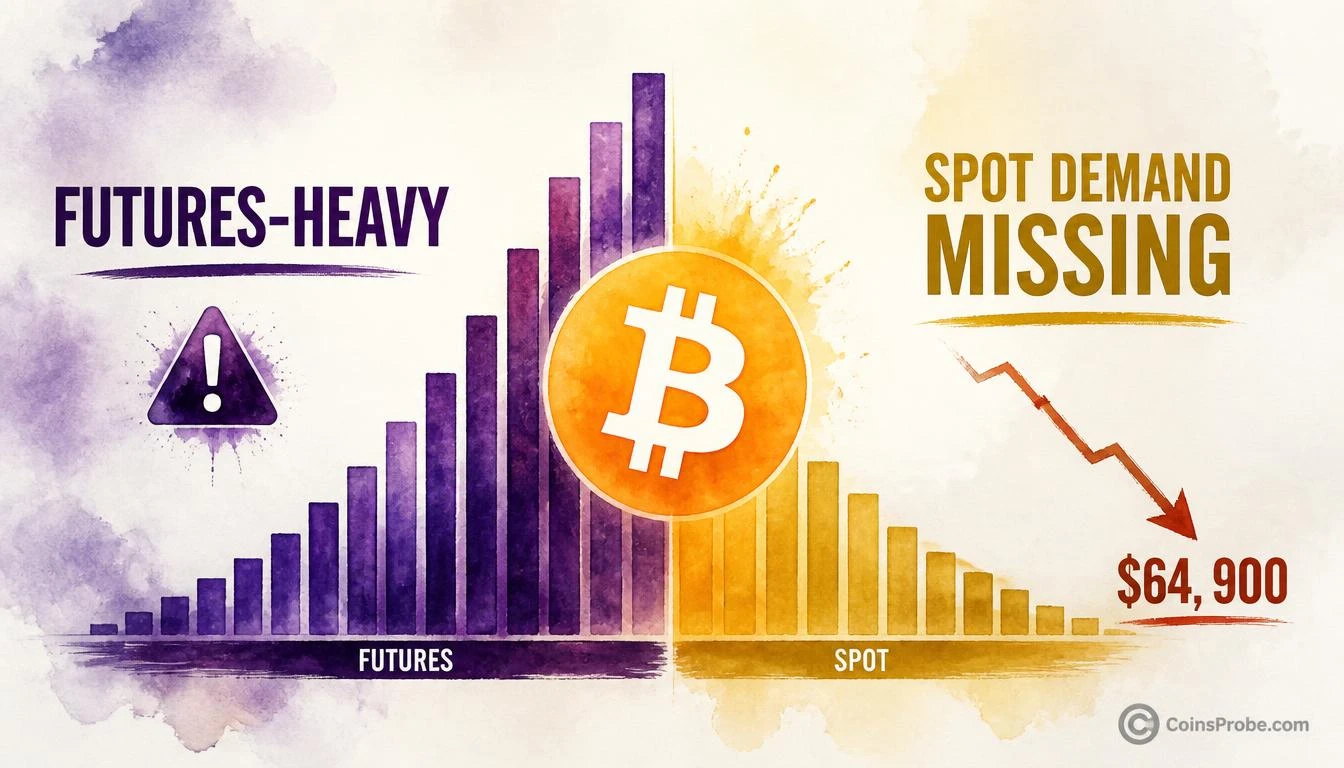

- Bitcoin trades at $84,456 (+0.31% 24h) as Binance dominance chart shows near-total futures-heavy (purple) bar dominance
- CryptoQuant analyst Darkfost warns: spot demand "remains the missing piece" — futures-led rebounds "could quickly become unstable"
- Spot-dominant baseline sits at $64,900 — a futures unwind without spot re-entry risks a 23% drawdown from current levels
- Watch for gold (spot-dominant) bars returning on Binance dominance chart as the single structural confirmation signal
Bitcoin is trading at $84,456 — up just 0.31% in the past 24 hours — with a market cap of $1.697 trillion. The flat price action masks a structural problem beneath the surface: the current rebound is being driven almost entirely by futures activity, while spot demand — the engine behind every durable Bitcoin rally in this cycle — remains absent.
That warning comes directly from CryptoQuant analyst Darkfost (@Darkfost_Coc), who writes: “Right now, that spot demand remains the missing piece, and without it, this rebound driven mostly by futures could quickly become unstable.” The signal is drawn from Binance’s spot-vs-futures dominance data — a real-time gauge of whether Bitcoin’s price is being lifted by genuine buying or by leveraged positioning.
What Spot-vs-Futures Dominance Actually Measures
This is not a price chart. It is a market structure chart. On Binance — the world’s largest crypto exchange by volume — each daily bar is classified as either spot-dominant (gold), balanced (pink), or futures-heavy (purple), depending on which side of the market is driving price action. When spot buyers are active, they absorb sell pressure with real capital — there is no leverage to unwind. When futures dominate, the price move is built on margin: positions that can be liquidated the moment conditions shift.
The distinction matters enormously for durability. A spot-led rally requires real demand to reverse. A futures-led rally can collapse in hours if funding rates spike or sentiment turns, triggering cascading liquidations with no spot bid beneath them.
The Chart — Futures Purple Has Taken Over
The Binance dominance chart shared by @cryptoquant_com covers January 2023 through September 2026 on daily bars. The picture it presents is stark: recent bars are overwhelmingly purple — futures-heavy — while spot-dominant gold bars and balanced pink bars have nearly disappeared from the sequence. This is not a minor shift. It is a near-complete transition in who is moving Bitcoin’s price.
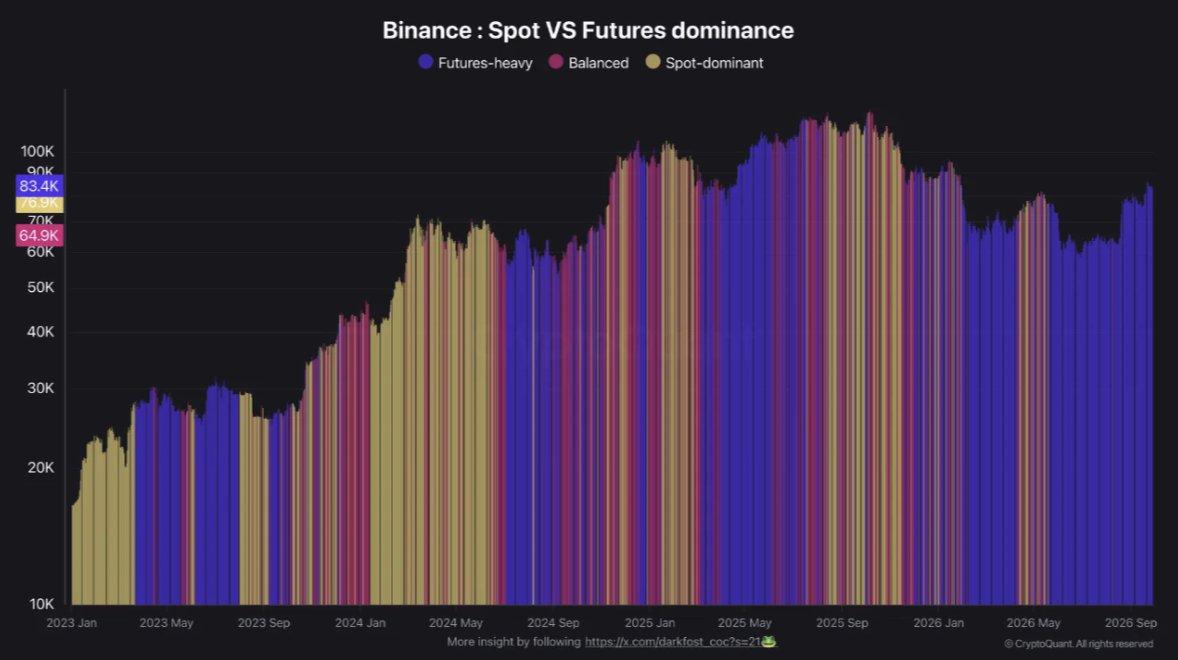
The chart identifies three reference zones worth anchoring to. The spot-dominant baseline sits near $64,900 — the level at which spot buyers were the primary driver. A balanced zone exists around $76,900, where neither futures nor spot was decisively dominant. The peak resistance from the September 2025 cycle high registered near $105,000 — a level reached when spot demand was actively present. Bitcoin is currently at $84,456, sitting in territory where futures have fully taken command.
Why This Pattern Has Preceded Corrections Before
Darkfost’s analysis points to mid-2024 as the clearest historical parallel. During that period, a similar divergence emerged on Binance: futures volume surged and drove price higher while spot participation contracted. The result was not a sustained advance — it was instability followed by a sharp correction back into the zone where spot buyers had previously established support.
The contrast with genuine rallies is instructive. The May 2024 recovery and the January 2025 cycle peak were both accompanied by heavy spot-dominant bars on this same chart. Those moves had a structural foundation: real capital entering the market, absorbing sell pressure, and anchoring price at successively higher levels. The current move has none of that. Futures positioning can create the appearance of momentum, but it cannot create the demand necessary to hold a level under pressure.
This is directly relevant to the broader question of whether Bitcoin’s recent recovery from the mid-$70,000s represents a genuine trend reversal or a leveraged bounce. As Bitcoin’s buy pressure has been sitting at a decision point, the composition of that pressure — not just its magnitude — is what determines whether a rally holds.
The Risk Scenario — What an Unwind Looks Like
If spot demand fails to re-enter and futures positioning becomes overextended, the liquidation math is straightforward. Darkfost’s chart identifies the $64,900–$76,900 zone as the support band where spot buyers last held meaningful positions. A futures unwind that finds no spot bid at current levels could rapidly compress price back toward that range — a move of 9% to 23% from current prices.
This does not require a macro catalyst. Leveraged markets unwind on their own mechanics: funding rate spikes reduce the incentive to hold long futures positions, stop-loss clusters accelerate selling, and without spot absorption, each level breaks faster than the last. The $76,900 balanced zone is the first line of real structural interest. Below that, $64,900 is where spot dominance was last genuinely established.
It is worth comparing this to what happened when Bitcoin absorbed $276 million in exchange outflows earlier this cycle — price held the $83K–$84K range, but only because spot demand was actively present to absorb the flow. That condition no longer appears to be in place.
Bullish Scenario — Spot Demand Returns
If spot-dominant gold bars begin reappearing on the Binance dominance chart — particularly with sustained volume above the $76,900 balanced zone — the futures-led rebound gains structural credibility. A rotation back toward spot dominance at current prices would represent genuine demand entering at $84,000+, which would make the level defensible. A sustained move toward the $105,000 September 2025 resistance would require this transition to occur.
Bearish Scenario — Futures Unwind Without Spot Bid
Continued purple dominance with no spot re-entry, combined with any deterioration in macro sentiment or a funding rate spike, creates the conditions for a rapid retracement. The first support level to watch is $76,900. If that breaks without spot absorption, the next meaningful zone is the $64,900 spot-dominant baseline — representing a potential 23% drawdown from current levels.
The One Metric to Watch
Darkfost’s framework reduces to a single actionable data point: the color of the bars on Binance’s spot-vs-futures dominance chart. Not price. Not RSI. Not funding rates. The composition of volume. When gold and pink bars return in meaningful frequency at or above current price levels, the structural argument for this rebound changes. Until then, the foundation remains thin.
Tom Lee’s bull market declaration rests on macro and sentiment conditions — but on-chain market structure data from CryptoQuant tells a more cautious story at the Binance level. Both can be true simultaneously: macro conditions improving while the specific mechanics of Bitcoin’s current move remain fragile.
Bitcoin is trading at $84,456. The rebound from mid-$70,000s lows is real in price terms, but Darkfost’s Binance dominance data makes clear it is built almost entirely on futures positioning rather than spot demand. The $64,900–$76,900 support band is what stands between the current price and a full reset to spot-dominant baseline conditions. Spot demand re-entry — visible as gold bars returning to the dominance chart — is the single confirmation signal that would change this structural assessment. Until it appears, watch $76,900 as the first meaningful test of whether any real bid exists beneath this move.
Source: x.comFrequently Asked Questions
Why does it matter whether Bitcoin’s rally is spot-driven or futures-driven?
What does the Binance spot-vs-futures dominance chart actually show right now?
What price levels matter most if the futures unwind without spot support?
What would confirm that spot demand has returned to Bitcoin?
Source: CryptoQuant · Published by CoinsProbe Markets Desk
The opinions and market insights shared on CoinsProbe represent the views of individual authors based on prevailing market conditions at the time of publication. Cryptocurrency investments carry significant risk and volatility. Readers are encouraged to conduct their own research and seek professional financial advice before making investment decisions. CoinsProbe and its contributors do not accept responsibility for financial losses or decisions made based on published content.
CoinsProbe may publish sponsored articles, affiliate links, or promotional collaborations. All sponsored material is clearly labeled to maintain transparency with our audience. Our editorial decisions remain fully independent, and advertising partnerships do not influence reviews, rankings, or published opinions.
Since 2023, CoinsProbe has delivered reliable insights on cryptocurrency, blockchain, and digital assets. Our content is created by experienced researchers and analysts who follow strict editorial standards focused on accuracy, transparency, and credibility. Every article is carefully reviewed and verified using trusted sources and current market data. We provide unbiased analysis and timely updates covering everything from emerging crypto projects to major industry developments.