- Bitcoin trades at $85,825 (-0.06% 24h) as MVRV MA30d breaks out of Accumulation Zone for second time in 2026
- CryptoQuant analyst @gaah_im: 6 months of MVRV compression below ~1.5 historically precedes "excellent returns" across Bitcoin's full cycle history
- Next MVRV resistance levels: Trend Zone (~2.2) then Distribution Zone (~3.0+) — breakout sustainability hinges on MVRV holding above ~1.5
Bitcoin is trading at approximately $85,825 — down 0.06% over the past 24 hours — with a market capitalization of $1.72 trillion. Beneath the flat headline price, a structural shift is registering on one of Bitcoin’s most historically reliable on-chain metrics: the MVRV 30-day moving average has broken out of the Accumulation Zone for the second time in 2026, after spending roughly six months compressing inside it.
The signal was flagged by CryptoQuant analyst @gaah_im, published via the official @cryptoquant_com channel. In their own words: “For about 6 months in 2026, the MVRV traded within this range, a pattern that, throughout Bitcoin history has signaled periods of intense accumulation followed by excellent returns.” That is not a hedged observation — it is a declarative historical conclusion drawn from a composite on-chain metric with a documented multi-cycle track record.
What the MVRV MA30d Actually Measures
Before citing the reading, the mechanism deserves precise explanation. MVRV — Market Value to Realized Value — divides Bitcoin’s current market capitalization by its realized capitalization, which is the aggregate cost basis of every coin on-chain valued at the price it last moved. A reading above 1.0 means the average holder is in profit. A reading below 1.0 means the average holder is at a loss. The 30-day moving average smooths daily noise to reveal structural regime shifts rather than short-term fluctuations.
CryptoQuant’s framework segments MVRV MA30d into three zones: the Accumulation Zone (below ~1.5), the Trend Zone (~2.2), and the Distribution Zone (~3.0 and above). Historically, the Accumulation Zone is where Bitcoin trades at or near aggregate cost basis — where long-term holders absorb supply from capitulating short-term sellers, compressing realized sell pressure to its lowest levels in a cycle.
Six Months of Compression — Then a Breakout
The chart shared by @gaah_im via CryptoQuant covers Bitcoin’s full history from 2019 through September 2026. The white price line sits near $86,600 at the time of the chart’s publication. The blue MVRV MA30d line spent the first eight-plus months of 2026 pinned within the Accumulation Zone — below the ~1.5 green threshold — before staging its first breakout earlier in the year, pulling back, and now confirming a second breakout from that same zone.
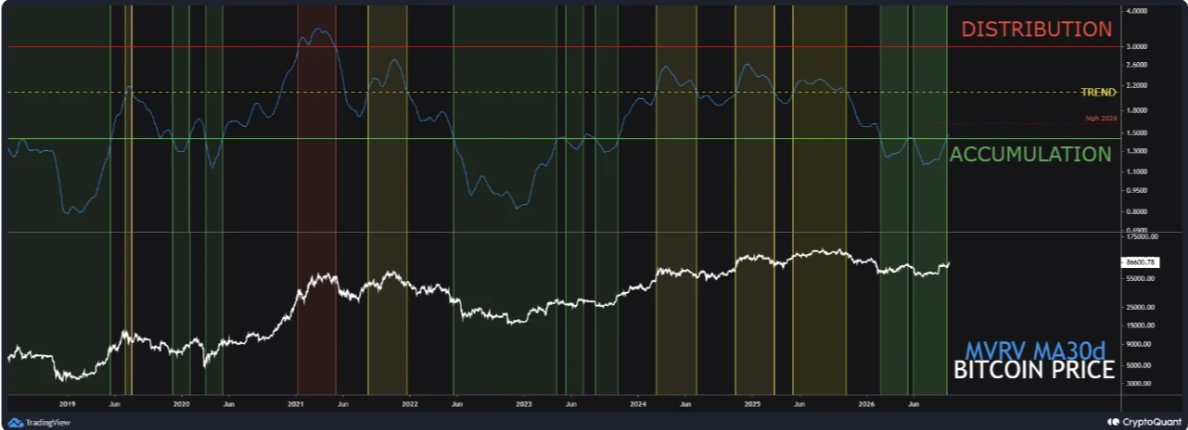
The green vertical bars on the chart correlate with prior accumulation phases. Red bars mark distribution. The current configuration — extended sideways MVRV compression followed by a structural break upward — has appeared at inflection points across multiple cycles in the dataset. The compression itself carries informational weight: six months of MVRV trading near the cost-basis level means coins have been changing hands at prices where sellers have little-to-no profit motive, dramatically reducing structural overhead supply.
What the Historical Precedents Show
The MVRV MA30d framework has a documented reading pattern across Bitcoin’s major cycle transitions. Each time the metric spent an extended period below the 1.5 accumulation threshold before breaking upward, it preceded a move toward the Trend Zone (~2.2) and ultimately the Distribution Zone (~3.0+). At Bitcoin’s current price of ~$85,825, reaching a MVRV reading of 2.2 (Trend Zone) would require meaningful price appreciation — the exact multiplier depends on how realized cap evolves, but the directional implication is consistent across prior cycles. The Distribution Zone at 3.0+ has historically corresponded with cycle-peak price ranges.
The critical distinguishing factor in this instance is duration. Six months of Accumulation Zone consolidation is an unusually extended compression. Shorter consolidations have produced rallies. Longer ones — as @gaah_im notes — have historically produced what the analyst describes as “excellent returns.” The mechanism is straightforward: the longer coins sit near cost basis without a flush below 1.0, the more supply has been absorbed by conviction holders rather than speculative traders.
What This Breakout Does and Doesn’t Confirm
The MVRV MA30d breakout confirms one specific structural fact: the aggregate Bitcoin holder base has shifted from near-breakeven to a net-profitable position, and that shift is now trending rather than flickering. What it does not confirm is the magnitude or timeline of any subsequent move. MVRV is a regime indicator — it identifies which zone the market occupies, not the exact price target or the weeks required to reach it. For corroborating on-chain evidence of this macro shift, readers tracking altcoin relative strength can reference this recent Ethereum clearing $2,700 analysis, which examines a parallel structural breakout in the broader crypto market.
The risk in this reading is also worth naming directly. Price at ~$85,825 has not yet confirmed the MVRV move with a sustained directional push. The metric leads price — it measures the cost basis relationship, not price momentum. A scenario where MVRV dips back into the Accumulation Zone would negate the breakout signal and reset the thesis.
Bullish Scenario — MVRV Holds Above 1.5 and Trends Toward 2.2
If the MVRV MA30d sustains above the ~1.5 accumulation threshold and trends toward the Trend Zone at ~2.2, historical precedent across 2019–2026 data supports a significant price rally from current levels. The next structural resistance on the MVRV chart is the Trend Zone (~2.2), followed by the Distribution Zone (~3.0+). Price would need to appreciate meaningfully for realized cap growth to be outpaced by market cap growth — the definition of MVRV expansion. Prior breakouts from six-month accumulation compressions have preceded the strongest upside legs of their respective cycles.
Bearish Scenario — MVRV Retreats Below 1.5
A rollover of the MVRV MA30d back into the Accumulation Zone — below ~1.5 — would indicate the breakout was a false start and that the aggregate holder base has returned to near-cost-basis territory. At current prices (~$85,825), that would likely coincide with a meaningful price decline. A flush toward or below realized value (MVRV approaching 1.0) would represent the full capitulation scenario that would reset the accumulation clock entirely.
The Level to Watch
The immediate threshold is binary: does the MVRV MA30d hold above the ~1.5 Accumulation Zone boundary or not? On price terms, watch whether Bitcoin can sustain levels that keep the MVRV trending upward — a failure to do so at $85,825 is not yet a disqualifying signal, but a sustained decline toward the mid-$70,000s would put the breakout in serious question. The next upside MVRV milestone — the Trend Zone at ~2.2 — is the structural confirmation level that would upgrade this from a breakout signal to a confirmed cycle acceleration. For additional structural context on how similar compression-then-breakout patterns have played out across other assets, see the SUI Parabolic SAR macro bull signal analysis.
Six months of MVRV compression inside the Accumulation Zone is not noise — it is the on-chain fingerprint of a market absorbing supply at cost basis. The breakout now registering for the second time in 2026 is the same structural signal that, per @gaah_im’s CryptoQuant analysis, has preceded Bitcoin’s strongest historical return periods. Whether this instance joins that track record will be answered by whether the MVRV MA30d holds above ~1.5 — and whether Bitcoin price sustains above $85,825 in the sessions ahead.
Frequently Asked Questions
What does the MVRV MA30d Accumulation Zone breakout mean for Bitcoin?
What level would invalidate the current MVRV breakout signal?
Why does six months of MVRV compression matter more than a shorter consolidation?
What are the next MVRV targets after the Accumulation Zone breakout?
Source: CryptoQuant · Published by CoinsProbe Markets Desk
The opinions and market insights shared on CoinsProbe represent the views of individual authors based on prevailing market conditions at the time of publication. Cryptocurrency investments carry significant risk and volatility. Readers are encouraged to conduct their own research and seek professional financial advice before making investment decisions. CoinsProbe and its contributors do not accept responsibility for financial losses or decisions made based on published content.
CoinsProbe may publish sponsored articles, affiliate links, or promotional collaborations. All sponsored material is clearly labeled to maintain transparency with our audience. Our editorial decisions remain fully independent, and advertising partnerships do not influence reviews, rankings, or published opinions.
Since 2023, CoinsProbe has delivered reliable insights on cryptocurrency, blockchain, and digital assets. Our content is created by experienced researchers and analysts who follow strict editorial standards focused on accuracy, transparency, and credibility. Every article is carefully reviewed and verified using trusted sources and current market data. We provide unbiased analysis and timely updates covering everything from emerging crypto projects to major industry developments.