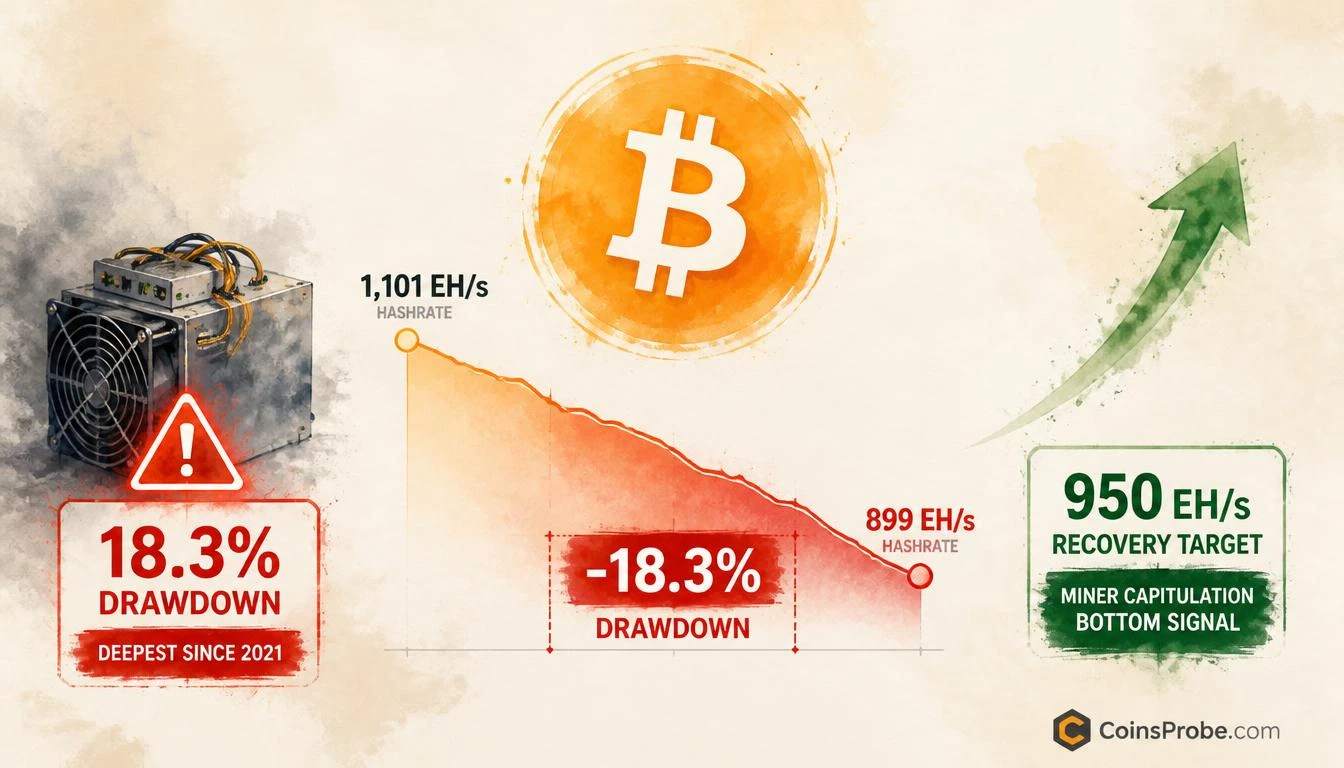

- Bitcoin True Hashrate fell from 1,101 EH/s to 899 EH/s — an 18.3% drawdown per CryptoQuant, deepest since China's 2021 mining ban
- Prior hashrate drawdowns of -8% to -10% in 2023 and 2024 both preceded significant BTC price recoveries
- BTC is currently trading at ~$78,000–$80,000, roughly 27% below its November 2025 all-time high of ~$105,000
- Watch True Hashrate recovery above 950 EH/s as the on-chain confirmation that miner capitulation has ended
Bitcoin is trading at approximately $78,000–$80,000, sitting roughly 27% below its November 2025 all-time high — and beneath the surface, the network is flashing one of its most historically significant stress signals since the 2021 China mining ban. The True Hashrate has collapsed 18.3% from peak, a reading that, in every prior instance, has marked the terminal phase of miner-driven selling pressure.
The data comes directly from CryptoQuant (@cryptoquant_com), which published the on-chain breakdown on September 22, 2026, stating: “Bitcoin True Hashrate peaked ~1,101 EH/s in Nov. 2025, then fell to about 899 EH/s on Aug. 6, 2026. That’s an 18.3% drawdown, which is the deepest since the 2021 China mining ban.” This is not a derivative metric. It is raw computational power — and right now, it is being switched off at a rate not seen in five years.
What Bitcoin True Hashrate Actually Measures
Before interpreting the signal, the mechanics matter. The True Hashrate is not the same as the reported hashrate figure commonly cited in headlines. Reported hashrate is estimated from block times and difficulty — it can spike artificially on short block intervals and lag on slow ones. True Hashrate, as tracked by CryptoQuant, applies statistical smoothing to eliminate noise and produce a cleaner representation of actual sustained computational power dedicated to the Bitcoin network.
When True Hashrate declines, it means miners — the economic backbone of Bitcoin’s security model — are physically disconnecting hardware. This happens for one reason: mining is no longer profitable at current prices relative to energy costs. Machines get switched off. Revenue dries up. The miners who remain are the most efficient operators with the lowest cost bases. This process is called miner capitulation, and it is among the most reliable on-chain signals in Bitcoin’s history.
Signal — 18.3% Drawdown: The Deepest Since China’s 2021 Mining Ban
The numbers are unambiguous. Bitcoin’s True Hashrate peaked at approximately 1,101 exahashes per second (EH/s) in November 2025 — a record high reflecting the post-halving mining boom and Bitcoin’s price push toward its all-time high. By August 6, 2026, that figure had dropped to approximately 899 EH/s, a contraction of 202 EH/s — or exactly 18.3% from peak.
To understand why this number matters, the historical comparison is essential. The CryptoQuant chart covering January 2023 through August 2026 shows every significant hashrate drawdown episode across that period. Previous notable drawdowns — including those in 2023 and mid-2024 — registered between approximately -8% and -10% from their respective peaks. The current -18.3% reading is more than double the depth of those prior stress events, and it now stands as the most severe hashrate contraction visible in the chart’s entire range — surpassed in modern Bitcoin history only by the forced exodus of Chinese miners in May–July 2021, when approximately 50% of global hashrate was physically relocated or shut down overnight due to a government ban.
The CryptoQuant chart shared on September 22, 2026 displays Bitcoin’s price (top panel, ranging from ~$15,000 in early 2023 to a peak near $105,000 in November 2025, with the current level near $78,000–$80,000) alongside the True Hashrate Drawdown percentage (bottom panel). The current drawdown bar reaches approximately -17% to -18% — visually the deepest red bar in the entire chart window. Prior drawdown episodes in 2023 and 2024 produced shallower dips before price recovered materially.
Why Deep Hashrate Drawdowns Historically Mark Price Bottoms
The mechanism connecting hashrate drawdowns to price bottoms is not coincidental — it is structural. When miners capitulate, they sell Bitcoin to cover operating costs before shutting down. This creates concentrated, sustained sell pressure on the market. However, capitulation has a ceiling: once unprofitable miners are offline, the selling stops. The remaining network is operated exclusively by efficient, low-cost miners who can sustain operations at current prices. At that point, the incremental sell pressure that had been suppressing price is mechanically removed.
The 2023 episode confirms this pattern. A hashrate drawdown in early 2023 — far shallower at roughly -8% — coincided with Bitcoin trading near its post-FTX lows around $15,000–$16,000. The recovery of hashrate that followed, as efficient miners expanded operations and price recovered, preceded Bitcoin’s rally from those lows through $30,000 by mid-2023 and ultimately to the $105,000 peak in November 2025. The mid-2024 drawdown episode showed a similar structure: hashrate stress, price consolidation, hashrate recovery, then a resumption of the broader uptrend. This is the pattern that traders are now mapping onto the current -18.3% reading — noting that the current episode is significantly more severe than either prior precedent, which historically correlates with a more exhaustive cleansing of the weakest operators from the network.
For further context on Bitcoin’s mining dynamics, CoinsProbe previously covered the structural shift in hashrate allocation in Bitcoin Hashrate Stalls at 934 EH/s — Miners Are Leaving for AI, which identified the early signs of this pressure building at the 934 EH/s level — well before the current 899 EH/s trough.
What the Data Says — And What It Doesn’t
What it says: At -18.3%, Bitcoin’s True Hashrate drawdown has reached a level of miner capitulation not seen since the 2021 China mining ban — a forced, externally-driven event. The fact that the current drawdown is approaching similar magnitude under organic market conditions confirms that significant mining infrastructure has been economically forced offline. Historically, such exhaustion phases have resolved with hashrate recovering and price following.
What it doesn’t say: A hashrate drawdown is a non-directional capitulation signal, not a precise price bottom call. The 2021 China ban produced a hashrate drawdown exceeding 50% before Bitcoin resumed its bull market — meaning the current -18.3% reading, while severe by modern standards, does not mechanically prevent further price discovery lower. The signal identifies exhaustion conditions, not an exact inflection date.
What to watch for confirmation: Hashrate recovery back above 950 EH/s on a sustained basis — indicating efficient miners are expanding rather than contracting — would be the primary on-chain confirmation that capitulation has run its course. Until that recovery is visible in the data, the signal flags a high-stress environment consistent with bottoming conditions, not a confirmed reversal.
The Macro Context — Price at $78,000–$80,000
Bitcoin’s current price range of $78,000–$80,000 sits approximately 27% below the November 2025 peak of ~$105,000. This correction magnitude, occurring alongside an 18.3% True Hashrate drawdown, places the current setup within the zone where prior cycles have seen the heaviest capitulation selling. The alignment of price drawdown and hashrate drawdown at these depths is precisely the condition that historically precedes structural recovery — once the selling pressure from distressed miners is exhausted.
The broader market context includes ongoing volatility across risk assets, with institutional positioning in Bitcoin products — including spot ETF flows tracked by SoSoValue — serving as the second variable traders are monitoring alongside hashrate recovery. CoinsProbe also noted the macro backdrop in USDT Dominance Completes 5-Wave Decline — Short-Term Crypto Pullback Ahead, which flagged near-term risk across the broader crypto market during this same period.
Bullish Scenario — Hashrate Recovery Above 950 EH/s
If Bitcoin’s True Hashrate stabilizes and recovers toward 950–1,000 EH/s over the coming weeks, it would confirm that the capitulation cycle has ended and efficient miners are re-expanding. Historically, hashrate recovery from deep drawdowns has preceded sustained price appreciation. A price reclaim of $90,000 would then open the path toward retesting the $105,000 all-time high and beyond, consistent with post-capitulation recovery patterns observed in 2023 and 2024.
Bearish Scenario — Hashrate Continues Falling Below 870 EH/s
If True Hashrate continues declining below 870 EH/s, it would signal that the capitulation phase has not yet exhausted and additional unprofitable miners remain to be forced offline. In this scenario, continued miner selling pressure would create headwinds for price recovery, potentially pushing Bitcoin toward the $65,000–$70,000 range before a more decisive bottom is established. The severity of the current drawdown already exceeds all modern precedents except 2021 — further deterioration would represent genuinely uncharted territory for the post-ETF era of Bitcoin mining.
Bottom Line
Bitcoin’s True Hashrate has fallen from a record 1,101 EH/s in November 2025 to 899 EH/s on August 6, 2026 — an 18.3% contraction that CryptoQuant confirms is the deepest since China’s 2021 mining ban forcibly expelled approximately half the global hashrate overnight. At the current price of ~$78,000–$80,000, the network is experiencing real miner capitulation: hardware is being switched off, operators are selling BTC to cover costs, and the weakest participants are being structurally eliminated from the network. In both the 2023 and 2024 episodes, shallower drawdowns of -8% to -10% preceded material price recoveries once hashrate stabilized. The current reading is more than double that depth — suggesting a more thorough cleansing, and historically, a more durable bottom once the selling exhausts. Watch the True Hashrate recovery above 950 EH/s as the primary on-chain confirmation that miner capitulation has run its course and the structural tailwind for price has returned.
Source: x.comFrequently Asked Questions
What is Bitcoin True Hashrate and how is it different from reported hashrate?
Why does an 18.3% hashrate drawdown signal a potential Bitcoin price bottom?
How does the current Bitcoin hashrate drawdown compare to the 2021 China mining ban?
What hashrate level would confirm Bitcoin’s miner capitulation is over?
Source: CryptoQuant · Published by CoinsProbe Markets Desk
The opinions and market insights shared on CoinsProbe represent the views of individual authors based on prevailing market conditions at the time of publication. Cryptocurrency investments carry significant risk and volatility. Readers are encouraged to conduct their own research and seek professional financial advice before making investment decisions. CoinsProbe and its contributors do not accept responsibility for financial losses or decisions made based on published content.
CoinsProbe may publish sponsored articles, affiliate links, or promotional collaborations. All sponsored material is clearly labeled to maintain transparency with our audience. Our editorial decisions remain fully independent, and advertising partnerships do not influence reviews, rankings, or published opinions.
Since 2023, CoinsProbe has delivered reliable insights on cryptocurrency, blockchain, and digital assets. Our content is created by experienced researchers and analysts who follow strict editorial standards focused on accuracy, transparency, and credibility. Every article is carefully reviewed and verified using trusted sources and current market data. We provide unbiased analysis and timely updates covering everything from emerging crypto projects to major industry developments.