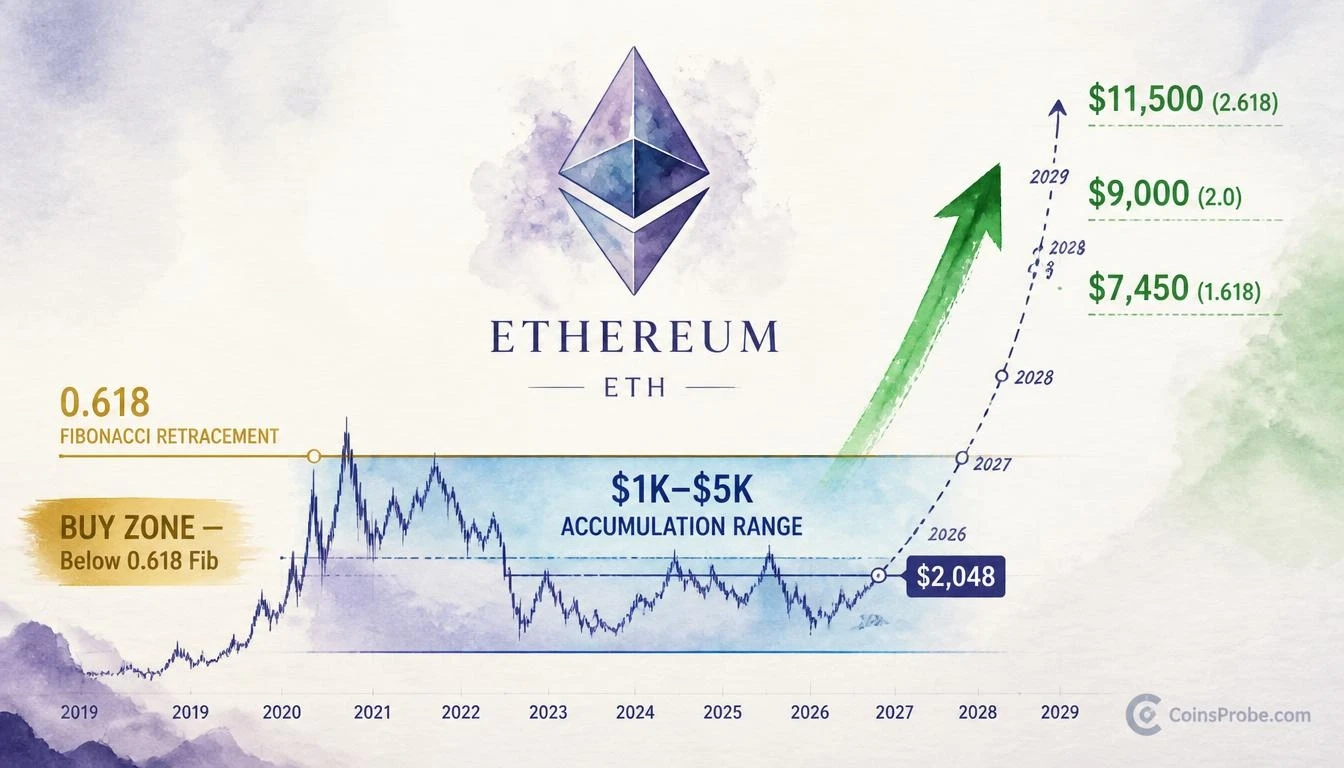
- ETH trades at $2,048.39 (-0.75% 24h), sitting below the 0.618 Fibonacci level within a multi-year $1K–$5K accumulation range
- One analyst calls buying below the 0.618 Fib 'simple and brilliant,' projecting range resolution to the upside in 2027–2029
- Fibonacci extension targets: 1.618 = $7,450, 2.0 = $9,000, 2.618 = $11,500 — implying +264% to +461% from current price
- Ethereum TVL stands at $40.93B with $78.88M in 7-day fees per DeFiLlama — network fundamentals remain intact
Ethereum is trading at $2,048.39 — down 0.75% over the past 24 hours, with a market cap of approximately $251.8 billion. At current prices, ETH sits squarely inside what one analyst argues is the most consequential accumulation range in Ethereum’s history: the multi-year $1,000–$5,000 band that has defined the asset’s macro structure for years. The setup, according to this analyst’s read, is not complicated — it is patient.
A crypto analyst posting under the handle @CryptoBullet1 made the case directly on November 11, 2026: “Scared to buy $ETH right now? Zoom out! See this multi-year accumulation range between $1–5k? That thing will be resolved to the upside in 2027–2029. Buying everything below the 0.618 Fib is simple and brilliant.” The framing is not short-term. It is a macro Fibonacci thesis built on a weekly chart spanning 2018 to a projected 2029 breakout.
The $1K–$5K Accumulation Range — What the Weekly Chart Shows
The weekly ETH/USDT chart on Binance, spanning 2018 through 2029, reveals a large multi-year horizontal range with clearly defined upper and lower boundaries. Current price at $2,052.92 as labeled on the chart sits below the 0.618 Fibonacci retracement level but above the 0.786 level and above the 1.0 base boundary — meaning ETH is positioned in the lower-middle portion of the accumulation band, not at its floor but well beneath the upper resistance zone.
The analyst’s thesis rests on a Fibonacci extension framework applied to this multi-year structure. The chart annotates the following extension targets beyond the range: 1.618 extension = $7,450, 2.0 extension = $9,000, and 2.618 extension = $11,500. A dashed curved projection on the chart traces a path of continued consolidation, a dip, recovery, and then a sharp parabolic rally extending toward these levels — with resolution timed between 2027 and 2029.
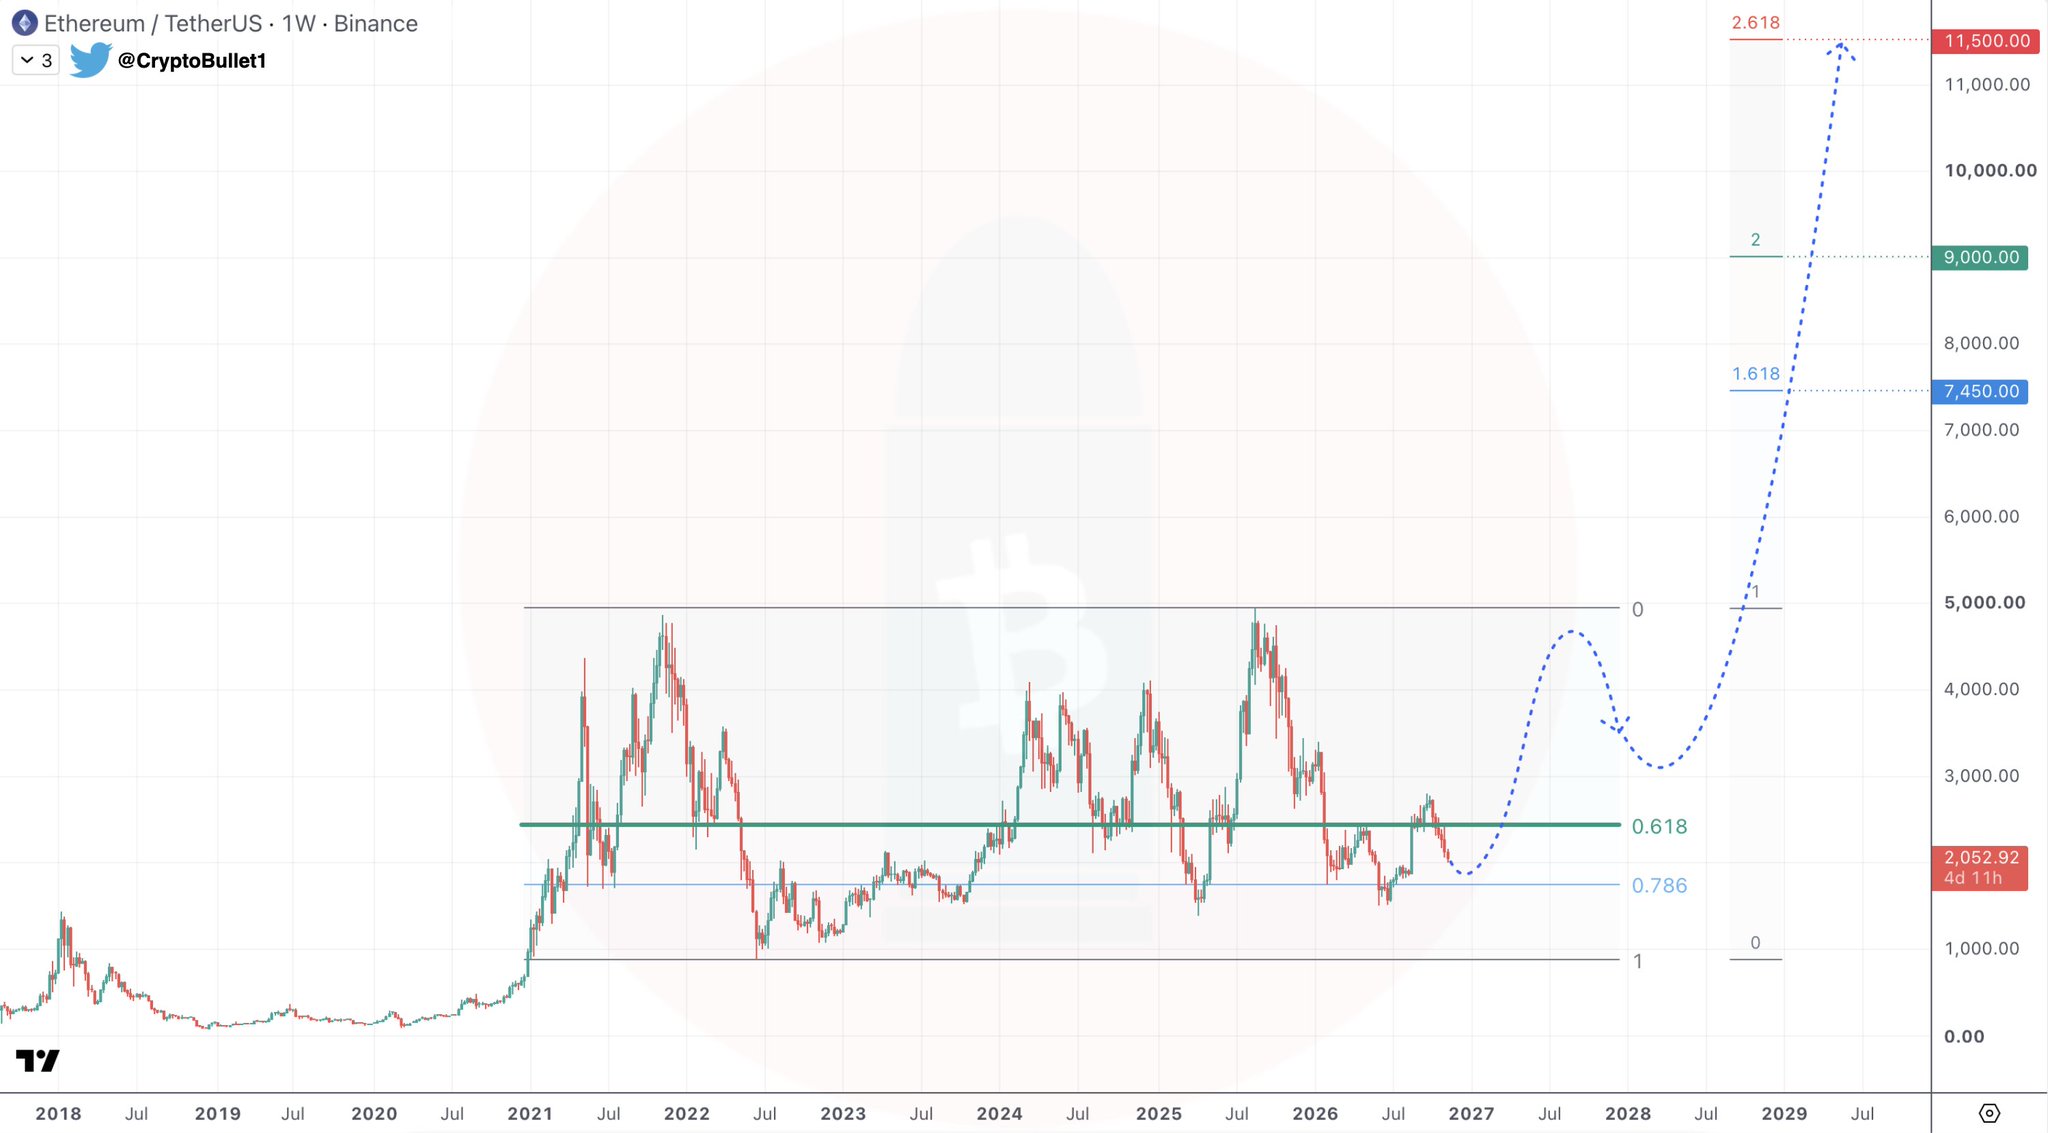
The 0.618 Fibonacci level functions here as a threshold, not a price target. Any price below it — currently occupied by ETH at $2,048 — represents the analyst’s defined high-value entry zone. The logic is structural: accumulating below the 0.618 retracement of a major cycle move has historically preceded the largest upside extensions in Fibonacci-based analysis. The analyst’s characterization — “simple and brilliant” — refers to the DCA strategy of buying in this zone without attempting to time the exact bottom.
The Fibonacci Framework — What Each Level Represents
Fibonacci retracement and extension levels are derived from the golden ratio and applied to price ranges to identify historically meaningful support and resistance zones. In this framework, the 0.618 level represents a deep retracement of a prior major move — it is the zone where long-term buyers have historically stepped in before the next expansion phase. Below 0.618 does not guarantee a floor; it marks a statistical value zone relative to the broader cycle structure.
The chart’s extension targets — $7,450, $9,000, and $11,500 — are not analyst price targets in the traditional sense. They are Fibonacci extension coordinates that the chart projects from the base of the accumulation range, should the range resolve to the upside as the analyst anticipates. The 1.618 extension at $7,450 is typically the first meaningful measured target. The 2.0 and 2.618 extensions at $9,000 and $11,500 represent progressively more ambitious scenario projections under a full parabolic expansion.
This matters for context. The $11,500 figure on the chart is not a forecast in isolation — it is the terminal Fibonacci coordinate under the most extended bullish resolution, flagged by the analyst as a 2027–2029 scenario. It should not be read as a 12-month price target.
On-Chain Fundamentals: What the Network Shows Today
The long-term Fibonacci thesis does not exist in a vacuum. Ethereum’s on-chain data provides a fundamental baseline against which to contextualize current price levels. Per DeFiLlama data, Ethereum’s network carries $40.93 billion in total value locked (TVL) as of the time of writing — the largest TVL base of any smart contract blockchain. The network generated $10.06 million in fees over the past 24 hours and $78.88 million over the past seven days, with daily DEX volume at $2.00 billion and weekly DEX volume at $12.69 billion. These figures confirm sustained network utilization even as price consolidates within the accumulation range.
ETH spot ETF data via SoSoValue shows a more cautious institutional picture in the near term. The latest trading date (November 10, 2026) recorded a daily net outflow of $1.3 million, with four consecutive outflow days in the most recent five-session window totaling $326 million in net outflows. Total ETF net assets stand at $11.64 billion. The outflow streak has not disrupted price meaningfully — ETH remains inside the accumulation range — but it reflects current institutional hesitation rather than conviction. This aligns with the broader narrative that the long-term thesis is macro in nature and not dependent on short-term ETF flow momentum. It is worth noting separately that recent analysis on CoinsProbe has tracked how BTC and ETH whales are selling even as other assets see accumulation — context that fits the current below-0.618 consolidation picture.
Macro Backdrop — FOMC and the Rate Outlook
Corrected version:
The 2027–2029 resolution timeline the analyst proposes carries an implicit macro assumption: that the interest rate environment either stabilizes or eases, removing a structural headwind for risk assets. Current market pricing shows a high probability (roughly 80–90%) of a 25bp rate hike at the December 9, 2026 FOMC meeting, which would move the federal funds rate from the current 3.75%–4.00% range to 4.00%–4.25%. The January 27, 2027 meeting presents more divided pricing. If further tightening materializes, it could extend the accumulation period but would not necessarily invalidate the broader macro Fibonacci thesis — it would simply delay the resolution further into the 2027–2029 window the analyst already outlined.
Upcoming macro events — including PPI on November 13, Retail Sales on November 17, and Core PCE and GDP on November 25 — could introduce near-term volatility within the range. These are data points, not thesis-changers for a multi-year accumulation argument. The analyst’s post published previously on CoinsProbe also identified the 0.618 Fib zone as a spot buying opportunity — that thesis remains consistent with the current analysis. See: ETH Hits the 0.618 Fib — An Analyst Calls It a Spot Buying Opportunity.
What the Setup Requires — and What It Doesn’t Say
The analyst’s thesis is structurally long-term. It does not provide a short-term bottom call, a stop-loss level, or a date by which ETH must move. The 0.618 Fibonacci level functions as a zone definition — everything below it is the analyst’s designated accumulation window. What the thesis requires is patience: ETH resolving its multi-year $1K–$5K range to the upside at some point between 2027 and 2029, reaching at minimum the 1.618 extension at $7,450 before potentially pushing toward $9,000 and $11,500 under a full extension scenario.
What it does not say: it does not confirm that $2,048 is the absolute bottom. ETH could continue to consolidate anywhere within the $1K–$5K band — including testing levels closer to the $1,000 lower boundary — without breaking the accumulation thesis. The analyst’s entry strategy of buying everything below the 0.618 is explicitly a DCA approach, acknowledging the possibility of further downside within the range while still treating current prices as structurally favorable for the 2027–2029 resolution.
The scale of the implied move from current price to the first Fibonacci extension target is significant: from $2,048 to $7,450 represents approximately +264%. To the 2.0 extension at $9,000, the implied move is approximately +339%. To the 2.618 extension at $11,500, it reaches approximately +461%. These are not 12-month figures — they are multi-year macro projections under a full Fibonacci expansion scenario running into 2029.
ETH’s on-chain network remains substantive at $40.93 billion TVL, $10.06 million in daily fees, and $12.69 billion in weekly DEX volume — data via DeFiLlama. The current price below the 0.618 Fibonacci retracement, combined with intact network fundamentals, is what the analyst identifies as the opportunity. Watch the $5,000 upper boundary of the multi-year accumulation range as the first structural confirmation that the resolution phase the analyst projects has begun. Loss of the $1,000 lower boundary would be the structural invalidation of the entire accumulation thesis.
Frequently Asked Questions
What is the 0.618 Fibonacci level for ETH and where does it sit currently?
What are the Fibonacci extension price targets for ETH between 2027 and 2029?
What would invalidate the multi-year ETH accumulation thesis?
Does the near-term ETF outflow data conflict with the long-term Fibonacci bullish case?
Source: Cryptobullet1 · Published by CoinsProbe Markets Desk
The opinions and market insights shared on CoinsProbe represent the views of individual authors based on prevailing market conditions at the time of publication. Cryptocurrency investments carry significant risk and volatility. Readers are encouraged to conduct their own research and seek professional financial advice before making investment decisions. CoinsProbe and its contributors do not accept responsibility for financial losses or decisions made based on published content.
CoinsProbe may publish sponsored articles, affiliate links, or promotional collaborations. All sponsored material is clearly labeled to maintain transparency with our audience. Our editorial decisions remain fully independent, and advertising partnerships do not influence reviews, rankings, or published opinions.
Since 2023, CoinsProbe has delivered reliable insights on cryptocurrency, blockchain, and digital assets. Our content is created by experienced researchers and analysts who follow strict editorial standards focused on accuracy, transparency, and credibility. Every article is carefully reviewed and verified using trusted sources and current market data. We provide unbiased analysis and timely updates covering everything from emerging crypto projects to major industry developments.