
- Bitcoin trades at $74,198 (-0.26% 24h) as USDT supply records its deepest 60-day contraction since tracking began
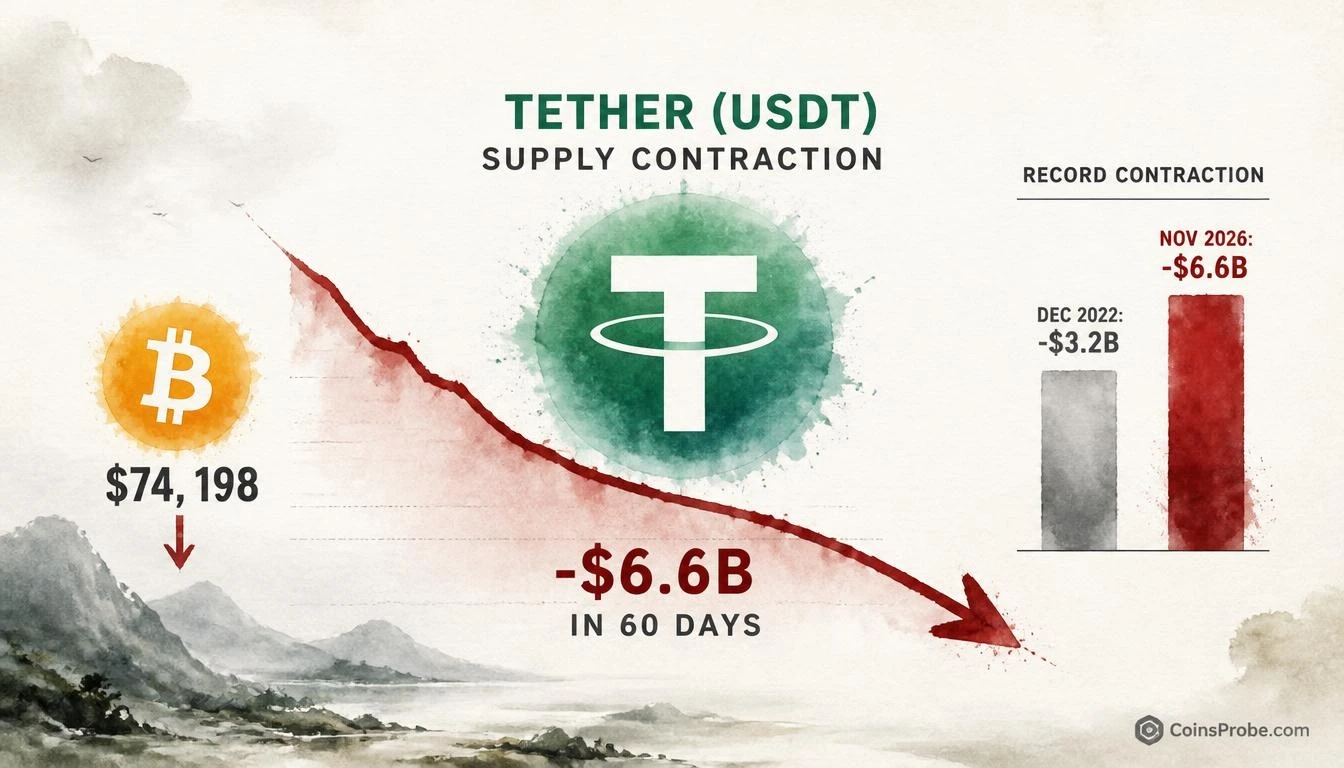
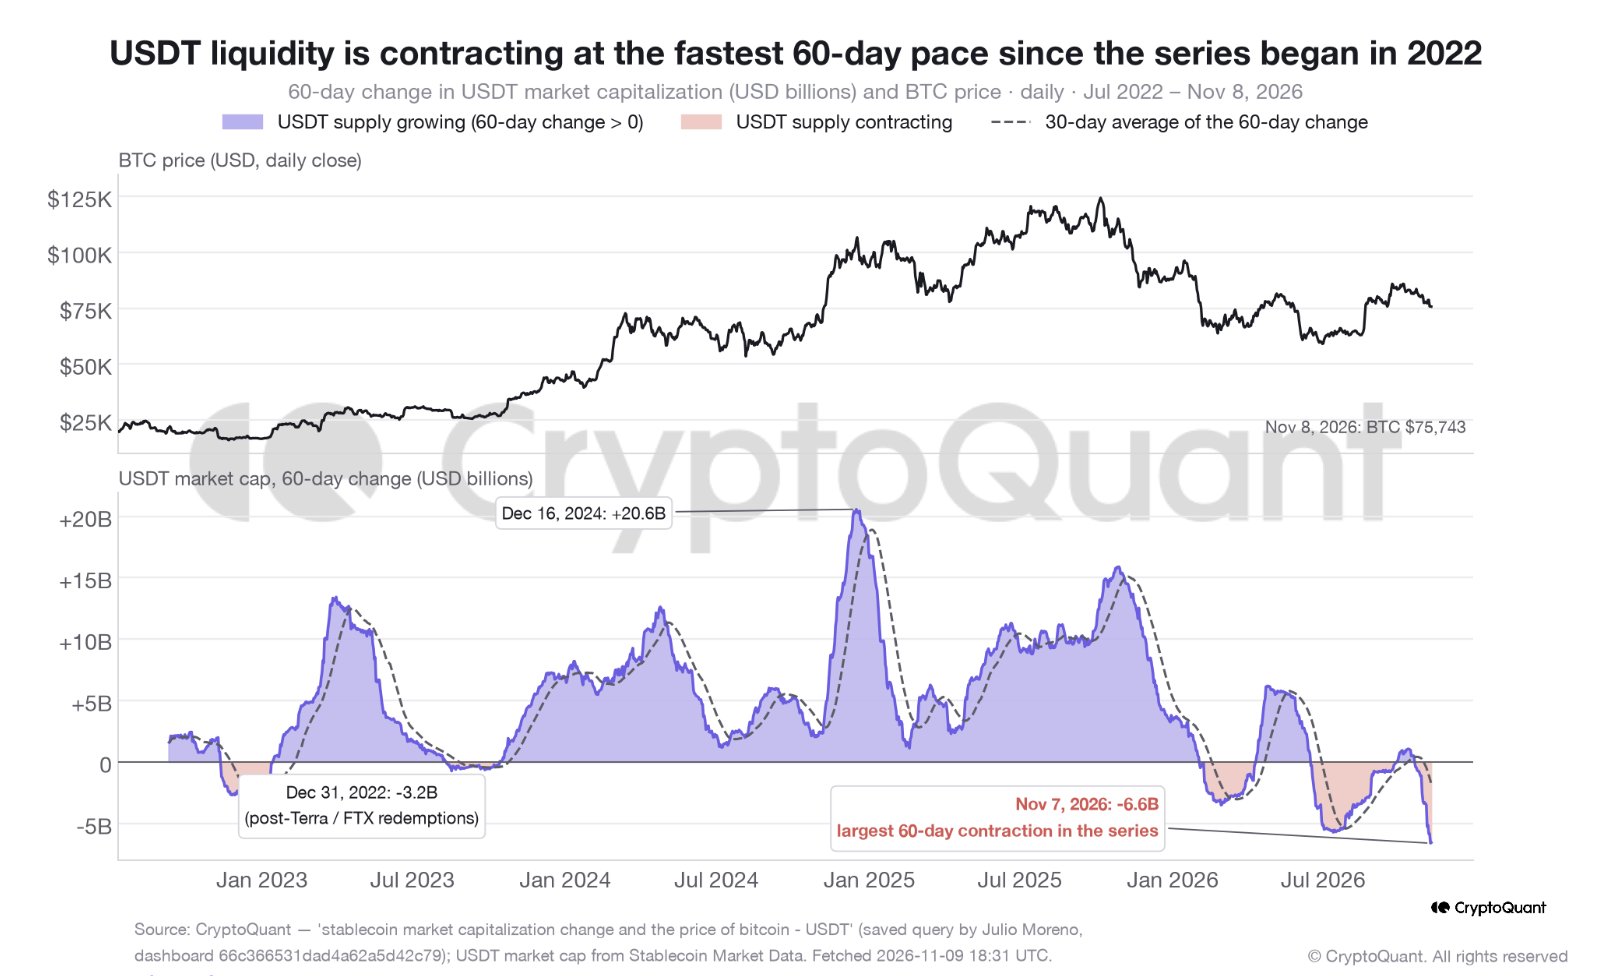
- USDT market cap fell $6.6B in 60 days — more than double the $3.2B post-FTX drop of December 2022, per CryptoQuant
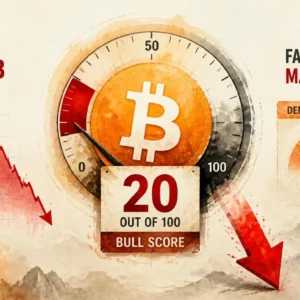
- CryptoQuant Bull Score reads 20 as demand contracts at its fastest pace since March 2025
- Watch the USDT 60-day change metric: a reversal toward zero is the first on-chain requirement for a Bitcoin recovery
Bitcoin is trading at $74,198 — down 0.26% in the past 24 hours and sitting below the prior cycle highs visible on the weekly chart — as a critical structural warning emerges from on-chain data. The stablecoin liquidity that powered every major rally this cycle is now contracting at a pace that has never been recorded before. This is not a sentiment observation. It is a measurable, quantified withdrawal of the raw fuel that moves crypto markets.
CryptoQuant’s official account flagged the development on November 10, 2026, with a direct declaration: USDT market capitalization has fallen by $6.6 billion in 60 days — more than double the $3.2 billion contraction recorded in December 2022, the period immediately following the FTX collapse. In their own words: “Stablecoin growth funded every rally this cycle. That fuel is draining.” The platform’s linked report, titled “Razor’s Edge: Local Bottom or Deeper Correction?”, frames the current moment as a binary inflection point for Bitcoin price structure.
The $6.6B Contraction — What It Means and Why It Matters
USDT market capitalization is a direct proxy for stablecoin liquidity available to deploy into crypto markets. When Tether supply grows, it signals fresh capital entering the ecosystem — buyers minting USDT to purchase assets. When it shrinks, the reverse is true: capital is exiting, stablecoins are being redeemed, and the pool of dry powder available to bid on Bitcoin and altcoins is actively shrinking.
The 60-day change metric shown in CryptoQuant’s chart tracks this expansion and contraction in rolling windows. The data reveals a clear pattern across this cycle: every significant Bitcoin rally was preceded or accompanied by a mountain-shaped surge in USDT 60-day supply growth — the December 2024 peak reached +$20.6 billion over 60 days, the high-water mark of the entire cycle. The current reading is -$6.6 billion. That is not a slowdown in growth. That is active, accelerating contraction — the deepest and most sustained trough in the entire series since July 2022.
| Period | USDT 60-Day Change | Context |
|---|---|---|
| December 2022 | -$3.2B | Post-FTX collapse |
| December 2024 | +$20.6B | Cycle peak — maximum liquidity |
| November 8, 2026 | -$6.6B | Deepest contraction on record |
Source: CryptoQuant (@cryptoquant_com, X)
The post-FTX comparison is not arbitrary. December 2022 was a period of maximum fear and capital flight — the worst crypto credit event in history had just occurred weeks earlier. The current contraction is more than double that in absolute dollar terms, occurring in the absence of any comparable external shock. That divergence — deeper contraction, no obvious catastrophic trigger — is what makes this reading structurally significant.
Bull Score at 20 — Demand Contracting at Fastest Pace Since March 2025
The USDT supply data does not stand alone. CryptoQuant’s composite Bull Score — an aggregated index of on-chain conditions across multiple signals — currently reads 20. This is a low reading that corroborates the stablecoin contraction: demand is not just slowing, it is contracting at the fastest pace recorded since March 2025, per CryptoQuant’s own framing in the research note.
The Bull Score aggregates independent on-chain signals into a single 0–100 composite reading. A score of 20 indicates that the preponderance of on-chain conditions are aligned bearish or neutral — not a single contrarian data point but a broad-based deterioration across the signals CryptoQuant monitors. When the Bull Score sat near similar lows historically, it marked either cycle bottoms (where accumulation quietly begins) or the beginning of extended corrections. CryptoQuant’s framing — “Razor’s Edge” — reflects precisely this ambiguity: the current data is consistent with both outcomes, and the direction depends on what happens next with demand and liquidity flows.
It is worth noting that Bitcoin’s reserves and overall market structure have been subject to significant scrutiny in this period. For context on exchange-level liquidity and what reserve data actually represents, see our earlier analysis: Binance $151.5B Reserves vs. $6.3B Hack — What the Numbers Actually Show.
Why Stablecoin Liquidity Is the Mechanism — Not a Symptom
The causal chain here is direct and mechanical. Bitcoin does not rally on sentiment alone — it rallies when buyers with capital step in. That capital, in modern crypto market structure, is predominantly denominated in stablecoins. USDT is the dominant on-chain trading pair across centralized and decentralized venues. When USDT supply grows, it means new money has entered the system and is available to purchase BTC, ETH, and altcoins. When it contracts, that purchasing power is leaving — not rotating within crypto, but exiting to fiat.
CryptoQuant’s historical chart makes this loop explicit: every purple mountain in the USDT 60-day change metric corresponds to a Bitcoin price advance. The correlation across the full July 2022–November 2026 window is not coincidental — it is the liquidity transmission mechanism in action. The current red trough, the deepest in the dataset, means the mechanism is running in reverse.
Tether’s role in global crypto market structure has drawn regulatory attention at the highest levels. The US Senate has separately flagged USDT’s use in sanctions evasion, adding a layer of geopolitical risk to the stablecoin’s supply dynamics that did not exist in prior cycles.
Local Bottom or Deeper Correction — The Two Scenarios CryptoQuant Is Watching
CryptoQuant’s linked report explicitly names this as a “Razor’s Edge” moment — a phrase that acknowledges the data is compatible with two divergent outcomes. The on-chain conditions do not yet confirm which path Bitcoin takes from here.
Scenario A — Local Bottom
If USDT supply contraction stabilizes and begins reversing — fresh stablecoin minting resumes, the 60-day change curve turns back toward zero and positive — the current drawdown would read as a demand trough within a larger cycle, not a cycle-ending event. Bitcoin at $74,198 would then represent a compressed entry zone ahead of renewed liquidity inflow. The Bull Score recovering from 20 toward 40–50 would be the first on-chain confirmation of this path.
Scenario B — Deeper Correction
If the USDT contraction accelerates further — the 60-day change moves deeper negative from -$6.6B — the liquidity withdrawal would reach a scale with no modern precedent in this asset class. Bitcoin’s current price position, already below prior cycle highs, would face continued selling pressure with diminishing stablecoin bids available to absorb it. CryptoQuant’s note references “levels that decide local bottom vs. deeper correction” without specifying exact prices — no specific Bitcoin price targets are stated in the available data.
The resolution of this question is not a matter of chart reading. It is a matter of watching Tether’s on-chain supply in real time. CryptoQuant’s data updates continuously — the 60-day USDT change metric is the single most important number to track in the near term.
The current moment mirrors in structure — if not yet in scale — the dynamics that surrounded the Binance security event earlier this cycle. For historical context on how exchange-level stress propagates through on-chain data, see: Binance $6.3B Hack: SAFU Covers Losses, Withdrawals Expected in 48 Hours.
CryptoQuant’s data has delivered a precise, quantified warning: stablecoin liquidity — the mechanism that funded every rally this cycle — is contracting at a pace that exceeds the worst post-FTX drawdown. The USDT 60-day change stands at -$6.6B against a prior cycle peak of +$20.6B. The Bull Score reads 20. Demand is contracting at its fastest pace since March 2025. Bitcoin at $74,198 sits below its prior cycle highs. None of these readings are bullish in isolation — but each one is also compatible with a bottoming process. The data does not yet confirm direction. Watch the USDT 60-day supply change as the primary leading indicator: a turn back toward zero is the first requirement for any sustained Bitcoin recovery thesis.
Source: x.comFrequently Asked Questions
Why does USDT supply contraction affect Bitcoin’s price?
How does the current USDT drop compare to the post-FTX crash?
What is CryptoQuant’s Bull Score and what does a reading of 20 mean?
What on-chain metric should traders watch to determine if Bitcoin has bottomed?
Source: CryptoQuant · Published by CoinsProbe Markets Desk
The opinions and market insights shared on CoinsProbe represent the views of individual authors based on prevailing market conditions at the time of publication. Cryptocurrency investments carry significant risk and volatility. Readers are encouraged to conduct their own research and seek professional financial advice before making investment decisions. CoinsProbe and its contributors do not accept responsibility for financial losses or decisions made based on published content.
CoinsProbe may publish sponsored articles, affiliate links, or promotional collaborations. All sponsored material is clearly labeled to maintain transparency with our audience. Our editorial decisions remain fully independent, and advertising partnerships do not influence reviews, rankings, or published opinions.
Since 2023, CoinsProbe has delivered reliable insights on cryptocurrency, blockchain, and digital assets. Our content is created by experienced researchers and analysts who follow strict editorial standards focused on accuracy, transparency, and credibility. Every article is carefully reviewed and verified using trusted sources and current market data. We provide unbiased analysis and timely updates covering everything from emerging crypto projects to major industry developments.