
- Bitcoin's CryptoQuant Bull Score has collapsed to 20 — lower quintile of its 0–100 composite range
- Demand is contracting at its fastest pace since March 2025, per CryptoQuant's November 10, 2026 report
- USDT market cap dropped $6.6B in 60 days — faster than post-FTX December 2022 contraction
- CryptoQuant frames current levels as a decision point: local bottom or deeper correction
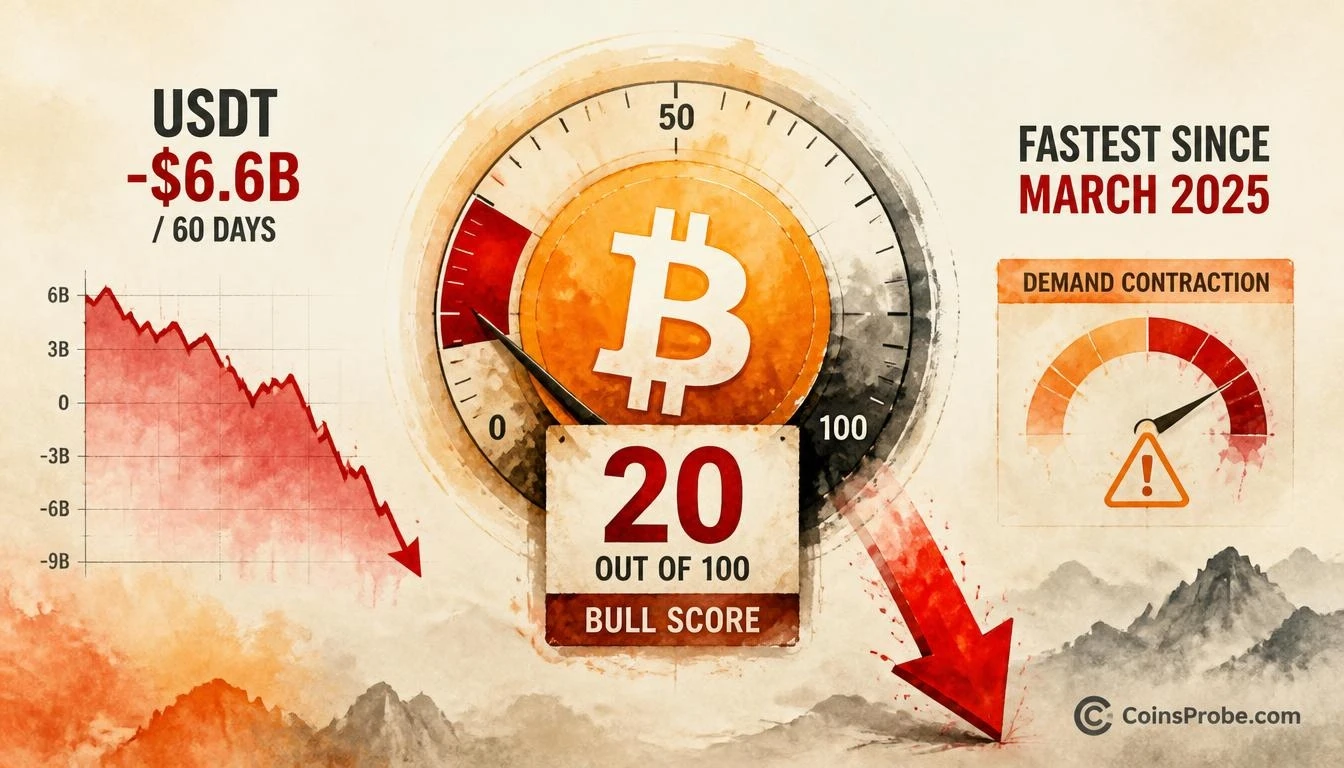
Bitcoin’s on-chain picture has deteriorated sharply. CryptoQuant’s composite Bull Score has fallen to 20 — a reading that places Bitcoin firmly in bearish territory — while demand is contracting at the fastest pace recorded since March 2025. The combination of a collapsed Bull Score and accelerating demand drain is not a subtle warning. It is a quantified signal that the market’s internal structure has weakened materially.
The alert comes directly from CryptoQuant, the on-chain analytics platform, which flagged on November 10, 2026 that the Bull Score now reads 20 and that demand contraction has reached its steepest rate since March 2025. A companion observation from the same thread adds crucial context: USDT market cap has declined by $6.6 billion over the past 60 days — a pace of stablecoin contraction that is faster than the post-FTX collapse period of December 2022. Because stablecoin growth was the primary fuel for Bitcoin’s prior rally, that fuel is now actively draining.
Signal 1 — The Bull Score at 20: What It Measures and Why It Matters
The Bull Score is not a single metric. It is a composite indicator that aggregates ten independent on-chain signals into a single 0–100 reading. Each component addresses a different dimension of market health: miner behavior, exchange flows, holder activity, demand-side metrics, and liquidity conditions. A reading near 100 indicates broad, multi-signal confirmation of a bull market. A reading near 0 indicates the opposite — broad deterioration across nearly every on-chain dimension simultaneously.
At 20, the Bull Score is not in a neutral zone. It is in the lower quintile of its entire range. CryptoQuant has previously documented that sustained Bull Score readings below 20 have historically corresponded with periods of prolonged price compression or deeper corrections, while recoveries back above 50 have preceded meaningful rallies. The current reading of 20 means that the overwhelming weight of on-chain evidence is bearish — not one or two signals, but the composite of ten.
It is also worth noting what the Bull Score does not tell you: it is not a directional price predictor in the short term, and it does not specify how far a correction extends. What it confirms is the structural condition of the market at this moment. That condition is weak.
Signal 2 — Demand Contracting at Its Fastest Pace Since March 2025
The demand signal is arguably the more urgent of the two. CryptoQuant’s data shows that Bitcoin demand is contracting faster now than at any point since March 2025. That reference point is significant: March 2025 was the period that preceded a notable period of price weakness as the cycle’s momentum began to stall. The current contraction rate matching or exceeding that level means the demand-side foundation beneath Bitcoin’s price has eroded at a historically notable speed.
The stablecoin data amplifies this picture. The $6.6 billion decline in USDT market cap over 60 days is a supply-side proxy for buying power. When stablecoin market caps expand, it typically signals capital staging on the sidelines, ready to rotate into crypto assets. When stablecoin market caps contract at this pace — faster than even the post-FTX period in December 2022 — it signals the opposite: capital is exiting the ecosystem, not waiting to deploy. The implication for Bitcoin is direct: if the pool of potential buyers is shrinking faster than it did during one of crypto’s most acute crisis periods, the demand base supporting current price levels is structurally thinner than it appears on the surface.
Readers tracking Ethereum’s on-chain dynamics can find a parallel supply-side signal in our earlier report on the ETH staking rate hitting 36.32% as price falls — another instance where on-chain data pointed to structural pressure before it was visible in the price chart.
The USDT Contraction — Faster Than Post-FTX December 2022
To appreciate the severity of the stablecoin signal, the comparison point matters. December 2022 was the month following the FTX collapse — the most acute liquidity crisis in this crypto cycle’s history. The fact that USDT market cap is now contracting faster over a 60-day window than it did in that crisis period is not a minor footnote. It is a data point that reframes the narrative around current price levels.
Price charts can sustain the appearance of stability while underlying liquidity quietly drains. The STH-SOPR signal we tracked earlier — documented in our coverage of Bitcoin’s STH-SOPR falling below 1.0 — showed that short-term holders were already realizing losses even as prices appeared range-bound. The stablecoin contraction data now adds a demand-side confirmation to what that supply-side signal had already flagged.
Local Bottom or Deeper Correction — What the Data Requires
CryptoQuant frames this as a decision point: either current levels represent a local bottom, or the data is consistent with a deeper correction unfolding. That framing is analytically honest. The Bull Score at 20 and demand contraction at a March 2025 pace do not automatically resolve into a single outcome — they define the risk envelope. The question is whether demand stabilizes at current levels or continues to drain.
The specific levels that determine which path Bitcoin takes were detailed in CryptoQuant’s full published report, linked in their November 10 post. What the publicly available signal confirms is that the analytical team is watching specific price zones for evidence of either stabilization or failure — and that the current on-chain conditions do not support high-confidence bullish positioning without that confirmation arriving first.
For context on what a structural recovery signal looks like, Ethereum’s setup — where a bull flag was forming with $2,700 as the breakout trigger — represents the type of price-level confirmation that on-chain data like the Bull Score would need to corroborate before a bearish reading can be dismissed.
What the Bull Score at 20 Says — and What It Doesn’t
What it says: Ten independent on-chain signals, aggregated into a composite 0–100 framework, are collectively indicating bearish market conditions. Demand is contracting faster than at any point in the past eight months. Stablecoin liquidity — the ecosystem’s buying power reservoir — is draining at a pace that exceeds the post-FTX crisis period.
What it doesn’t say: The Bull Score at 20 does not specify a price target for the correction, a date of recovery, or a guaranteed outcome. It is a structural reading, not a directional price call with a defined magnitude.
What to watch for stabilization: A Bull Score recovery back toward 40–50 would indicate that multiple on-chain signals are beginning to flip. Stabilization in the USDT market cap — or a return to growth — would signal that buying power is re-entering the ecosystem. These are the two data points that would begin to challenge the current bearish composite reading.
Frequently Asked Questions
What is CryptoQuant’s Bull Score and what does a reading of 20 mean?
Why is the USDT market cap decline significant for Bitcoin?
What is the difference between a local bottom and a deeper correction in this CryptoQuant framework?
What would need to happen for the Bull Score to recover from 20?
Source: CryptoQuant · Published by CoinsProbe Markets Desk
The opinions and market insights shared on CoinsProbe represent the views of individual authors based on prevailing market conditions at the time of publication. Cryptocurrency investments carry significant risk and volatility. Readers are encouraged to conduct their own research and seek professional financial advice before making investment decisions. CoinsProbe and its contributors do not accept responsibility for financial losses or decisions made based on published content.
CoinsProbe may publish sponsored articles, affiliate links, or promotional collaborations. All sponsored material is clearly labeled to maintain transparency with our audience. Our editorial decisions remain fully independent, and advertising partnerships do not influence reviews, rankings, or published opinions.
Since 2023, CoinsProbe has delivered reliable insights on cryptocurrency, blockchain, and digital assets. Our content is created by experienced researchers and analysts who follow strict editorial standards focused on accuracy, transparency, and credibility. Every article is carefully reviewed and verified using trusted sources and current market data. We provide unbiased analysis and timely updates covering everything from emerging crypto projects to major industry developments.