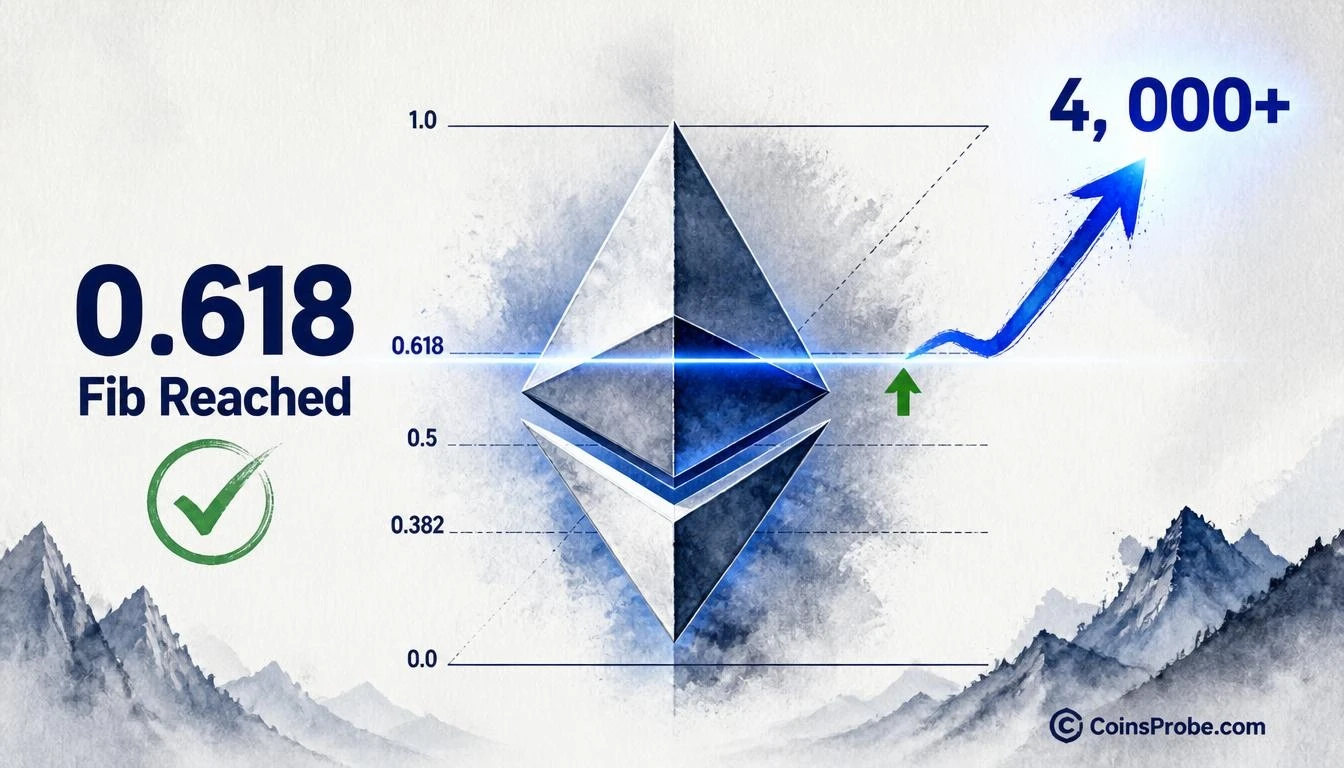
- ETH is trading at $2,062 — down 2.72% — after reaching the 0.618 Fibonacci retracement on the weekly chart
- An analyst calls the $2,000–$2,300 zone a spot buying opportunity, citing the 0.618 Fib touch as the specific trigger
- ETH spot ETFs saw $184.5M in daily net outflows on Nov 9, with 3 consecutive outflow days totaling $324.6M per SoSoValue
- Watch $2,000 — a sustained weekly close below invalidates the corrective-retracement thesis
Ethereum is trading at approximately $2,062 — down 2.72% in the past 24 hours — with a market cap of $252 billion. The asset has reached a level that one analyst has been publicly tracking for weeks: the 0.618 Fibonacci retracement on the weekly chart, a zone where corrective moves in prior cycles have historically exhausted themselves before reversing.
An analyst identifying themselves as CryptoBullet1 on X posted on November 10, 2026, citing that exact arrival: “$ETH has reached the 0.618 Fib level — Regardless of where it goes next, not buying some spot $ETH here is a mistake.” The call is explicit and unconditional — not tied to a macro confirmation, not hedged against short-term volatility. The analyst’s thesis, now playing out in real time, was first framed in a quoted post from October 19, 2026, when ETH lost its 200-Week Moving Average — an event the analyst described as confirming a mid-term correction and opening the Buy The Dip Zone between $2,000 and $2,300.
The Setup — 200-Week MA Loss Led Directly to This Zone
The sequence matters. When Ethereum lost the 200-Week MA in October 2026, the analyst did not call an emergency or project further collapse. Instead, they mapped a logical destination: a corrective wave structure descending into the $2,000–$2,300 zone — anchored by the 0.618 Fibonacci retracement of the broader bull move. That zone is now active. ETH at $2,062 sits inside the lower half of that range. The October post established the roadmap; the November post confirmed the destination was reached. We covered the initial setup when the 200-Week MA broke — see ETH Enters ‘Buy The Dip’ Zone — $2,000–$2,300 After 200-Week MA Break.
Signal — The 0.618 Fibonacci Level on the Weekly Chart
The 0.618 Fibonacci retracement is widely considered the deepest retracement level a healthy trend can absorb before the prior trend resumes. It sits at the boundary between corrective pullback and structural trend reversal. On the weekly ETH/USDT chart, the analyst has overlaid an Elliott Wave corrective structure — labeled (1) through (5) — within a descending channel, with the Fibonacci retracement grid anchoring the analytical framework. Price has arrived at the 0.618 level, tagged in the chart as $2,027.64, while the live market price at time of writing is $2,062.12. The chart annotation and the live price are distinct: the labeled Fib touch point reflects the chart’s specific reading; the live price reflects the ongoing session.
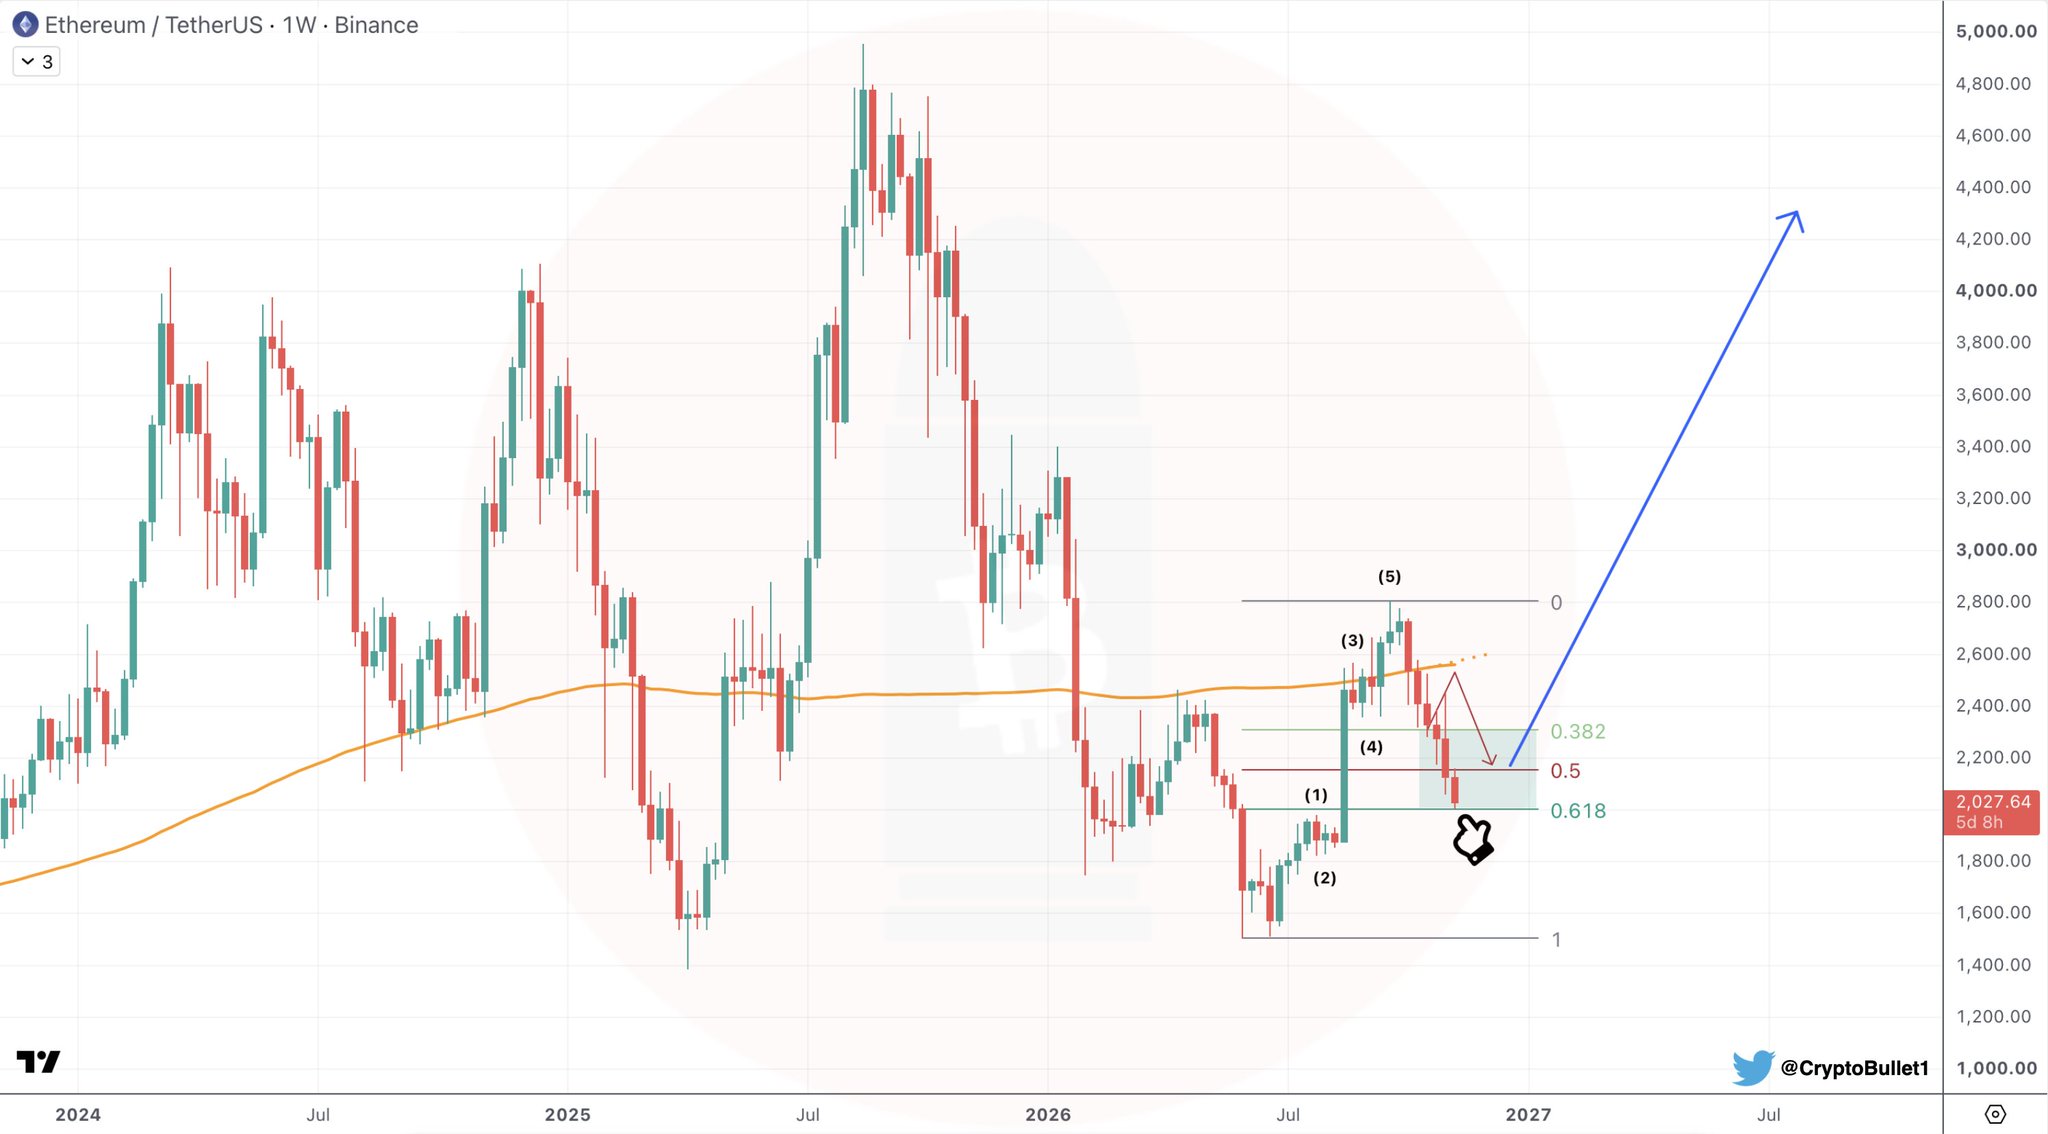
The analyst’s forward projection — illustrated by a blue arrow on the weekly chart — targets a sharp reversal toward the 4,000+ range from this zone. No intermediate targets or precise upside price labels are explicitly stated beyond the 4,000+ direction in the chart projection. The Fibonacci grid uses the standard 0, 0.382, 0.5, 0.618, and 1 levels, with 0.618 representing the current touch point.
ETH Spot ETF Flows — Institutional Pressure Remains
The technical signal arrives amid continued institutional selling through ETH spot ETFs. Data via SoSoValue shows a daily net outflow of $184.5 million on the latest trading date (November 9, 2026), with three consecutive outflow days totaling $324.6 million over the past four sessions. ETHA led redemptions with $119.3 million in outflows on the latest day, while FETH and ETHE recorded zero movement. Total ETF net assets stand at $12.07 billion against a cumulative net inflow since launch of $11.74 billion — meaning the ETF wrapper remains net positive since inception, but recent weeks have seen sustained selling pressure.
The divergence is analytically significant: the 0.618 Fibonacci level is being tested precisely as ETF outflows are sustained. If the analyst’s thesis is correct, the Fibonacci zone absorbs the institutional selling and sets the floor. If outflows accelerate, the $2,000 lower boundary of the buy zone becomes the next reference.
On-Chain Fundamentals — Ethereum’s Network Activity
DeFiLlama data shows Ethereum’s TVL at $40.82 billion, with 24-hour DEX volume at $2.00 billion and 7-day DEX volume at $12.67 billion. The network generated $9.75 million in fees over the past 24 hours and $78.21 million over the past seven days. These are not distressed network metrics — Ethereum’s on-chain economy remains active even as the spot price corrects into the Fibonacci zone. Activity of this scale does not automatically produce price appreciation, but it confirms the network is not in structural decline concurrent with the price drawdown.
Macro Backdrop — FOMC and Upcoming Data
Markets are pricing a high probability (roughly 80–90%) of a 25bp rate hike at the December 9 FOMC meeting, which would move the federal funds rate from the current 3.75%–4.00% range to 4.00%–4.25%. The January 27, 2027 meeting shows more divided pricing. Upcoming releases include PPI on November 13, Retail Sales on November 17, and Core PCE alongside GDP on November 25 — a schedule that carries rate-sensitive macro risk. A hot inflation print would reinforce the case for further tightening and add headwind to risk assets, including ETH.
The Analyst’s Call — Context and What It Does Not Say
The statement — “not buying some spot $ETH here is a mistake” — is directionally unambiguous. It is a spot accumulation call at a specific Fibonacci level, not a leveraged trade setup. The analyst explicitly decouples the call from short-term price direction: “regardless of where it goes next.” This framing is deliberate — it acknowledges that ETH may not immediately reverse from the 0.618 level, and that the value case is structural, not momentum-driven. The analyst does not state a stop-loss or invalidation level in this post. The lower boundary of the previously established buy zone — $2,000 — is the natural structural reference for position management, though the analyst does not explicitly frame it as such in the November 10 post. For context on where ETH rebounded targets were mapped earlier this cycle, see BTC, ETH, XRP Rebound Targets: $86,500, $2,700, and $1.55 in Focus.
The 0.618 Fib touch at approximately $2,027–$2,062 is now a matter of record. Whether ETH bounces from here, consolidates within the $2,000–$2,300 zone, or breaks below $2,000 to invalidate the corrective structure — those are the three scenarios the market will resolve in sessions ahead. The analyst has stated their position clearly: the Fibonacci level is the opportunity, not a warning.
At $2,062, ETH is trading inside the buy zone the analyst mapped three weeks before price arrived there. Watch $2,000 as the structural floor — a sustained weekly close below that level would challenge the corrective-retracement thesis and open the possibility that the decline extends beyond the mapped zone.
Frequently Asked Questions
What does the 0.618 Fibonacci level mean for Ethereum right now?
What is the invalidation level for this ETH buy thesis?
Are ETH spot ETF outflows a bearish signal for this Fibonacci setup?
Does Ethereum’s on-chain activity support a recovery from this level?
Source: Cryptobullet1 · Published by CoinsProbe Markets Desk
The opinions and market insights shared on CoinsProbe represent the views of individual authors based on prevailing market conditions at the time of publication. Cryptocurrency investments carry significant risk and volatility. Readers are encouraged to conduct their own research and seek professional financial advice before making investment decisions. CoinsProbe and its contributors do not accept responsibility for financial losses or decisions made based on published content.
CoinsProbe may publish sponsored articles, affiliate links, or promotional collaborations. All sponsored material is clearly labeled to maintain transparency with our audience. Our editorial decisions remain fully independent, and advertising partnerships do not influence reviews, rankings, or published opinions.
Since 2023, CoinsProbe has delivered reliable insights on cryptocurrency, blockchain, and digital assets. Our content is created by experienced researchers and analysts who follow strict editorial standards focused on accuracy, transparency, and credibility. Every article is carefully reviewed and verified using trusted sources and current market data. We provide unbiased analysis and timely updates covering everything from emerging crypto projects to major industry developments.