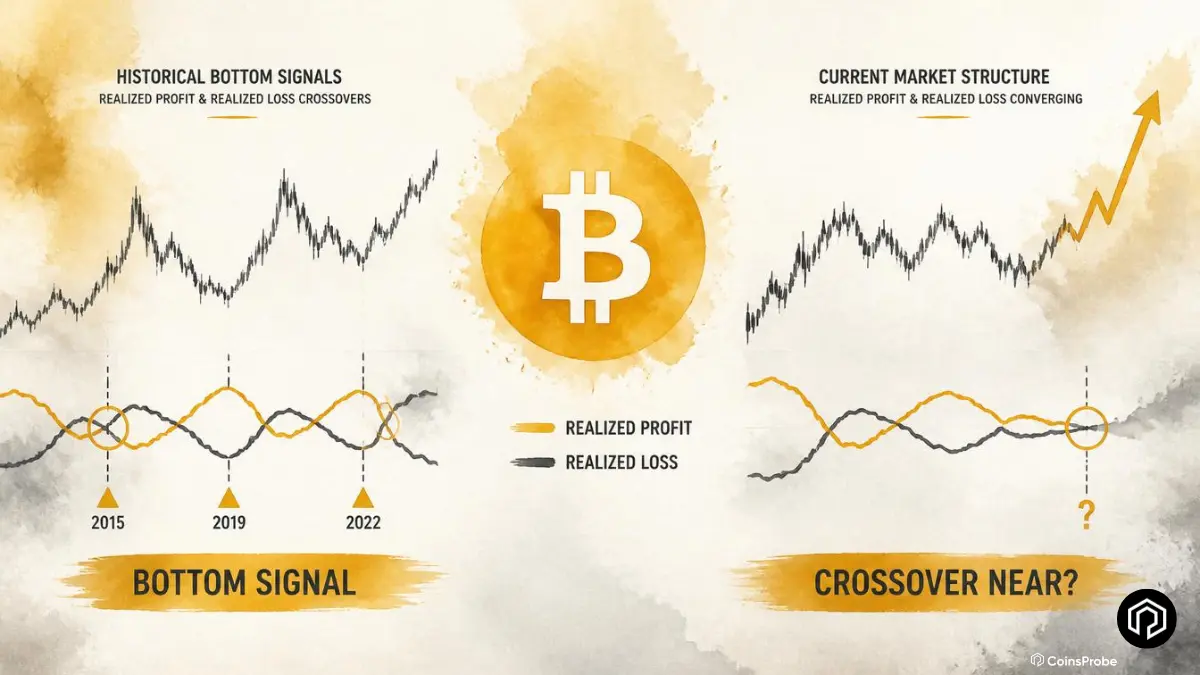

- Bitcoin trades near $64,311, up 9.6% over the past month despite remaining down YTD.
- Alphractal says the Realized Profit vs. Realized Loss crossover is approaching—a signal that has historically marked major BTC bottoms.
- The two metrics are rapidly converging, suggesting a potential cycle bottom may be near.
- Previous crossovers have been followed by strong Bitcoin recoveries, making this a key on-chain indicator to watch.
Bitcoin’s on-chain data is producing one of the most historically significant signals of the current cycle — a signal that has called every major cycle bottom in Bitcoin’s history with remarkable precision. Understanding what it measures, what it has produced before, and how close it currently is to triggering provides crucial context for interpreting the current price action.
Bitcoin is trading at approximately $64,311 — up +9.60% over 30 days and with a market cap of approximately $1.29 trillion. Despite the recent recovery from lows near $62,000 — supported by the cooler CPI data showing 3.5% annual rate vs 3.8% expected and a -0.4% month-over-month decline (the largest since April 2020) — Bitcoin remains -26.51% year-to-date from its $126,000 all-time high.

The Signal — Realized Profit vs. Realized Loss Crossover
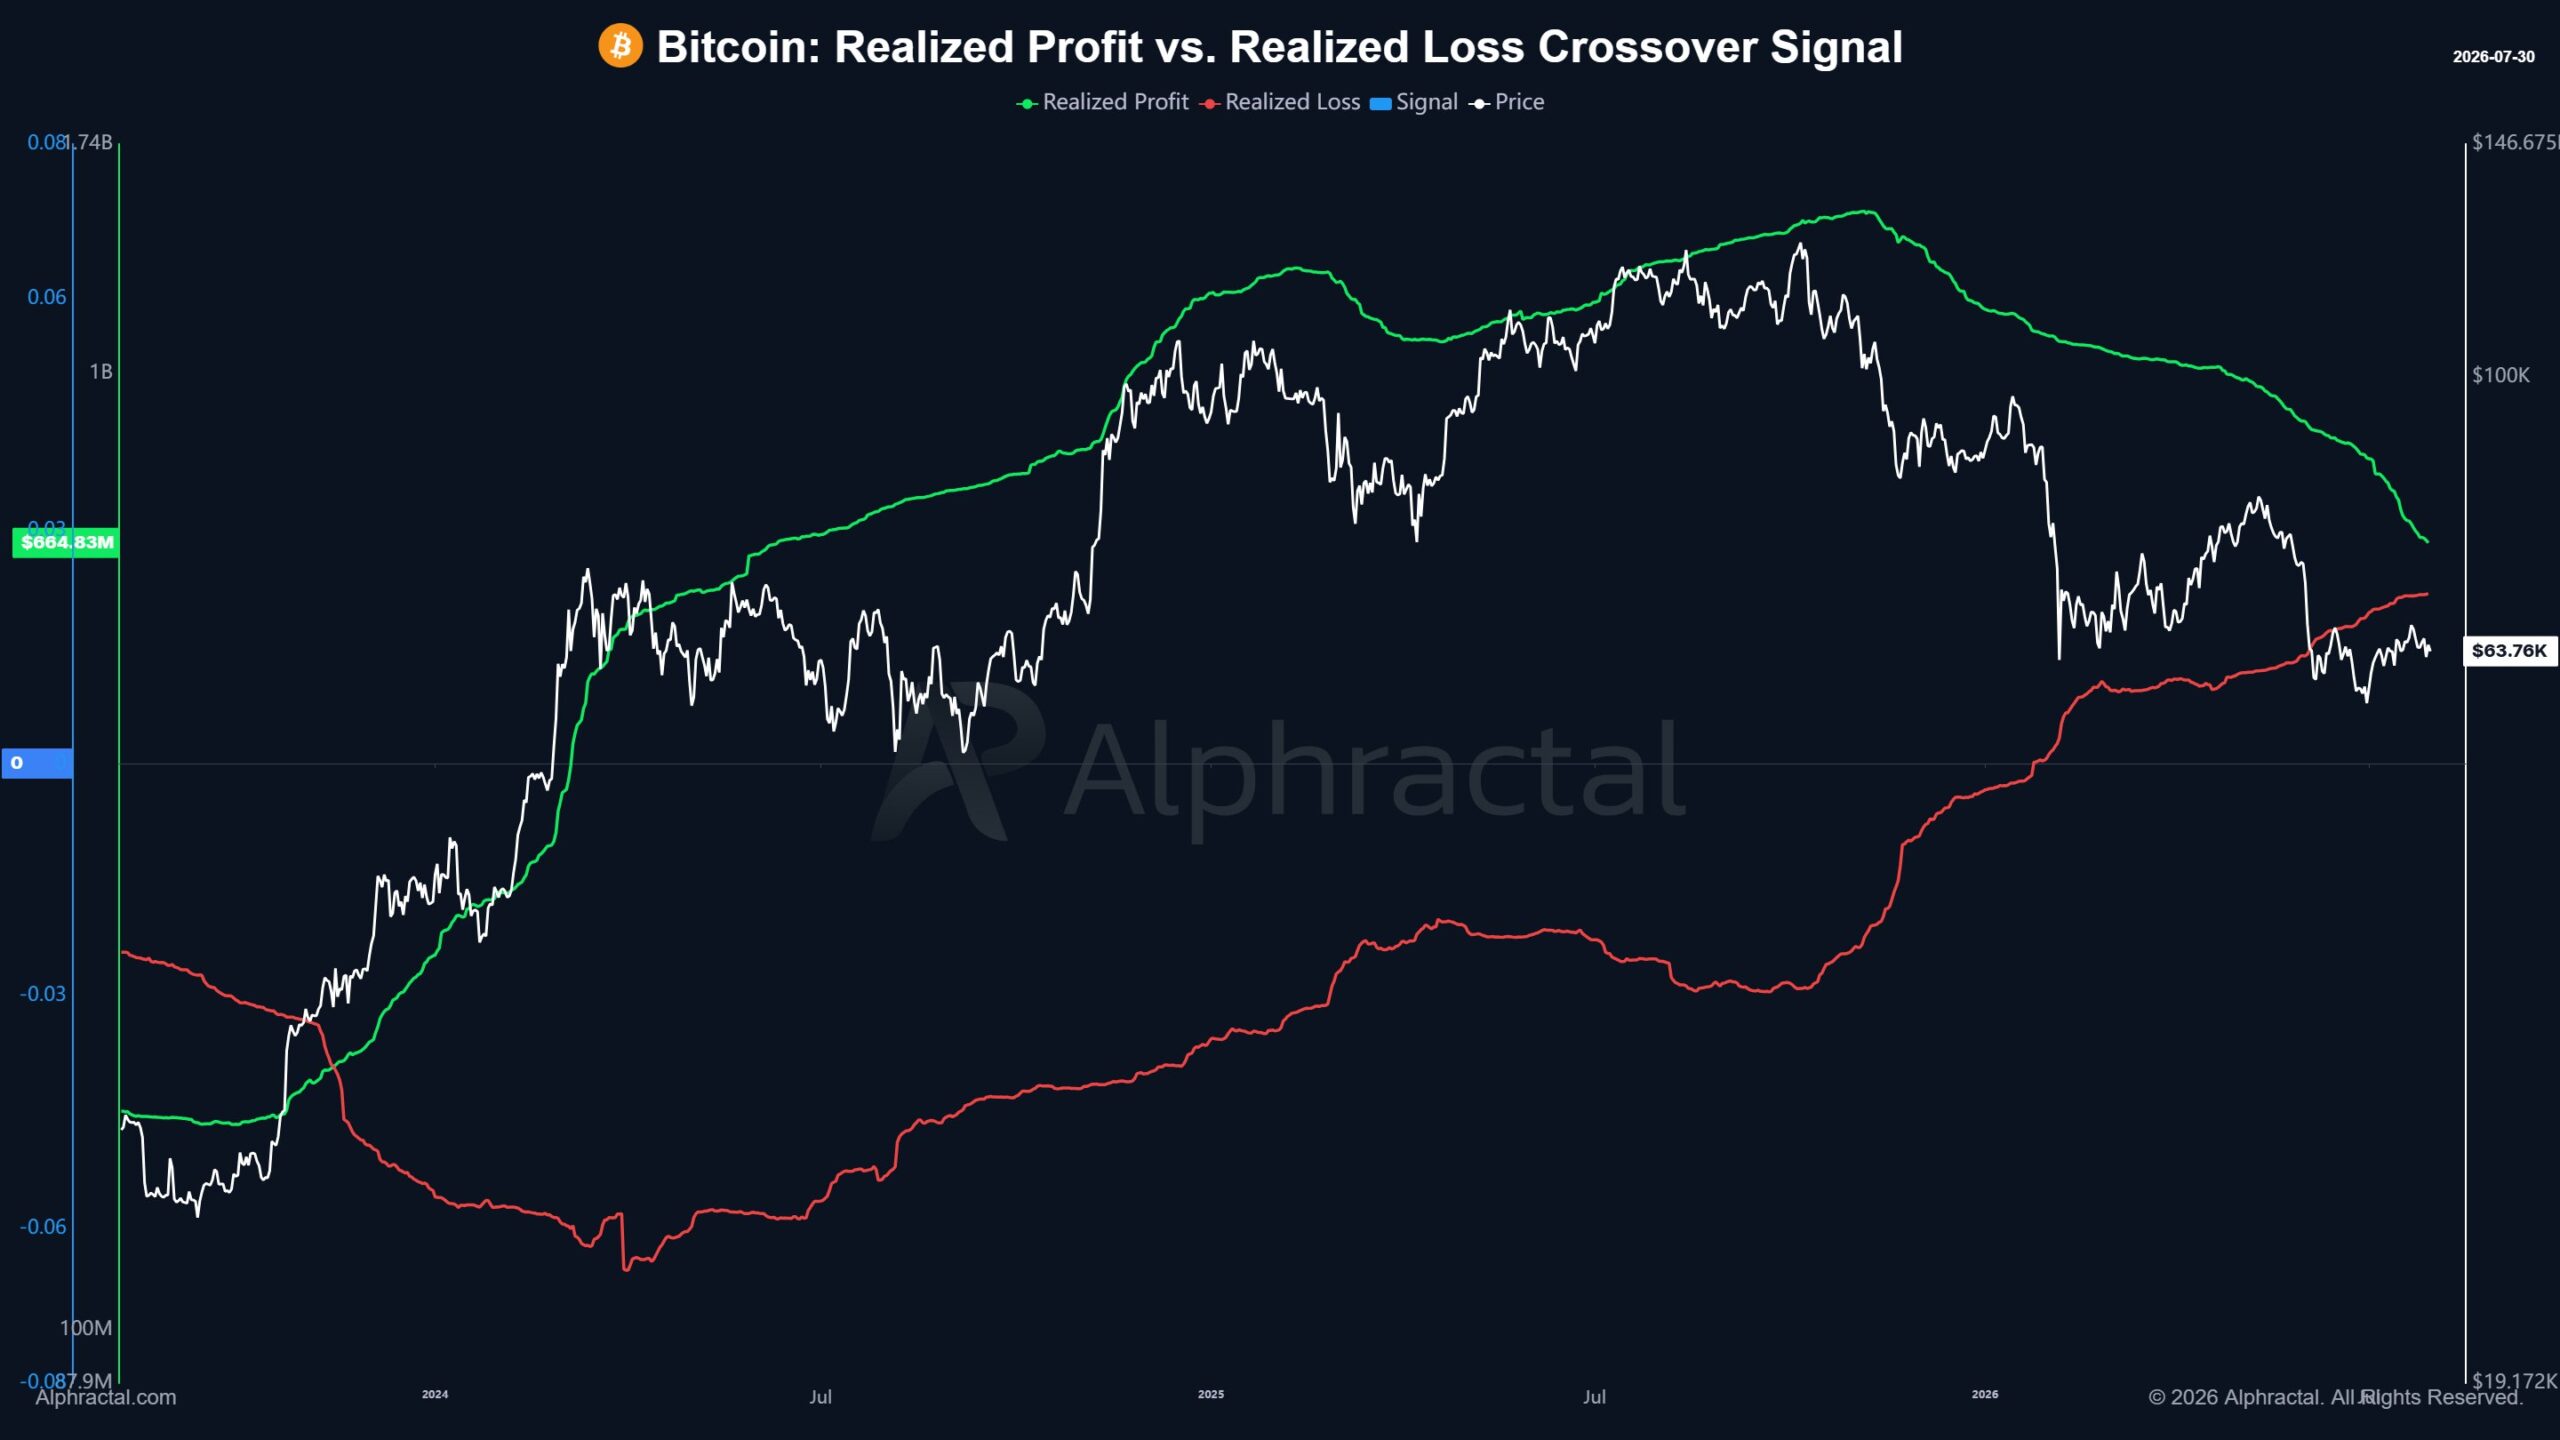
Alphractal analyst Joao Wedson has identified and shared what he characterises as one of the most reliable cycle bottom signals in Bitcoin’s on-chain history — the Realized Profit vs. Realized Loss crossover.
What the metric measures:
Realized Profit (green line) tracks the aggregate dollar value of gains locked in when Bitcoin changes hands on-chain — reflecting holders who are selling at a profit relative to their acquisition price. Realized Loss (red line) tracks the aggregate dollar value of losses locked in when Bitcoin changes hands — reflecting holders who are selling at a loss.
The relationship between these two lines — specifically which is above the other and when they cross — provides a measurable, on-chain representation of the market’s aggregate profit/loss sentiment at any given point in time.
Current readings:
| Metric | Current Value |
|---|---|
| Realized Profit | $664.83M (green — declining) |
| Realized Loss | Rising (red — approaching green) |
| Bitcoin Price | ~$63.76K |
| Signal status | Approaching crossover |
What the Full Historical Chart Shows
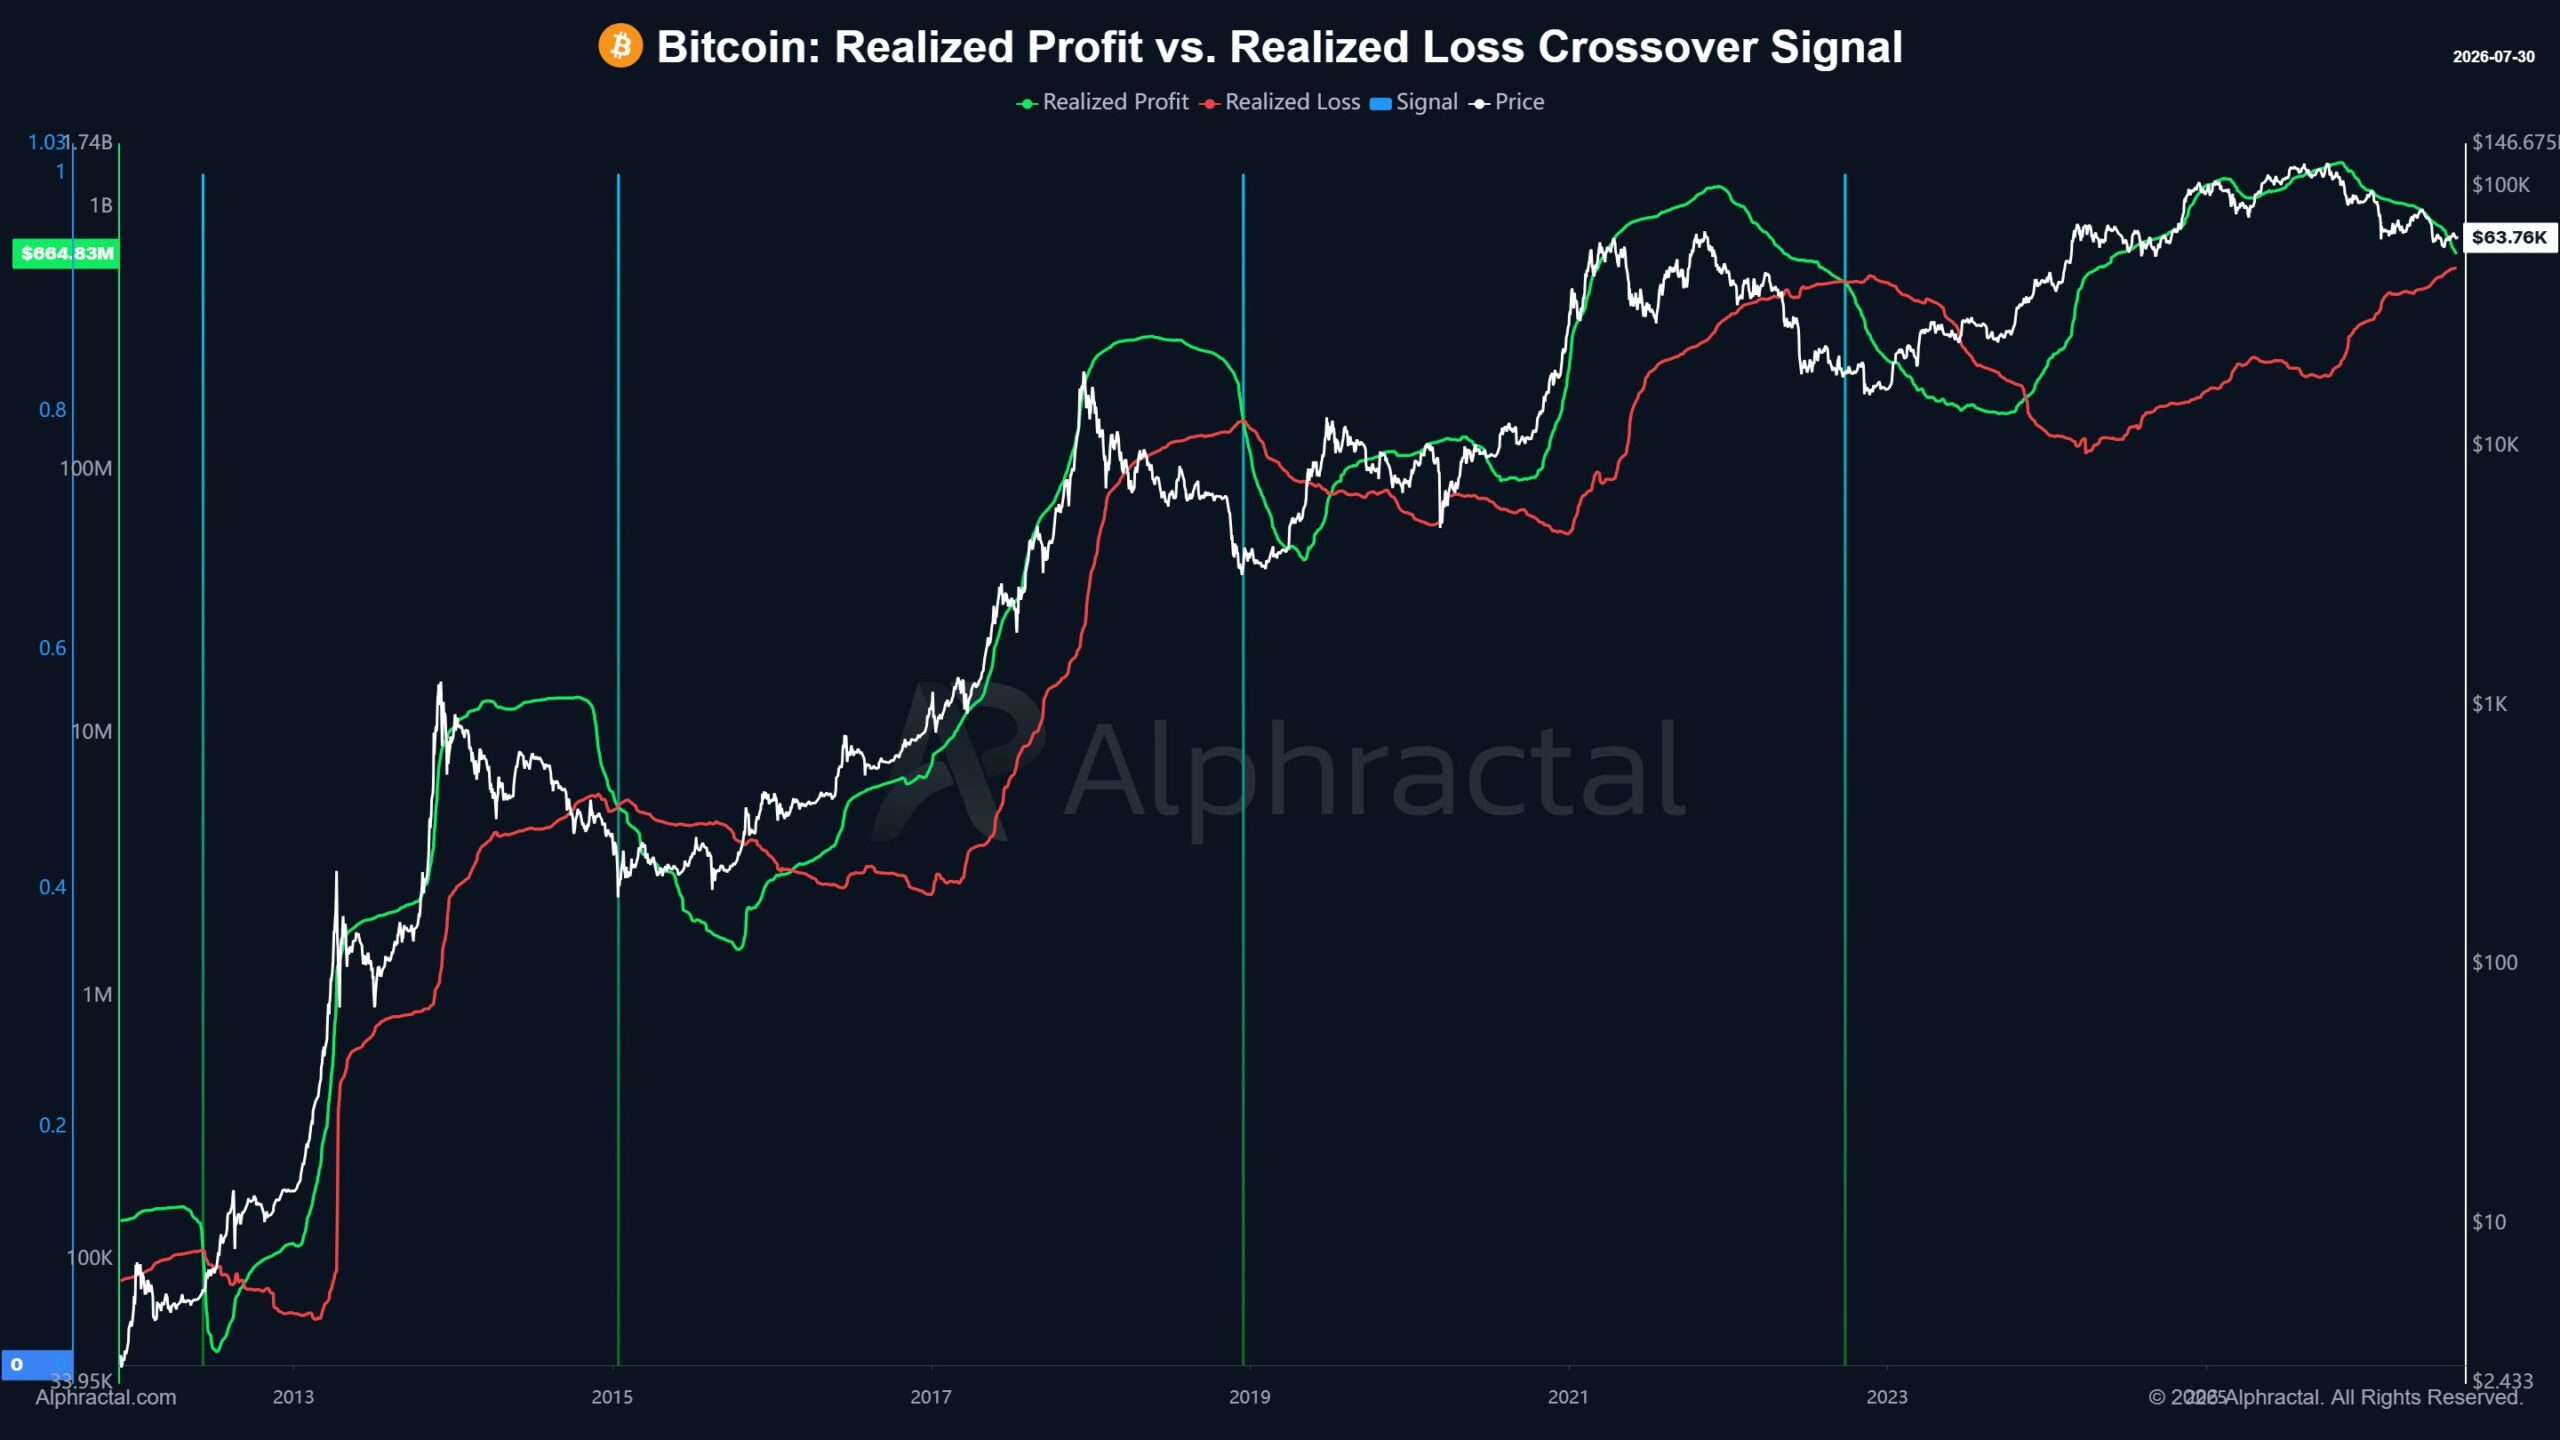
The second chart — showing the complete Bitcoin history from 2012 through July 2026 — is where the signal’s historical credibility becomes most visible. The vertical blue lines mark each prior instance where the Realized Profit and Realized Loss lines crossed — and each blue line aligns with a significant Bitcoin price bottom or major cycle low:
The documented historical crossovers:
Looking at the full chart, the vertical blue lines appear at approximately:
- ~2015 — During Bitcoin’s post-2013 bear market bottom, before the 2016–2017 bull run
- ~2019 — During Bitcoin’s 2018–2019 bear market recovery phase
- ~2023 — At Bitcoin’s cycle low following the 2022 bear market and FTX collapse
In each documented instance — the crossover where Realized Profit dropped below and then re-crossed above Realized Loss (or the equivalent convergence) corresponded with a period where Bitcoin’s subsequent price action turned significantly positive.
The current setup:
The zoomed-in chart (Chart 1) from 2023–2026 shows the current dynamic in detail. Realized Profit (green) peaked during the 2024–2025 bull market when Bitcoin was near its $126,000 all-time high — as the majority of on-chain transactions represented profitable sellers during the rally. As Bitcoin has corrected -26.51% from that peak, Realized Profit has declined consistently as fewer sellers are in profit.
Simultaneously, Realized Loss (red) has been rising steadily through 2026 — reflecting the growing proportion of on-chain transactions where sellers are locking in losses relative to their acquisition price. This is the signature of a capitulation phase — holders who bought during the bull market peak or subsequent corrections are now selling at losses as patience exhausts.
The two lines have converged to their closest proximity since the 2023 crossover — with current Realized Profit at $664.83M and Realized Loss approaching that level from below.
Wedson’s Analysis — “Very Close”
Joao Wedson, the Alphractal analyst tracking this signal, provided a direct and specific characterisation of the current setup:
“When Realized Profit crosses Realized Loss, Bitcoin forms a bottom. And another crossover may be very close. Keep an eye on it!”
The directness of this statement — from an analyst using a metric with multiple confirmed historical instances — is notable. “Very close” is a specific characterisation that the visual convergence of the two lines in the current chart confirms: the gap between Realized Profit and Realized Loss at the current Bitcoin price of ~$63,760 is narrower than it has been at any point since the last confirmed crossover.
Why Realized Profit Crossing Below Realized Loss Signals a Bottom
The mechanism behind the crossover signal is grounded in market psychology and participant behaviour:
The capitulation phase: When Realized Loss rises and approaches Realized Profit, it reflects a sustained period where an increasing proportion of Bitcoin sellers are locking in losses. This behaviour is characteristic of capitulation — holders who bought at higher prices and have been waiting through the decline eventually reach their pain threshold and sell regardless of the loss.
The exhaustion dynamic: As capitulation progresses, the pool of sellers who are still holding unrealised losses gradually diminishes — because those who were going to sell at a loss have already done so. When Realized Loss reaches and crosses Realized Profit, it signals that the market has worked through a significant portion of the loss-realisation that characterises bear market bottoms.
The recovery signal: Once the bulk of loss-realisation is complete, the sellers who remain are predominantly those with conviction — either long-term holders or new buyers who entered at lower prices. With less forced or panic selling coming from underwater holders, the supply/demand balance shifts in favour of price recovery.
This mechanism — loss exhaustion followed by supply contraction — is the same dynamic we have been tracking through multiple independent signals throughout 2026: the 45% of LTH supply in unrealised loss with continued accumulation, the MVRV at the 5th percentile, the 147-day weekly bullish divergence, and the Structural Market Bands support zone. The Realized Profit vs. Loss crossover adds another independent dimension to what is becoming a notably convergent body of bottom-signal evidence.
The Macro Catalyst Supporting the Setup
The on-chain signal is not developing in a macro vacuum. As we covered extensively in mid-July — the US CPI print showing 3.5% annual inflation vs 3.8% expected and a -0.4% month-over-month decline (the largest monthly CPI drop since April 2020) has materially improved the rate cut outlook and removed one of the most persistent macro headwinds for Bitcoin throughout 2026.
The combination of improving macro conditions reducing selling pressure from macro-sensitive holders, and the on-chain Realized Profit vs. Loss convergence reflecting exhaustion of capitulation selling, describes the same bottoming dynamic from two different analytical perspectives simultaneously.
Bottom Line
Bitcoin at $64,311 is approaching what the Realized Profit vs. Realized Loss crossover signal — with a fully documented history of aligning with cycle bottoms across every prior Bitcoin bear market — is identifying as a potential inflection point. Realized Profit at $664.83M is declining, Realized Loss is rising, and the two lines are converging toward their closest proximity since the 2023 crossover that preceded Bitcoin’s last major bull run.
Joao Wedson’s characterisation — “another crossover may be very close” — is supported by both the visual convergence visible on the chart and the body of independent signals that have been accumulating throughout July 2026, all pointing toward the same late-stage bottoming conclusion.
Whether the crossover materialises in the coming days or weeks, and whether it produces the same post-crossover price action that each prior historical instance generated, will be the most important on-chain development to monitor for the remainder of 2026.
Frequently Asked Questions (FAQ)
What is the Realized Profit vs. Realized Loss crossover signal?
An on-chain metric tracked by Alphractal that measures when the aggregate dollar value of profitable Bitcoin on-chain transactions (Realized Profit) crosses the aggregate dollar value of loss-realising transactions (Realized Loss) — a crossover that has historically aligned with major Bitcoin cycle bottoms.
How many times has this signal accurately called a Bitcoin bottom?
The full historical chart shows vertical blue lines at multiple prior crossovers — approximately at the 2015 bear market bottom, the 2019 recovery phase, and the 2023 cycle low — each followed by significant Bitcoin price appreciation.
Does the crossover guarantee a bottom?
No — on-chain metrics are analytical tools, not certainties. The signal has a strong historical track record but operates in the context of broader market conditions, macro factors, and institutional dynamics that can influence timing and magnitude of any subsequent recovery.
The opinions and market insights shared on CoinsProbe represent the views of individual authors based on prevailing market conditions at the time of publication. Cryptocurrency investments carry significant risk and volatility. Readers are encouraged to conduct their own research and seek professional financial advice before making investment decisions. CoinsProbe and its contributors do not accept responsibility for financial losses or decisions made based on published content.
CoinsProbe may publish sponsored articles, affiliate links, or promotional collaborations. All sponsored material is clearly labeled to maintain transparency with our audience. Our editorial decisions remain fully independent, and advertising partnerships do not influence reviews, rankings, or published opinions.
Since 2023, CoinsProbe has delivered reliable insights on cryptocurrency, blockchain, and digital assets. Our content is created by experienced researchers and analysts who follow strict editorial standards focused on accuracy, transparency, and credibility. Every article is carefully reviewed and verified using trusted sources and current market data. We provide unbiased analysis and timely updates covering everything from emerging crypto projects to major industry developments.