
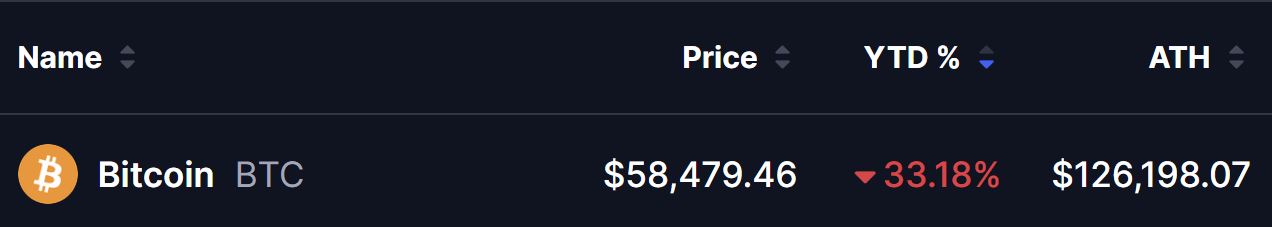
- Bitcoin is trading near $58,479, down 33% year-to-date and about 54% below its all-time high.
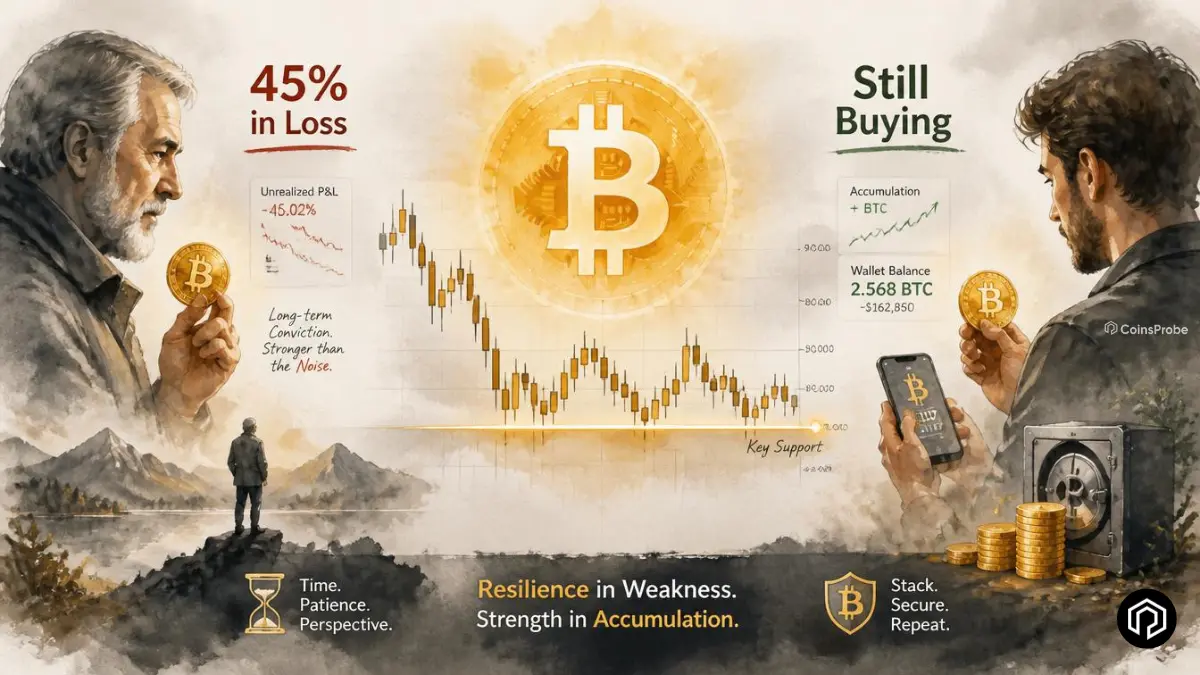
- Around 45% of long-term holder supply is currently in unrealized loss, a level historically seen near major market bottoms.
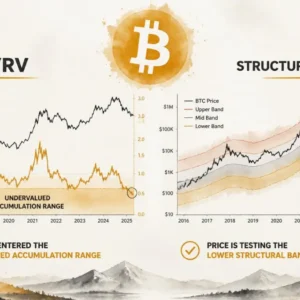
- Bitcoin remains above the Long-Term Holder Realized Price, suggesting full capitulation has not yet occurred.
- Long-term holders continue to accumulate despite losses, a pattern historically associated with cycle bottoms.
Bitcoin’s on-chain landscape is presenting one of its most historically significant readings of the current cycle — and it is not primarily a price signal. It is a holder behaviour signal. Approximately 45% of Bitcoin’s Long-Term Holder supply is sitting in an unrealised loss right now — and the group that is most deeply underwater is continuing to buy rather than sell.
Bitcoin Price at a Glance — June 30, 2026
Bitcoin is currently trading at $58,479.46, down 33.18% year-to-date. Its all-time high stands at $126,198.07.
The Key $BTC Signal — 45% of LTH Supply in Loss
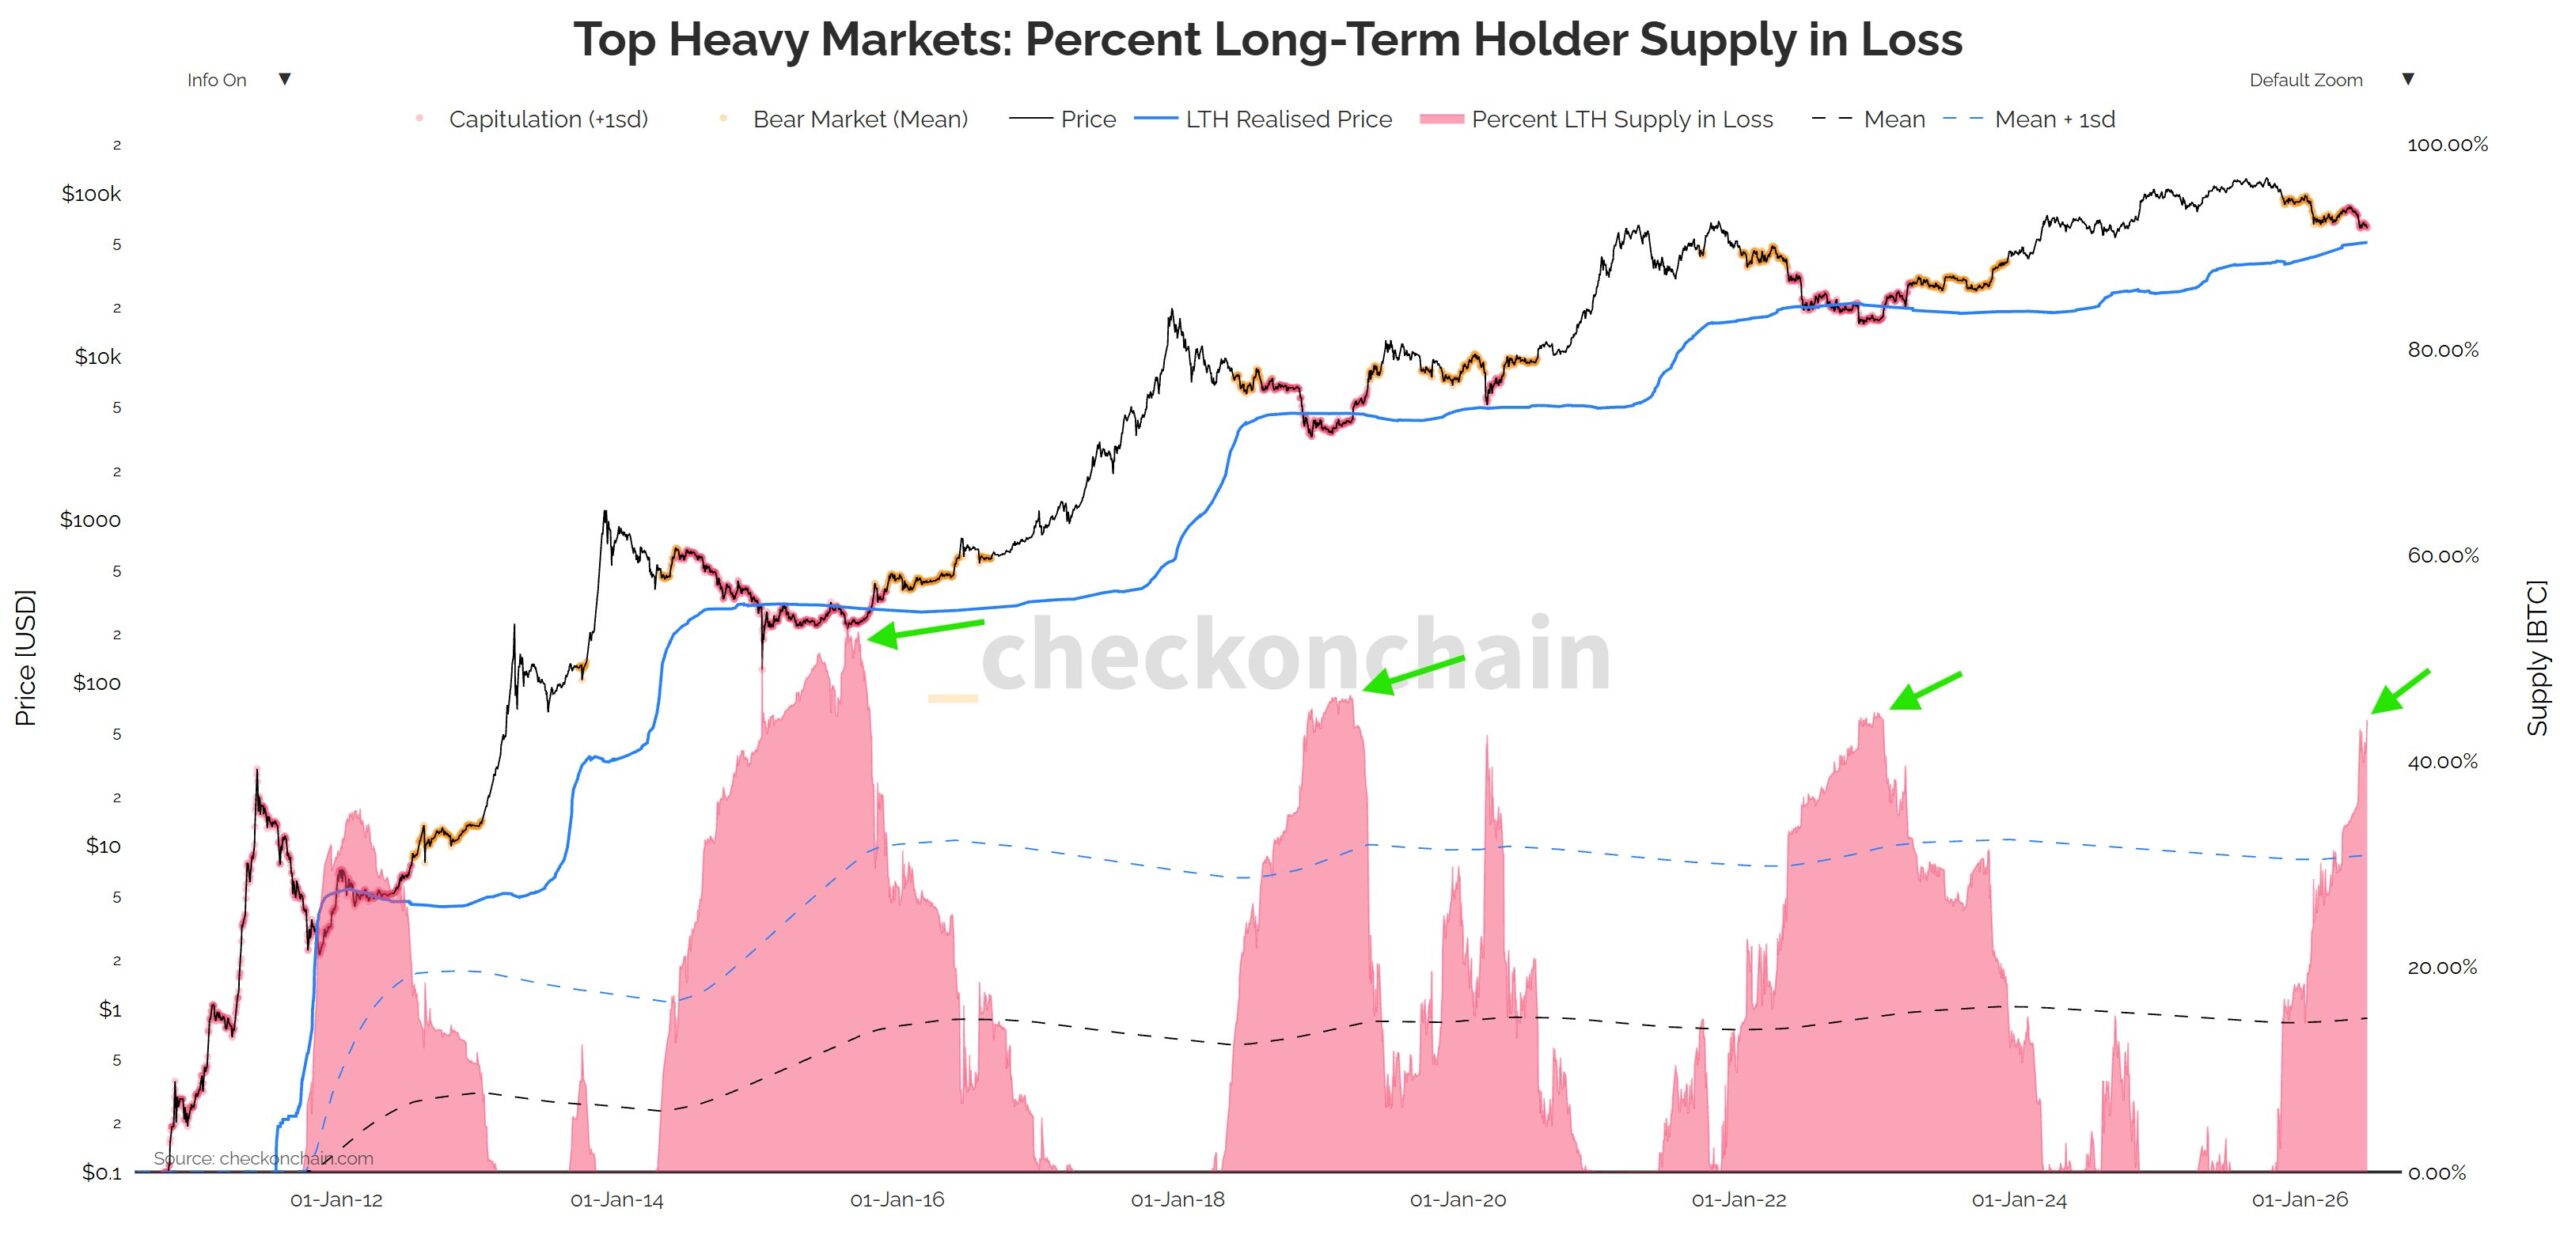
The first chart tells the most immediate story. The pink shaded area — representing the percentage of Long-Term Holder supply currently sitting in unrealised loss — has risen to approximately 45% at the most recent reading, highlighted by the green arrow pointing to the current moment on the right edge of the chart.
What makes this reading historically significant:
Looking back across the chart’s full history — spanning from 2011 through 2026 — the green arrows identify the specific moments where this metric reached comparable elevated levels. Each prior instance aligns with one thing: a major cycle bottom. The 2014–2015 bear market bottom. The 2018–2019 bear market bottom. The 2022 cycle low near $15,500. In every case, elevated LTH supply in loss coincided with the late stages of the bear market and the early stages of the next accumulation phase.
The orange/red shading in the chart represents periods where the indicator enters what Checkonchain labels as “Capitulation” territory — and the current reading is approaching but has not yet reached that deepest zone, consistent with the broader analysis that full capitulation has not yet occurred.
The critical nuance: Bitcoin has not yet traded below the LTH Realised Price — the average cost basis of long-term holders, currently estimated at approximately $50,000–$55,000. In every prior cycle, the deepest capitulation phases involved price briefly trading below this level. The fact that Bitcoin remains above it — even with 45% of LTH supply in loss — suggests the current phase is at a historically significant bottoming zone, but without the final forced-selling event that prior cycles produced.
Long-Term $BTC Holders Are Still Accumulating
The second chart provides the crucial behavioural context that makes the 45% LTH loss figure even more significant.
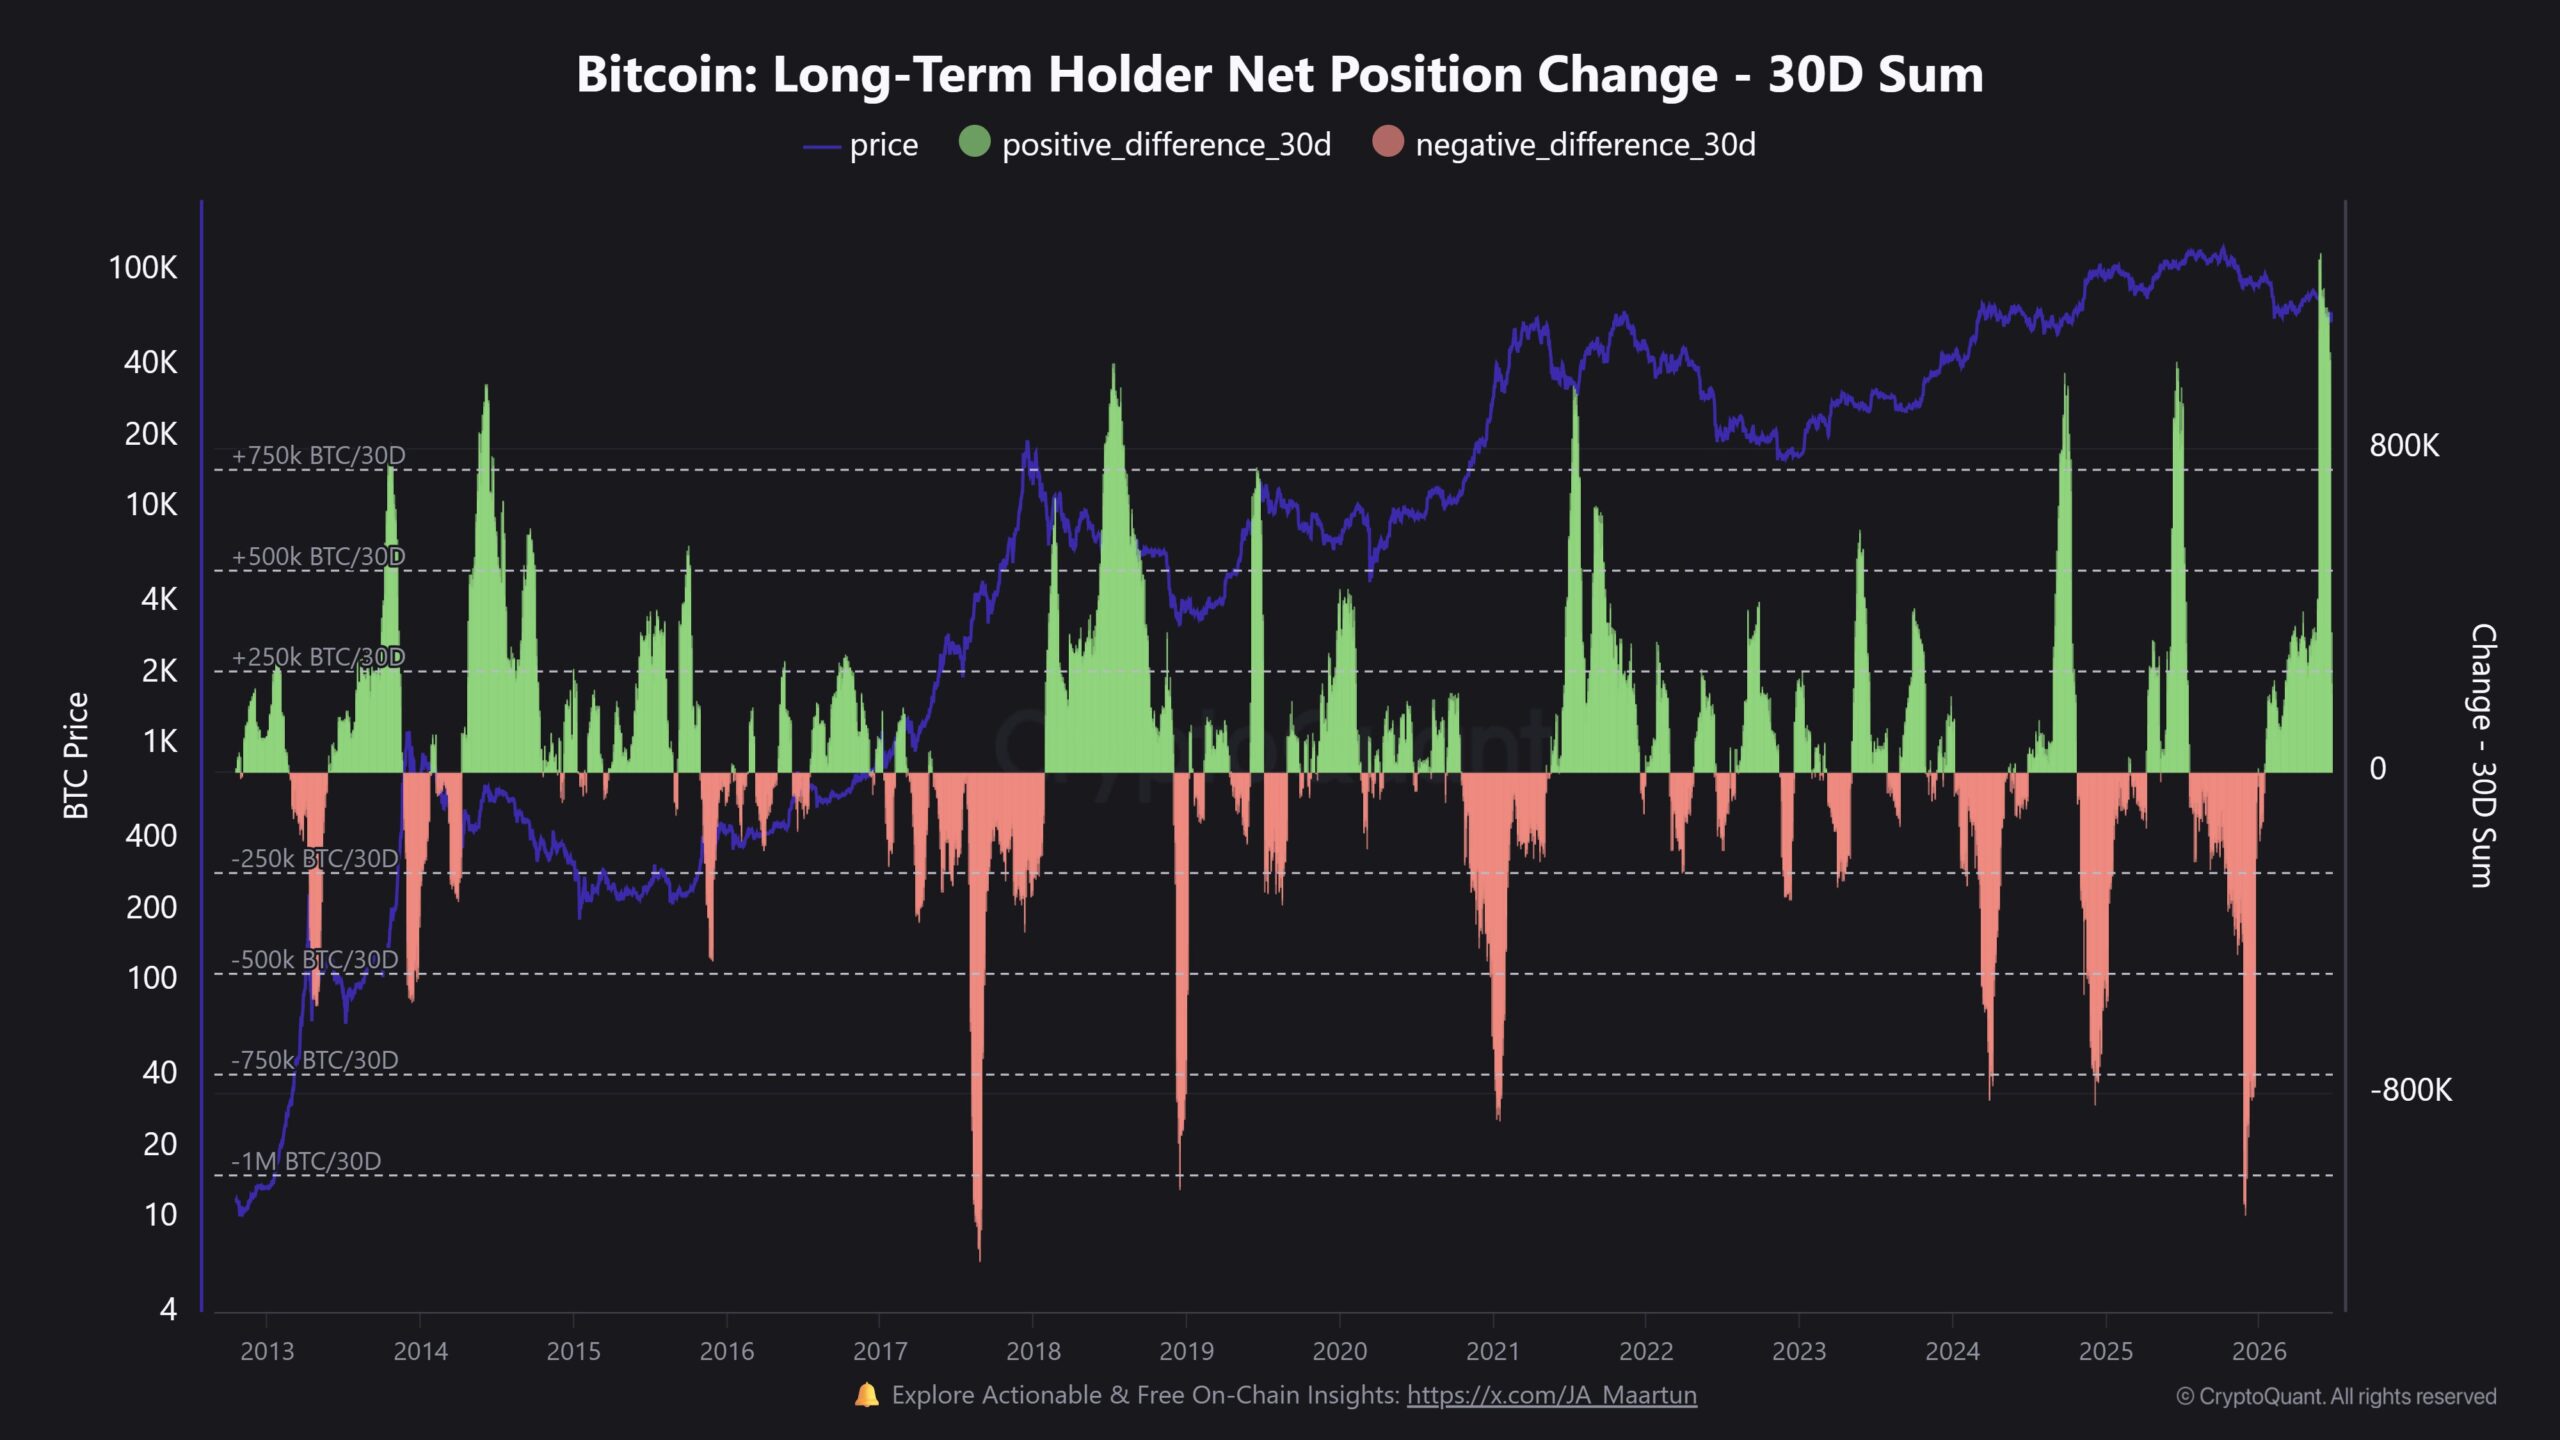
The green bars represent periods when Long-Term Holders are net accumulating — adding more Bitcoin to their holdings over the trailing 30 days than they are distributing. The red/pink bars represent net distribution periods.
What the current reading shows:
The most recent data — visible on the far right of the chart — shows a significant spike in green accumulation bars, reaching levels of positive net position change that are among the largest in Bitcoin’s history. Long-Term Holders, as a group, are currently net accumulating at a historically elevated rate — despite the fact that approximately 45% of their supply is sitting in an unrealised loss at the current price.
This is the behavioural pattern that analysts reference when identifying cycle bottoms: the group with the strongest conviction — the holders who have survived prior 80–90% drawdowns, who understand Bitcoin’s multi-year cycles — is choosing to add to their positions while underwater rather than capitulate and sell.
Comparing to prior cycles: The green accumulation spikes visible in 2014, 2018–2019, 2020, and 2022–2023 all preceded meaningful Bitcoin price recoveries. The current spike in LTH net accumulation is occurring at levels comparable to or exceeding those prior instances — adding weight to the pattern recognition that this metric has historically provided.
“Who’s Left to Sell?” — The Core Question
The combination of these two data points — 45% of LTH supply in loss, paired with the largest LTH net accumulation readings in recent history — raises what many analysts describe as the central market structure question of the current moment:
If the strongest long-term holders are not selling despite being underwater — who is left to sell?
The logic follows a well-documented cycle pattern:
Short-term traders and speculators — those who entered during the bull market rally — have largely already exited, either through panic selling during the correction or through targeted stop-losses. Their selling has already occurred.
Institutional buyers who entered near the top — some of whom may have reduced exposure at various points during the correction, contributing to the significant ETF outflows we have documented, including the third-highest weekly ETF outflow on record.
Long-Term Holders — the group with the deepest conviction and the longest time horizons — are, as the accumulation chart shows, actively buying rather than selling.
When this dynamic reaches its logical conclusion — sellers largely exhausted, conviction holders continuing to add — the available liquid supply for new buyers continues to shrink. This supply compression dynamic is what creates the conditions for sharp upward price moves when sentiment eventually shifts and new demand enters the market.
Why Price Hasn’t Broken the LTH Realised Price — And Why It Matters
The LTH Realised Price — approximately $50,000–$55,000 — represents the average price at which all current long-term holders acquired their Bitcoin. When price falls below this level, it means the average long-term holder is sitting at a loss on their entire position — a condition that historically has produced the most intense selling pressure, as even conviction holders face psychological and financial pressure to exit.
The current setup: With Bitcoin at $58,479, price remains above this level — meaning the average long-term holder is still marginally profitable on their overall cost basis, even though 45% of LTH supply is in loss (reflecting the distribution of individual cost bases above the average).
This distinction matters for understanding the severity of the current phase. As we covered in our 10.46 million BTC at a loss analysis and our Bitcoin Wyckoff Phase B analysis, the on-chain picture has been pointing toward a late-stage accumulation phase for weeks. The 45% LTH loss reading and the concurrent accumulation spike add two more historically significant data points to that broader body of evidence.
Is This a Classic Cycle Bottom Signal?
The title asks the question directly — and the honest answer is: the evidence points strongly toward yes, but with important caveats that matter.
What the data clearly shows:
The current combination of 45% LTH supply in unrealised loss paired with historically elevated LTH accumulation has been present at every major Bitcoin cycle bottom on record. The pattern across 2014, 2018–2019, 2022, and now 2026 is consistent, well-documented, and visible across both charts above. On that basis alone — the signal is as close to a “classic cycle bottom” reading as Bitcoin’s on-chain data produces.
What it does not guarantee:
An immediate or automatic price reversal. Three specific macro headwinds remain live and capable of extending the current phase beyond what the on-chain signal alone would suggest — the BOJ rate hiking cycle that has crashed Bitcoin after every prior hike, ongoing Fed policy uncertainty under Chair Warsh who has removed forward guidance entirely, and continuing ETF flow volatility. The LTH signal establishes the structural backdrop for a recovery — it does not specify when that recovery begins or what catalyst triggers it.
The one key variable still unresolved:
Whether Bitcoin eventually tests — and potentially briefly breaches — the LTH Realised Price near $50,000–$55,000. Every prior cycle has included this event: a final, sharp dip below the average long-term holder cost basis that forces maximum pain and triggers the last wave of capitulation selling before the recovery begins. That specific event has not yet occurred in the current cycle.
The open question, then, is whether the extraordinary scale of current LTH accumulation is sufficient to establish this cycle’s final low above that threshold — or whether Bitcoin still needs to test the $50,000–$55,000 zone before the structural conditions fully reset for the next bull market.
The data says classic cycle bottom signal. The macro context says the timing remains uncertain. And the LTH Realised Price says one more test may still be ahead.
Bottom Line
The on-chain picture Bitcoin is presenting right now — 45% of Long-Term Holder supply in loss, paired with one of the largest LTH net accumulation spikes in the asset’s history — is one of the most historically consistent bottoming signals the asset has ever produced. The tourists have largely left. The short-term speculators have largely sold. And the group that has been through every Bitcoin cycle — the long-term holders who understand what a 50–70% drawdown within a bull market looks like — is not just holding through the pain. They are buying more.
This is the setup that has preceded every major Bitcoin bull market in the asset’s history. It does not come with a guaranteed start date for the next one. But the structural ingredients identified across both charts — elevated LTH loss percentage meeting historically elevated LTH accumulation — are now clearly present simultaneously for the first time in the current cycle.
Frequently Asked Questions (FAQ)
What percentage of Bitcoin’s LTH supply is currently in loss?
Approximately 45% — a level that has historically been reached only at major Bitcoin cycle bottoms in prior cycles.
What is the LTH Realised Price and why does it matter?
The average acquisition cost of all current long-term holders — estimated near $50,000–$55,000. When price falls below this level, even the average long-term holder is at a loss — historically producing the most intense selling pressure. Bitcoin currently remains above this level.
What does the LTH Net Position Change chart show?
A significant spike in green accumulation bars — meaning Long-Term Holders are adding Bitcoin to their positions at a historically elevated rate, despite approximately 45% of their supply sitting at an unrealised loss.
Why does this combination of signals matter historically?
The pattern of elevated LTH loss percentage paired with significant LTH accumulation has been present at every major Bitcoin cycle bottom — 2014, 2018–2019, 2022, and now 2026.
Does this guarantee a Bitcoin recovery?
No — this is a structural backdrop signal, not a guaranteed outcome or start date for the next bull market. Macro headwinds including BOJ policy, Fed uncertainty, and ETF flows remain active variables.
The opinions and market insights shared on CoinsProbe represent the views of individual authors based on prevailing market conditions at the time of publication. Cryptocurrency investments carry significant risk and volatility. Readers are encouraged to conduct their own research and seek professional financial advice before making investment decisions. CoinsProbe and its contributors do not accept responsibility for financial losses or decisions made based on published content.
CoinsProbe may publish sponsored articles, affiliate links, or promotional collaborations. All sponsored material is clearly labeled to maintain transparency with our audience. Our editorial decisions remain fully independent, and advertising partnerships do not influence reviews, rankings, or published opinions.
Since 2023, CoinsProbe has delivered reliable insights on cryptocurrency, blockchain, and digital assets. Our content is created by experienced researchers and analysts who follow strict editorial standards focused on accuracy, transparency, and credibility. Every article is carefully reviewed and verified using trusted sources and current market data. We provide unbiased analysis and timely updates covering everything from emerging crypto projects to major industry developments.