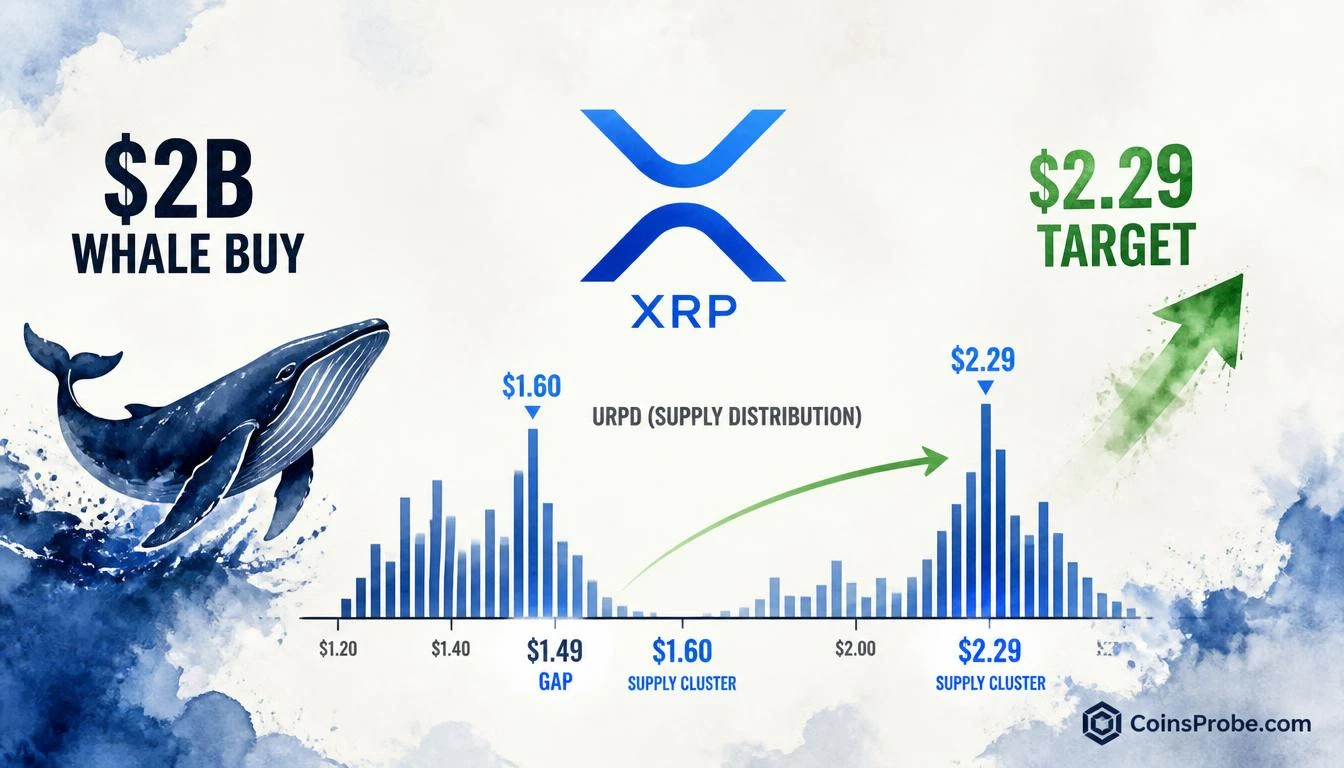
- XRP trades at $1.50, up 6.95% in 24 hours, after whales accumulated $2B+ worth of XRP per @alicharts Glassnode URPD shows $1.60 as largest supply concentration — primary on-chain support floor whale-defended
- Supply gap at $1.49 creates near-zero resistance on pullbacks; primary overhead wall sits at $2.19–$2.29
- $2.29 resistance ceiling represents ~53% upside from current $1.50 if $1.60 holds on daily close
XRP is trading at $1.50 — up 6.95% in the past 24 hours and carrying a market cap of $94.58 billion — as on-chain data confirms what price action is beginning to reflect: a coordinated $2 billion whale accumulation event has built a structural cost-basis floor, and the URPD distribution map suggests the next major resistance cluster sits nearly 53% above current price.
The catalyst was identified by crypto analyst Ali Martinez (@alicharts), who flagged the whale move alongside the on-chain URPD data: “Recently, whales accumulated more than $2 billion worth of XRP. Now that demand appears to be showing up in price, with XRP rallying 8.22% in just three days. But on-chain data suggests there may still be room to run.” The structural read from Glassnode’s URPD chart is what separates this rally from noise — it shows where coins actually sit, at what cost basis, and where sellers are most likely to emerge.
Signal 1 — $2 Billion Whale Accumulation: The On-Chain Foundation
Whale accumulation of this magnitude — $2 billion worth of XRP in a concentrated window — is not a routine buy. At XRP’s current price of $1.50, that represents roughly 1.33 billion XRP tokens acquired by large holders at levels spanning the $1.27–$1.60 range. This is confirmed by Glassnode’s URPD data, which shows the heaviest cost-basis clusters at precisely those levels.
The significance: when whales buy at a specific level, they defend it. Their average entry price becomes the market’s support floor — not because of technical analysis, but because those holders have financial incentive to buy any dip back to their cost basis. The $1.60 zone now carries the largest single supply concentration in XRP’s current distribution, making it the most structurally defended level in the market.
The 8.22% three-day rally that followed the accumulation is the market beginning to price in that scarcity signal. Large holders absorbed supply at discount — the float available for spot sellers has thinned. Upward price pressure follows mechanically.
Signal 2 — The URPD: What the On-Chain Distribution Map Actually Shows
The URPD (UTXO Realized Price Distribution), sourced from Glassnode, maps XRP supply against the price at which each unit was last moved — its cost basis. It is not a price prediction tool. It is a supply topology: a map of where coins are anchored and where they are absent.
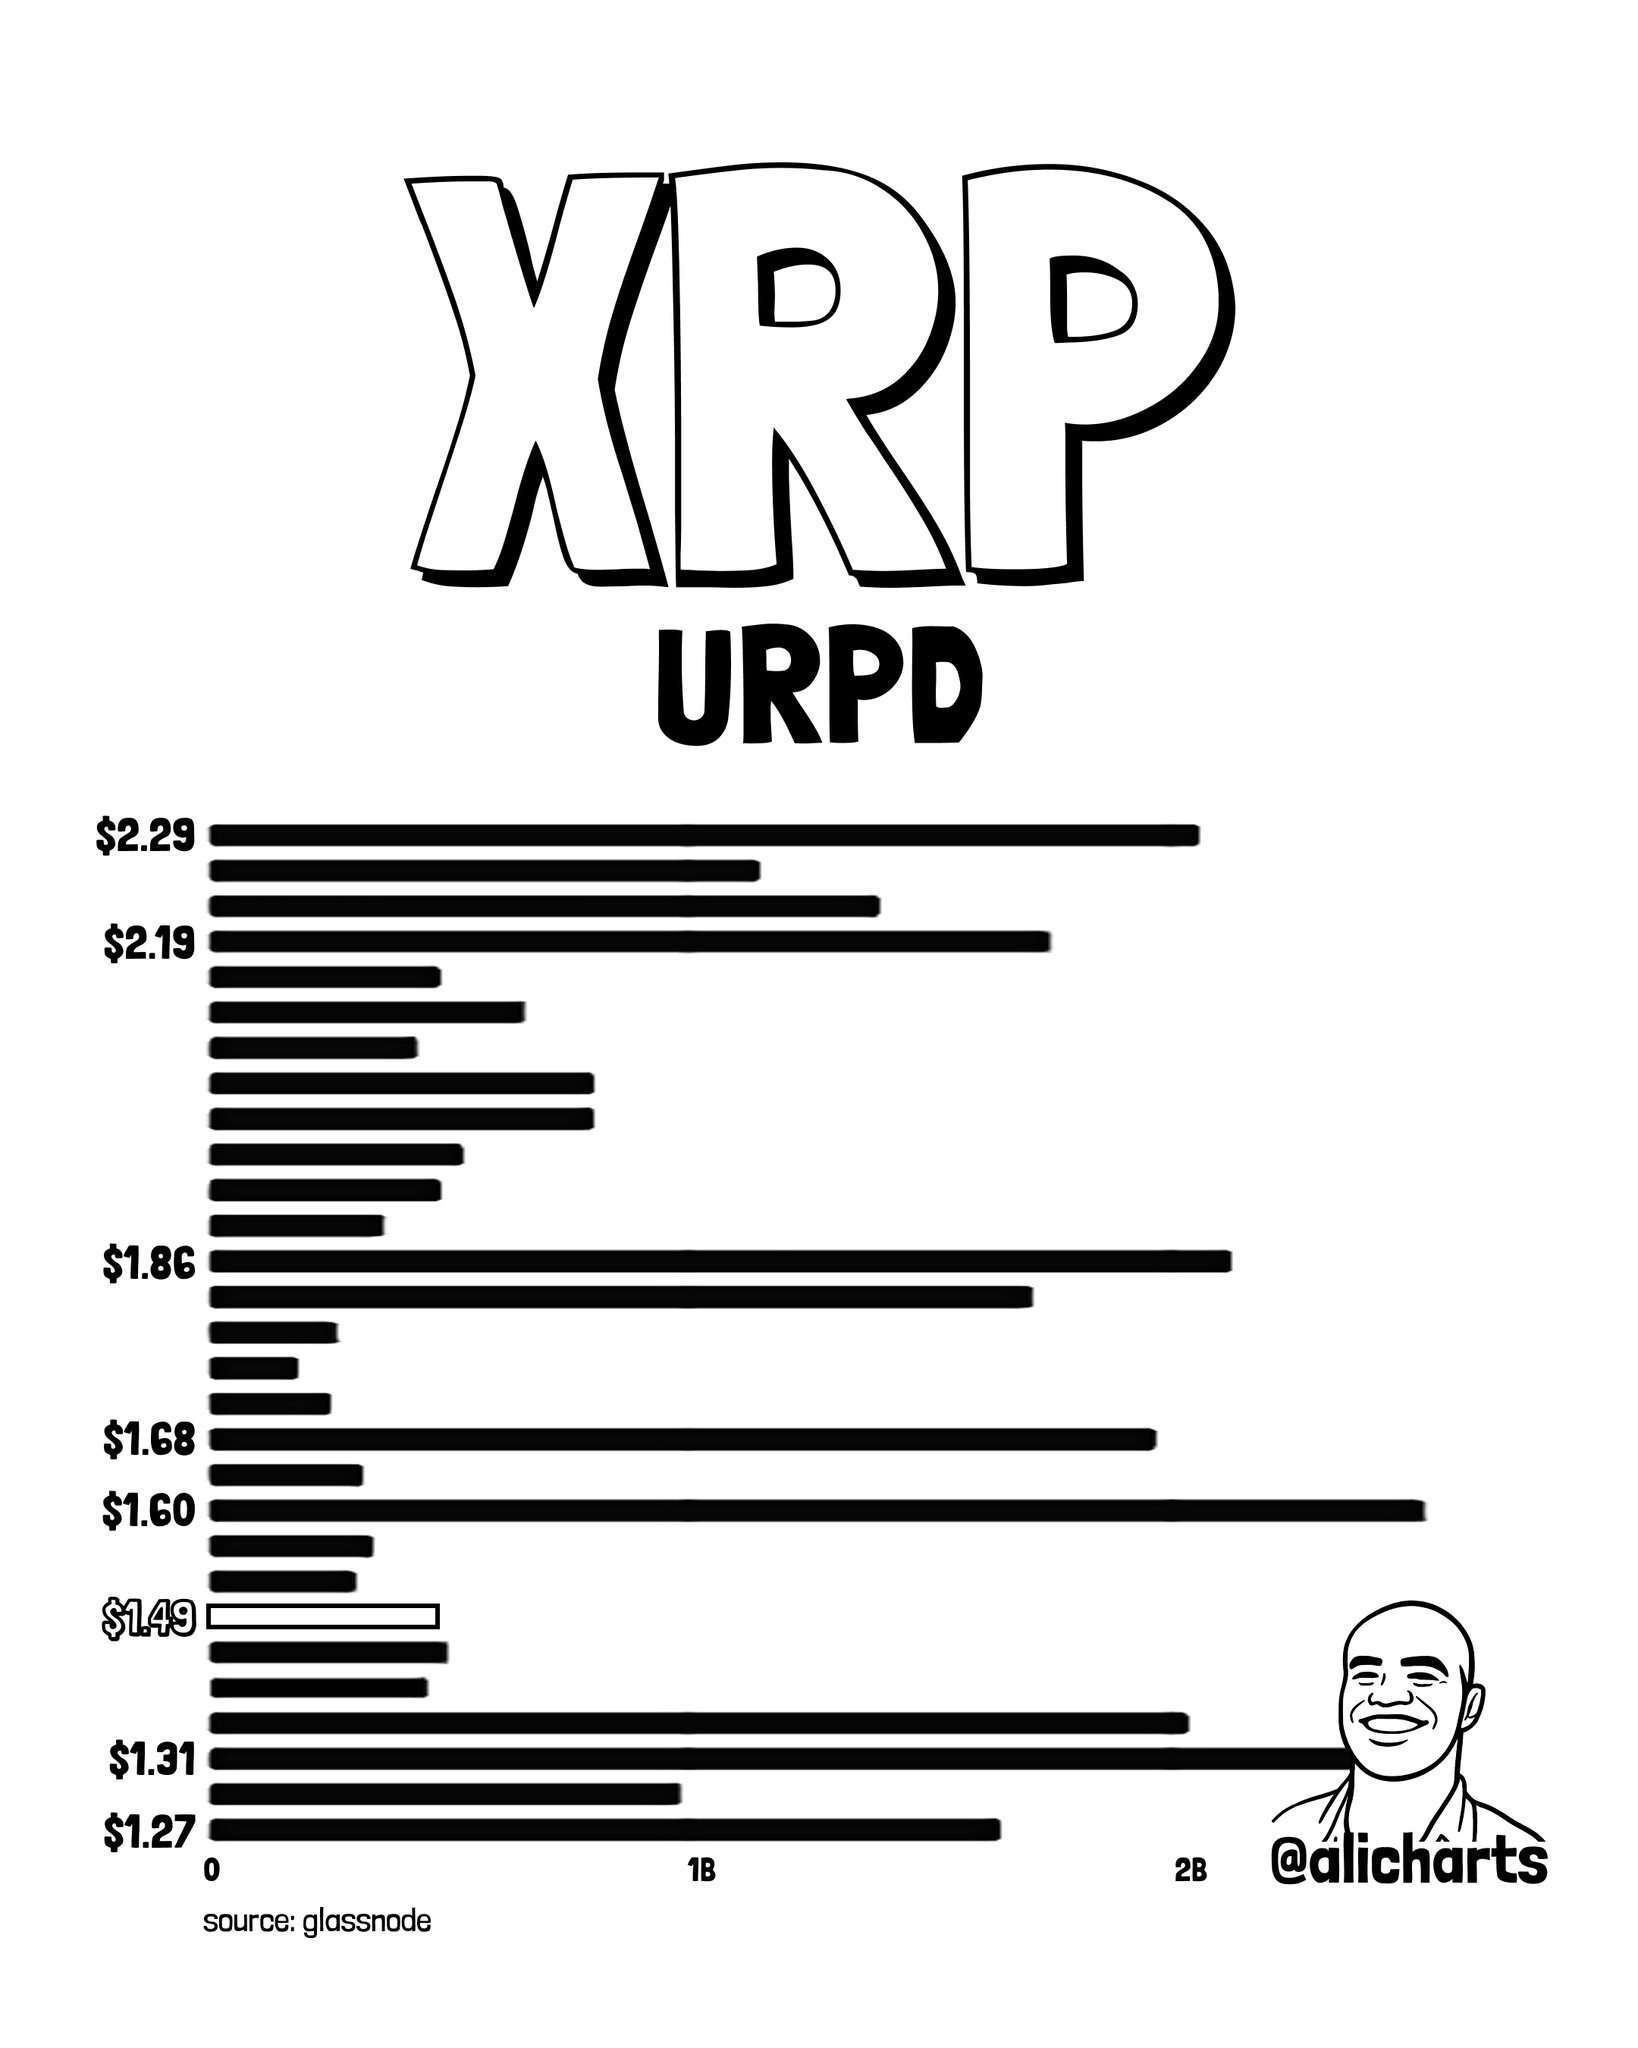
Ali Martinez’s URPD chart for XRP reveals four critical zones that define the current trade structure:
| Price Level | Supply Density | Market Implication |
|---|---|---|
| $1.27–$1.31 | Heavy accumulation cluster | Secondary support floor — whale cost basis zone |
| $1.49 | Supply gap / low-volume node | Minimal resistance if price revisits — fast-pass zone |
| $1.60 | Largest single concentration (~2B+ XRP) | Primary support — most aggressively defended level |
| $1.86 | Significant cluster | Intermediate resistance — partial sell pressure |
| $2.19–$2.29 | ~1B XRP concentrated | Primary overhead resistance — key supply wall |
Source: Glassnode URPD data via @alicharts (X)
The most important structural insight from this chart: the supply gap at $1.49. A low-volume node means price passed through that zone rapidly during a prior move — almost no XRP changed hands there. This creates a near-frictionless corridor. If XRP revisits $1.49 on any pullback, there is minimal supply to absorb — the floor at $1.60 catches it. If price continues upward from current levels, the path toward $1.86 also lacks major resistance clusters until that zone is reached.
Ali Martinez shared the Glassnode URPD chart showing these exact distribution clusters — the $1.60 support wall, the $1.49 gap, and the $2.19–$2.29 resistance ceiling clearly marked by supply density. [CHART_HERE]
What the Data Says — And What It Doesn’t
What it says: Whales established a cost-basis floor between $1.27 and $1.60. The largest supply concentration in XRP’s current URPD sits at $1.60, making it the most structurally defended support level. Overhead resistance begins to build meaningfully only at $1.86, with the primary supply wall at $2.19–$2.29.
What it doesn’t say: The URPD is not a timing tool. It does not predict when price reaches the $2.29 resistance — only that the structural path there carries less friction than the levels above it. Supply gaps do not guarantee momentum continuation.
What to watch for continuation: XRP must hold above $1.60 on any retest. A daily close below that level would signal whale holders are beginning to exit rather than defend — structurally invalidating the accumulation thesis. Sustained volume above $1.86 would confirm the next leg toward $2.19–$2.29 is active. For context on XRP’s broader protocol evolution, see What is XRP 2.0: Everything You Need To Know.
The Path Forward — Intermediate Levels and the Primary Target
Between current price ($1.50) and the primary resistance cluster at $2.19–$2.29, the URPD identifies the following intermediate markers:
- $1.60 — Must hold as support (largest cost-basis anchor). Currently acting as immediate upside to reclaim, then defend.
- $1.86 — First meaningful resistance cluster. Expect partial sell pressure from holders who accumulated at this level during prior distribution phases.
- $2.19–$2.29 — Primary overhead supply wall (~1 billion XRP concentrated here). This is where the structural rally, if sustained, meets its first significant test of distribution pressure.
From current price of $1.50 to the $2.29 ceiling, the implied upside is approximately 53%. That is not a price target — it is the URPD’s structural reading of where supply concentration next becomes material. Similar on-chain structural reads in the broader crypto market have framed multi-week moves; for comparable analysis see how Bitcoin recently reclaimed a key moving average after a structural signal aligned with price.
Bullish Scenario — Defense of $1.60
XRP holds the $1.60 cost-basis zone on any pullback, confirms it as support with a daily close above it, and builds toward $1.86. A clean break through $1.86 with volume opens the $2.19–$2.29 resistance cluster — a 53% move from current price. Precedent: the $2B+ whale cost basis at $1.60 creates financial incentive for large holders to defend aggressively.
Bearish Scenario — Loss of $1.60
A sustained daily close below $1.60 means whales are no longer defending their primary cost-basis level — signaling distribution, not accumulation. Next structural support per the URPD sits at the secondary cluster at $1.31, representing approximately 13% downside from current price. Loss of $1.31 would expose the $1.27 zone and structurally undermine the entire whale accumulation thesis.
Bottom Line
XRP’s 8.22% three-day rally is not speculative froth — it is price catching up to a $2 billion on-chain fact. Whales established a cost-basis floor at $1.27–$1.60, the URPD confirms it as the heaviest supply concentration in the current distribution, and Glassnode’s data shows a near-frictionless supply gap at $1.49 that eliminates meaningful resistance for any pullback. The structural path to $2.29 carries less friction than the levels above it — with only $1.86 offering an intermediate supply cluster worth monitoring. The single level that determines whether this thesis holds or fails is $1.60 — the largest cost-basis anchor in XRP’s current URPD. Watch it on every daily close. And for traders tracking momentum signals across assets, the SUI TD Sequential ’13’ Buy Signal offers a comparable study in how on-chain signals precede confirmed price moves. Whether XRP reaches $2.29 will be answered, in real time, by Glassnode’s URPD as supply clusters thin or thicken with each session. Source: x.com
Frequently Asked Questions
What does the URPD signal mean for XRP right now?
How much did XRP whales accumulate and at what price?
What is XRP’s next resistance level after $1.60?
What price level would invalidate the XRP whale accumulation thesis?
Source: Ali Charts · Published by CoinsProbe Markets Desk
The opinions and market insights shared on CoinsProbe represent the views of individual authors based on prevailing market conditions at the time of publication. Cryptocurrency investments carry significant risk and volatility. Readers are encouraged to conduct their own research and seek professional financial advice before making investment decisions. CoinsProbe and its contributors do not accept responsibility for financial losses or decisions made based on published content.
CoinsProbe may publish sponsored articles, affiliate links, or promotional collaborations. All sponsored material is clearly labeled to maintain transparency with our audience. Our editorial decisions remain fully independent, and advertising partnerships do not influence reviews, rankings, or published opinions.
Since 2023, CoinsProbe has delivered reliable insights on cryptocurrency, blockchain, and digital assets. Our content is created by experienced researchers and analysts who follow strict editorial standards focused on accuracy, transparency, and credibility. Every article is carefully reviewed and verified using trusted sources and current market data. We provide unbiased analysis and timely updates covering everything from emerging crypto projects to major industry developments.