

- Bitcoin trades at $84,550 (+5.13% 24h) after posting its first weekly close above the 50-Week MA since November 2025
- Analyst @CryptoBullet1 flags the signal but requires 3 consecutive weekly closes above ~$81,000 for confirmed breakout
- Prior 50-Week MA reclaims preceded rallies of +331% (2019) and +371% (2023) from cycle lows
- Bear phase drawdown: ~54–55% from $124,000–$128,000 ATH to $57,000–$58,000 cycle low over 9–10 months
Bitcoin is trading at $84,550 — up 5.13% in the last 24 hours — with a market capitalization of $1.699 trillion. For the first time since November 2025, Bitcoin has posted a weekly close above its 50-Week Moving Average. That is not a routine technical event. In prior cycles, this reclaim has marked the structural boundary between bear market and bull market regime — the precise line where distribution ends and accumulation confirms.
The signal was flagged by analyst @CryptoBullet1, who noted: “$BTC first weekly close above the 50-Week MA since November 2025! (Ideally we need 3 consecutive closes above to confirm the breakout).”
The caution embedded in that parenthetical is important — one close is a signal, three closes is confirmation. The difference between the two has historically separated fakeouts from genuine regime shifts.
Signal 1 — The 50-Week Moving Average Reclaim
The 50-Week Moving Average is one of the most structurally significant trend filters in macro Bitcoin analysis. It does not measure momentum. It does not measure sentiment. It measures the average closing price of Bitcoin across the prior 50 weeks — approximately one year of market data smoothed into a single line. When price trades below it for an extended period and then reclaims it on a weekly closing basis, the market is signaling that the mean has shifted — that the distribution phase which characterized the prior months is giving way to a new directional structure.
According to the chart shared by @CryptoBullet1, Bitcoin’s 50-Week MA is currently intersecting near the $81,000 level. Price had been trading below this average since approximately November 2025, following the collapse from the previous all-time high zone near $124,000–$128,000. The bear cycle low during this drawdown settled in the $57,000–$58,000 range in mid-2026 — a decline of approximately 54–55% from the peak. The current close above $81,000 represents Bitcoin reclaiming the mean of that entire cycle.
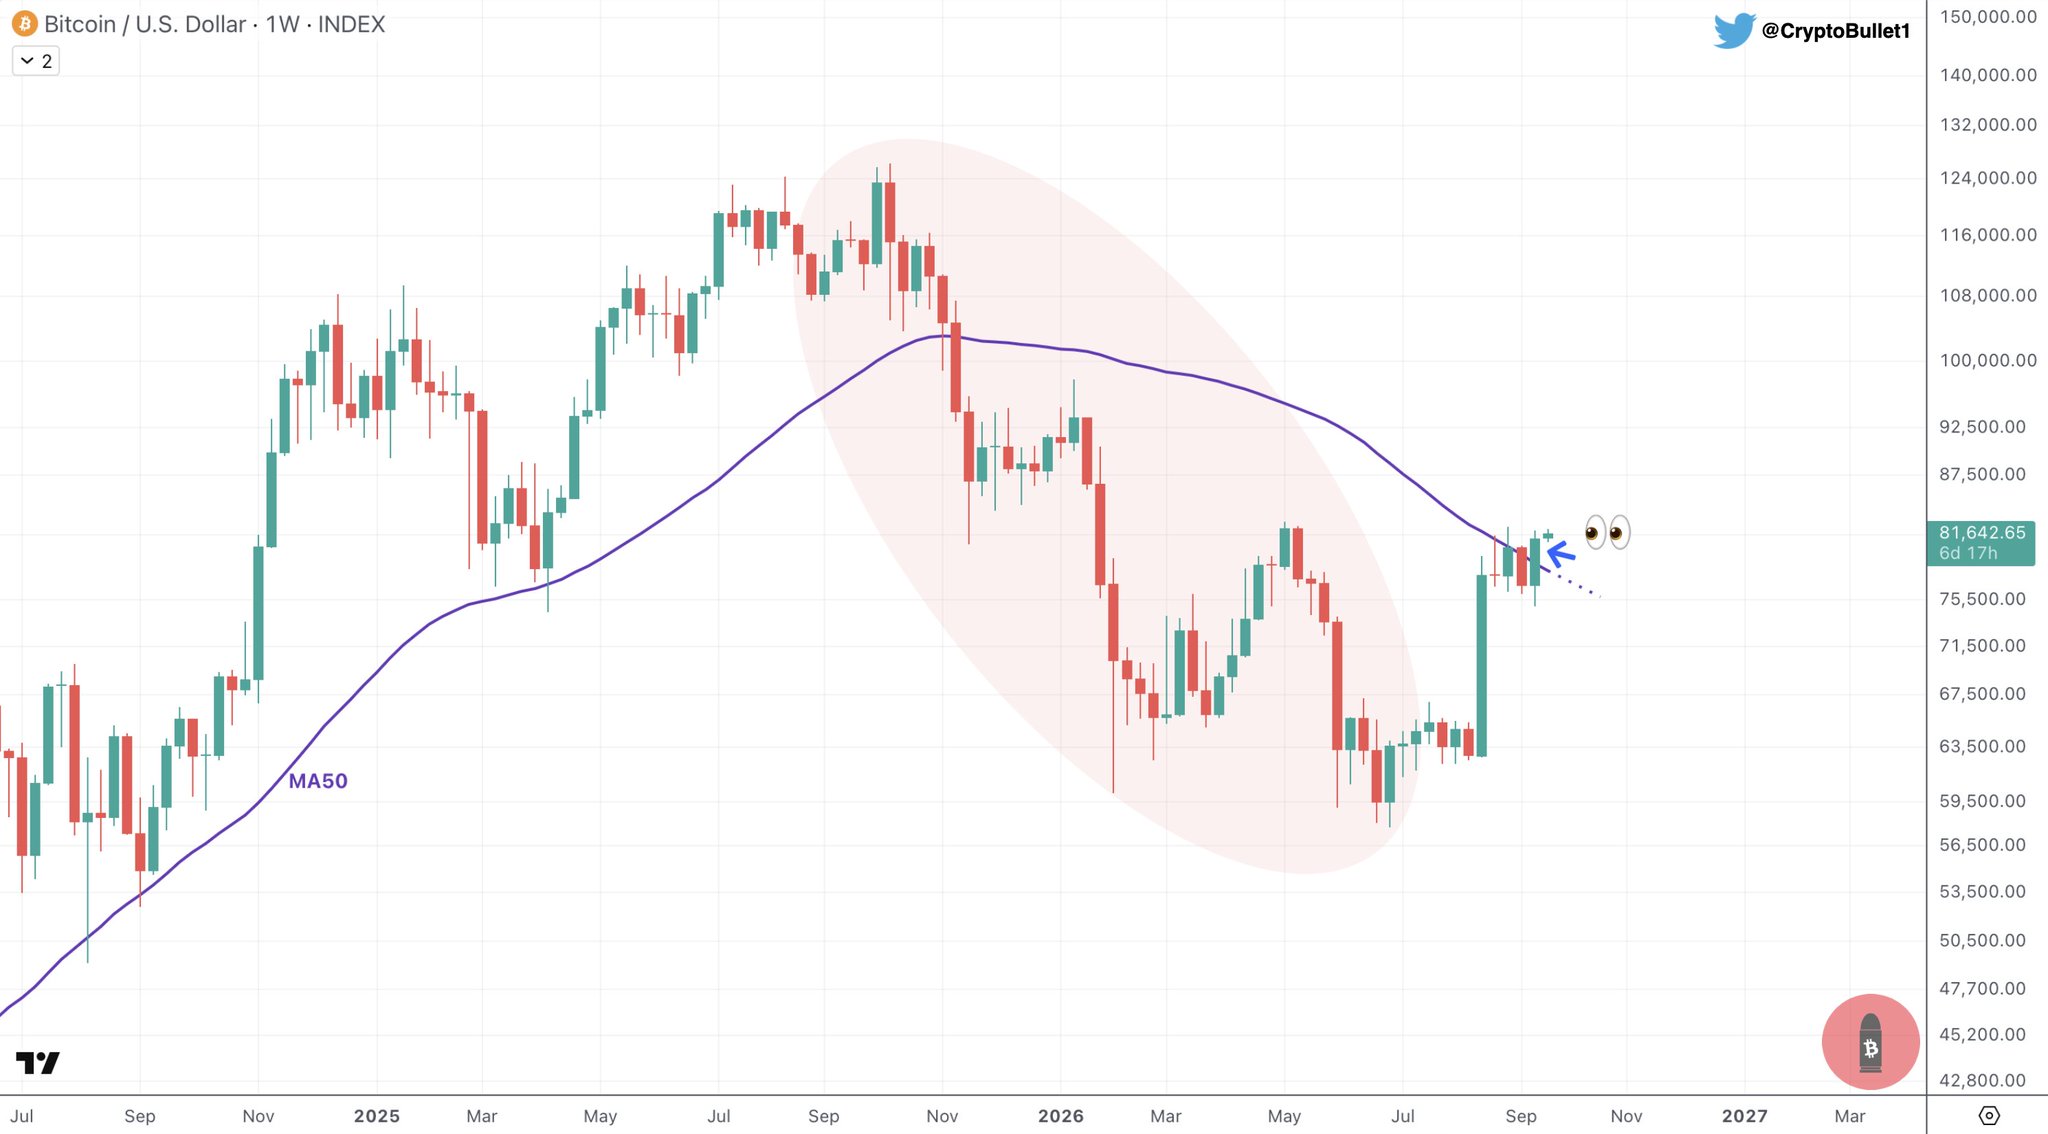
The chart identifies the bear phase explicitly with a pink shaded ellipse marking the period of price suppression below the MA50 — approximately 9 to 10 months of sustained underperformance. The directional arrow on the chart marks this week’s candle closing above the average for the first time since the bear phase began.
Signal 2 — The Three-Close Confirmation Rule
@CryptoBullet1’s explicit caution about requiring three consecutive weekly closes above the 50-Week MA is grounded in a documented pattern from prior cycles. Single-week closes above the MA50 have historically produced fakeouts — most notably in 2022, when Bitcoin briefly reclaimed its 20-Week MA in August before collapsing to a new cycle low near $15,500. The three-close rule functions as a filter against these traps by requiring sustained price discovery above the average, not a single weekly anomaly driven by short-term volatility.
The logic is mechanical: three consecutive weekly closes above a 50-period average means price has held above the mean for 21 days without being rejected. At that point, the MA itself begins to turn higher — meaning the average cost of the prior 50 weeks is rising, confirming that the market’s structural center of gravity has shifted upward. This is the difference between a retest of resistance and a reclaim of support.
At the time of writing, Bitcoin has posted one weekly close above the 50-Week MA. Two additional consecutive weekly closes — at or above the $81,000 zone — are required before the breakout is considered structurally confirmed by @CryptoBullet1’s framework.
What the 50-Week MA Reclaim Has Meant in Prior Cycles
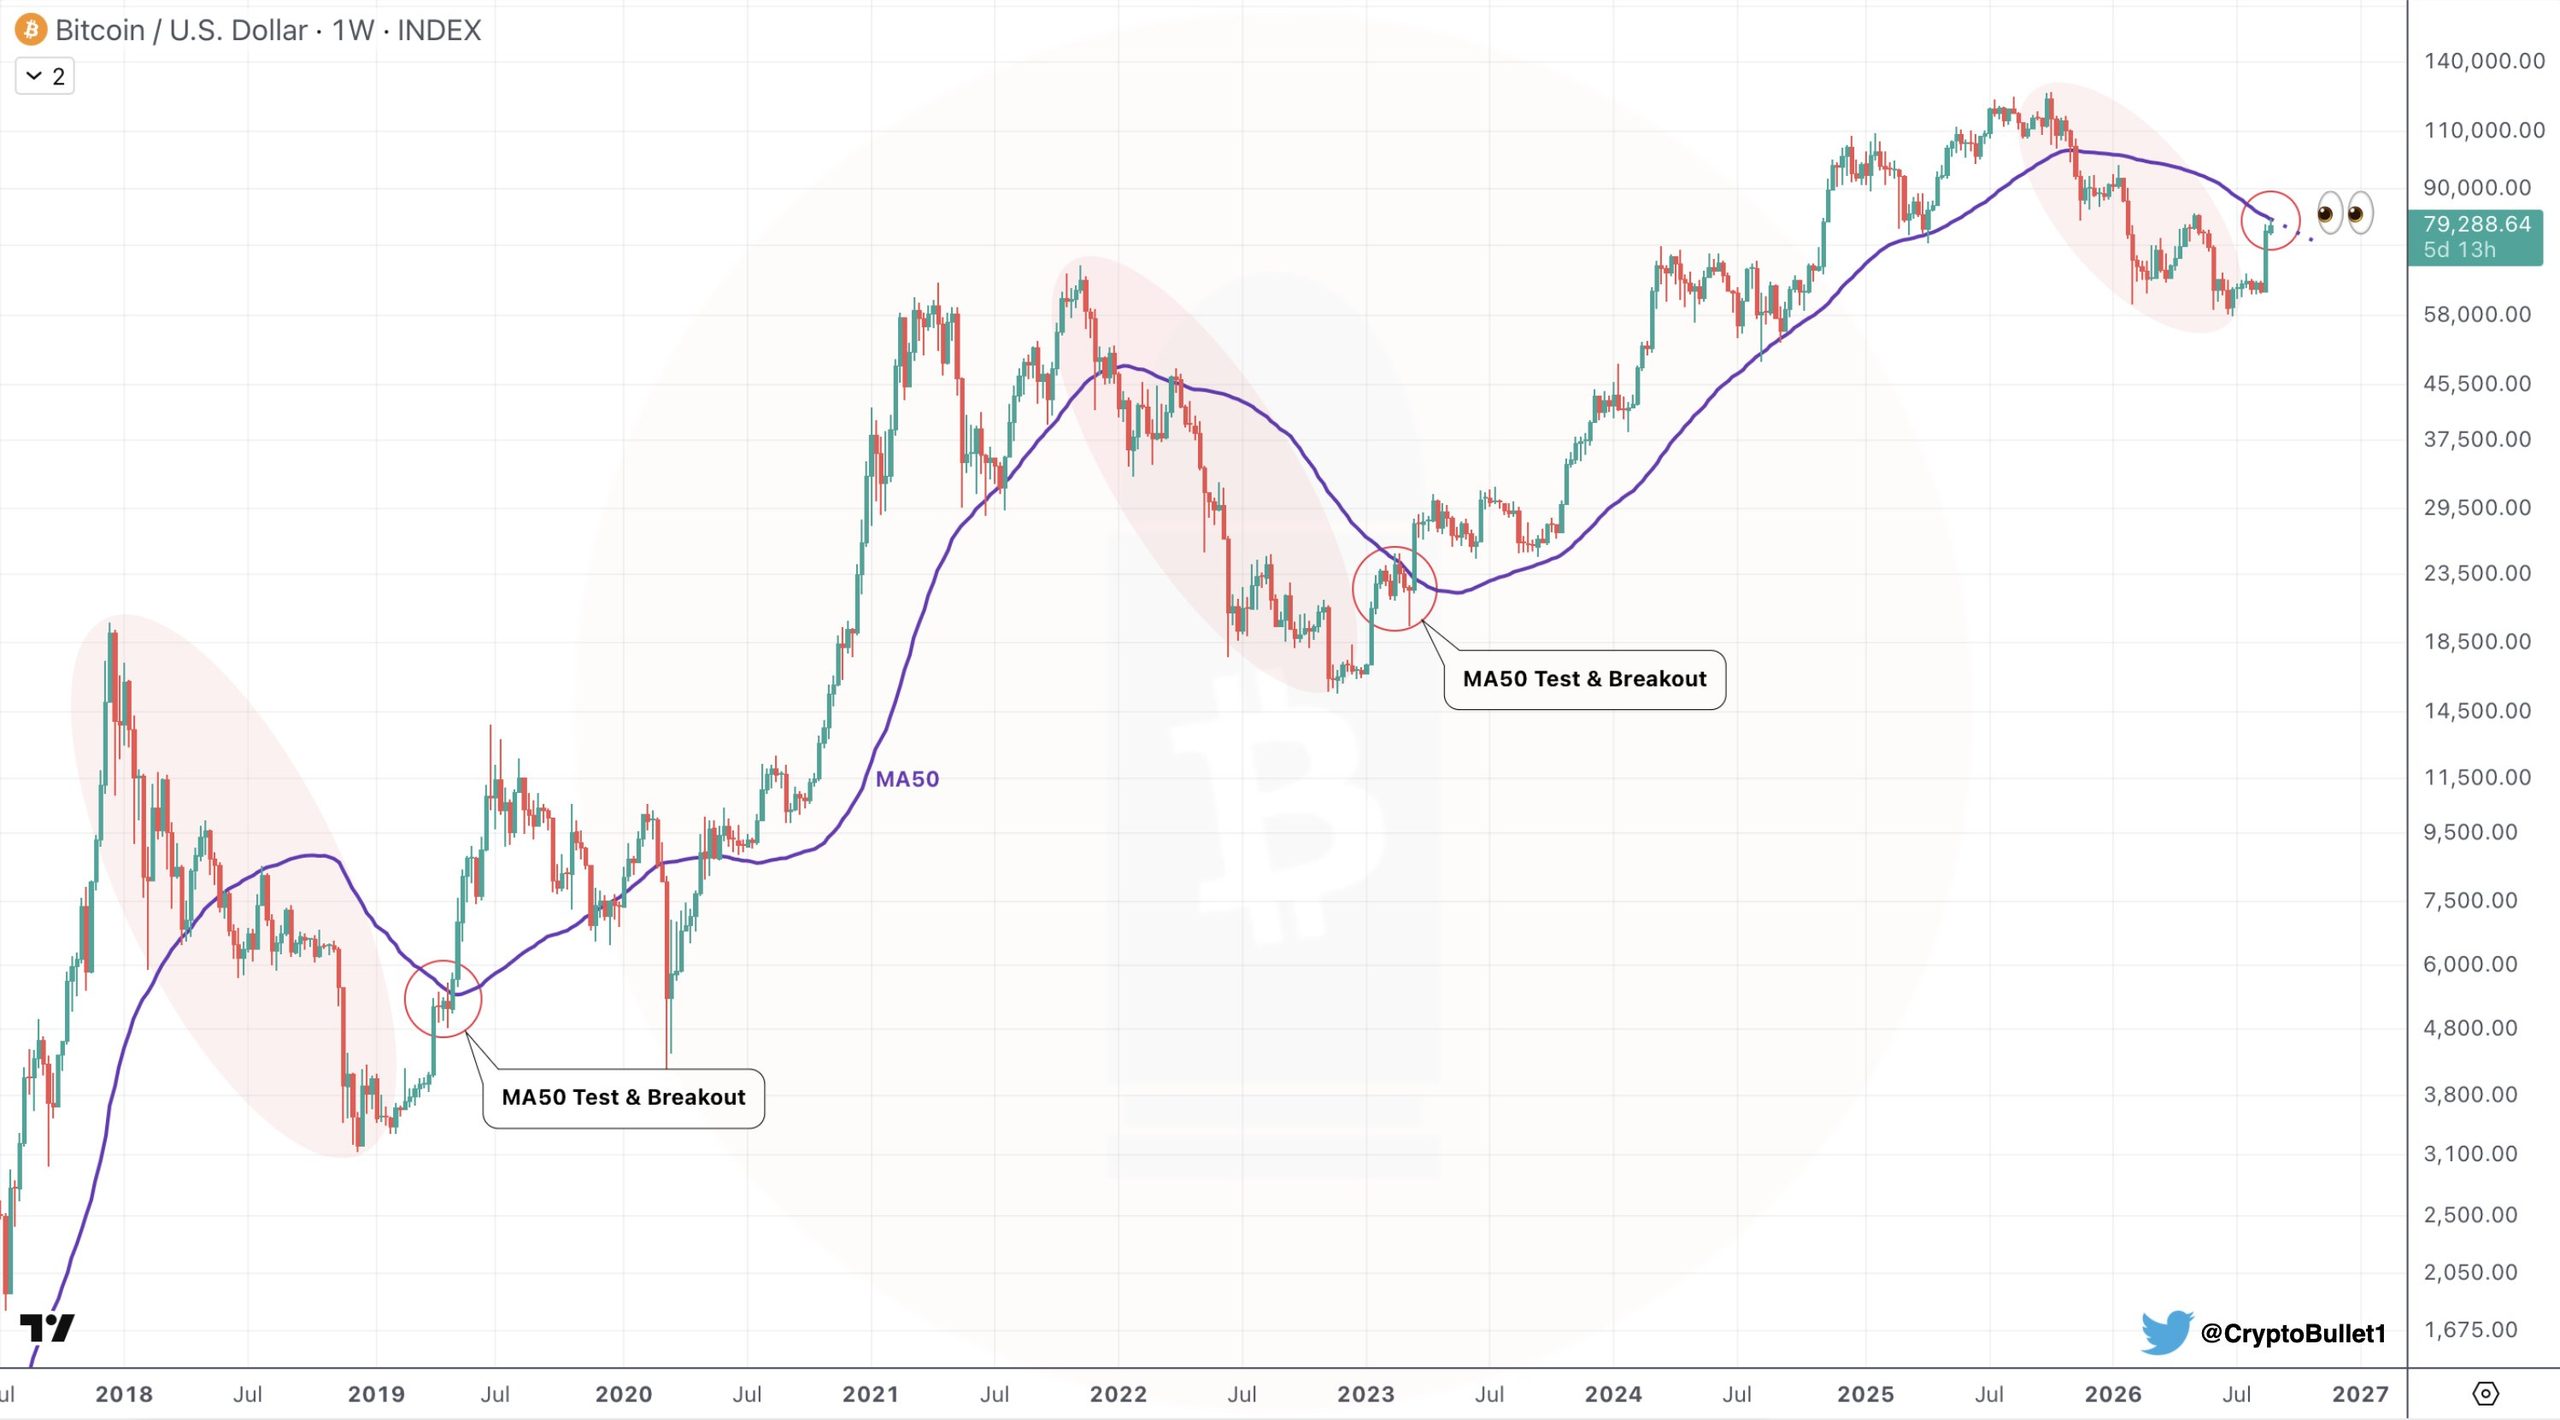
The 50-week MA is the structural line on Bitcoin’s weekly chart. The @CryptoBullet1chart marks two completed “MA50 test & breakout” events and a third test now. In 2018–2019, Bitcoin reclaimed the 50-week MA in Q2 2019 after the ~$3,200 low and rallied to the ~$13,800 high, a move of about +331%. In 2022–2023, the early-2023 reclaim after the ~$15,500 low preceded the run to ~$73,000, about +371%. That cycle later extended to the ~$126,000 ATH in October 2025. Bitcoin is now printing its first weekly close back above the 50-week MA since late 2025, after a shallower ~54% drawdown from that high.
| Cycle | 50-Week MA Reclaim | Cycle Low | Subsequent Peak | Rally from Low |
|---|---|---|---|---|
| 2018–2019 | Q2 2019 | ~$3,200 | ~$13,800 | +331% |
| 2022–2023 | Early 2023 | ~$15,500 | ~$73,000 | +371% |
| 2025–2026 | Sept 2026 (1 close) | ~$57,000–$58,500 | TBD | TBD |
What This Signal Confirms — And What It Doesn’t
The 50-Week MA reclaim confirms that Bitcoin’s weekly closing price has returned to and exceeded the 12-month mean. It confirms that the prior 9–10 months of sustained below-average price action has been interrupted on a closing basis. It confirms that short-term momentum has been sufficient to push price above a level that acted as resistance for the entirety of the bear phase.
What it does not confirm: trend reversal. A single weekly close above the 50-Week MA cannot be called a confirmed breakout — @CryptoBullet1’s own framework requires three consecutive closes. What it does not say: price cannot retrace below $81,000 next week. A fakeout close above the MA followed by a rejection is a historically documented risk, and the three-close confirmation rule exists precisely to filter that scenario.
The level to hold is clear: $81,000. That is the current 50-Week MA intersection zone. A weekly close below this level on the next candle would constitute a rejection — not a confirmed breakout. Traders using this framework should treat each of the next two weekly closes as equally important as this week’s close.
For broader context on assets showing similar macro trend shift signals, the SUI SuperTrend Flips to Buy — Macro Shift From Bearish to Bullish Begins analysis documents how sustained indicator reclaims above key averages signal structural regime change across multiple assets in the same market environment.
Bullish Scenario — Consecutive Closes Above $81,000
If Bitcoin posts two additional consecutive weekly closes above the $81,000 50-Week MA zone, the breakout is confirmed by @CryptoBullet1’s three-close framework. Based on prior cycles, a confirmed 50-Week MA reclaim has historically been followed by rallies of +331% to +371% from the cycle low. The current cycle’s low is approximately $57,000–$58,000. The prior ATH resistance zone near $124,000–$128,000 becomes the first structural target once breakout is confirmed.
Bearish Scenario — Rejection Below $81,000
A weekly close below $81,000 next week would constitute a false breakout — structurally identical to the August 2022 MA reclaim that preceded the collapse to $15,500. In that scenario, the 50-Week MA reverts to resistance, and the $57,000–$58,000 cycle low zone becomes the next structural test. This outcome would reset the count to zero and require a fresh series of three consecutive closes above $81,000 to re-establish the signal.
Bottom Line
Bitcoin has posted its first weekly close above the 50-Week Moving Average since November 2025 — a 9-to-10-month gap that defined the current bear phase from the $124,000–$128,000 ATH zone down to the $57,000–$58,000 cycle low. The MA currently intersects at approximately $81,000. In every prior Bitcoin cycle, a sustained reclaim of this average has preceded multi-month rallies of +331% or more.
But @CryptoBullet1’s framework is unambiguous: one close is not enough. Two more consecutive weekly closes above $81,000 are required before this becomes a confirmed breakout rather than a single-candle fakeout. Bitcoin is currently trading at $84,550 — above the average, for now. Watch $81,000 on the next two weekly closes as the sole determinant of whether this signal is confirmed or invalidated.
Frequently Asked Questions
What does the 50-Week MA reclaim mean for Bitcoin?
Why do three consecutive weekly closes matter for Bitcoin’s 50-Week MA breakout?
What price level must Bitcoin hold to confirm the 50-Week MA breakout?
How deep was Bitcoin’s 2025–2026 bear market before this signal?
What is Bitcoin’s first structural target if the 50-Week MA breakout is confirmed?
Source: Cryptobullet1 · Published by CoinsProbe Markets Desk
The opinions and market insights shared on CoinsProbe represent the views of individual authors based on prevailing market conditions at the time of publication. Cryptocurrency investments carry significant risk and volatility. Readers are encouraged to conduct their own research and seek professional financial advice before making investment decisions. CoinsProbe and its contributors do not accept responsibility for financial losses or decisions made based on published content.
CoinsProbe may publish sponsored articles, affiliate links, or promotional collaborations. All sponsored material is clearly labeled to maintain transparency with our audience. Our editorial decisions remain fully independent, and advertising partnerships do not influence reviews, rankings, or published opinions.
Since 2023, CoinsProbe has delivered reliable insights on cryptocurrency, blockchain, and digital assets. Our content is created by experienced researchers and analysts who follow strict editorial standards focused on accuracy, transparency, and credibility. Every article is carefully reviewed and verified using trusted sources and current market data. We provide unbiased analysis and timely updates covering everything from emerging crypto projects to major industry developments.