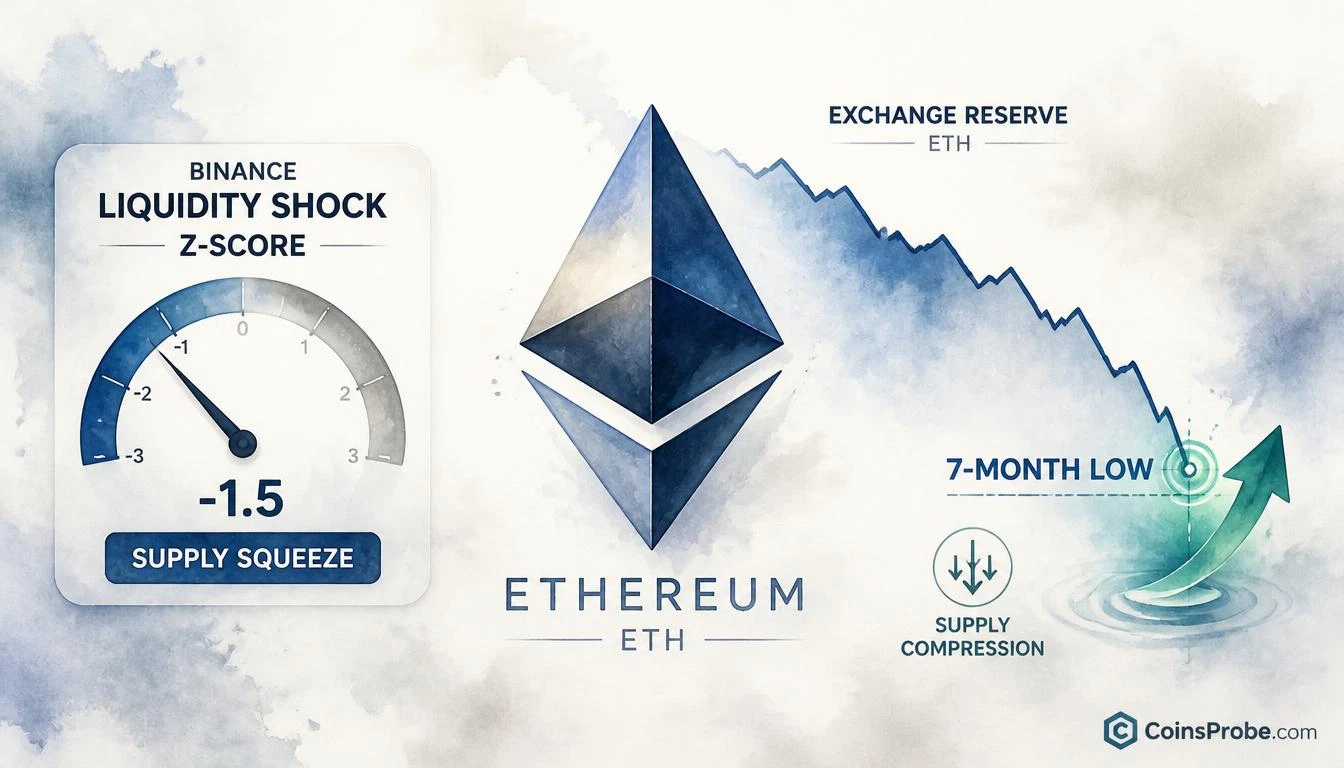
- ETH is trading at $2,553.15 (+2.20% 24h) as Binance reserves hit a 7-month statistical low per CryptoQuant
- @ArabxChain flags the Binance ETH Liquidity Shock Z-Score declining sharply toward -1.5 — a supply-side anomaly vs. the 2019–2026 baseline
- No price target is given — the signal is conditional: bullish only "if this trend continues," per @ArabxChain's exact words
- Watch the CryptoQuant Binance ETH reserve dashboard: Z-score sustained below -1.5 keeps the supply thesis intact; a rebound toward zero negates it
Ethereum is trading at $2,553.15 — up 2.20% in the past 24 hours — with a market cap of $311.9 billion. Behind that price move, a quieter but structurally significant signal is developing on-chain: ETH liquidity on Binance, the world’s largest crypto exchange by volume, has dropped to its lowest level in seven months.
The signal comes from CryptoQuant analyst @ArabxChain, writing in a CryptoQuant quicktake published on October 12, 2026. The analyst’s precise framing: “Falling reserves may indicate that some ETH is being transferred to wallets outside the exchange, potentially reducing the available supply for selling if this trend continues.” The language is conditional — @ArabxChain flags the trend and its implication, not a confirmed outcome.
The Signal — ETH Binance Liquidity Shock Z-Score at a 7-Month Low
The metric at the center of this analysis is the Ethereum Liquidity Shock Z-Score on Binance — a standardized reading of ETH reserve levels on the exchange relative to their historical distribution. A Z-score converts a raw number into a measure of how many standard deviations it sits above or below the long-run mean. When the Z-score drops sharply negative, it signals that reserves are abnormally low relative to historical norms — not just declining, but statistically anomalous.
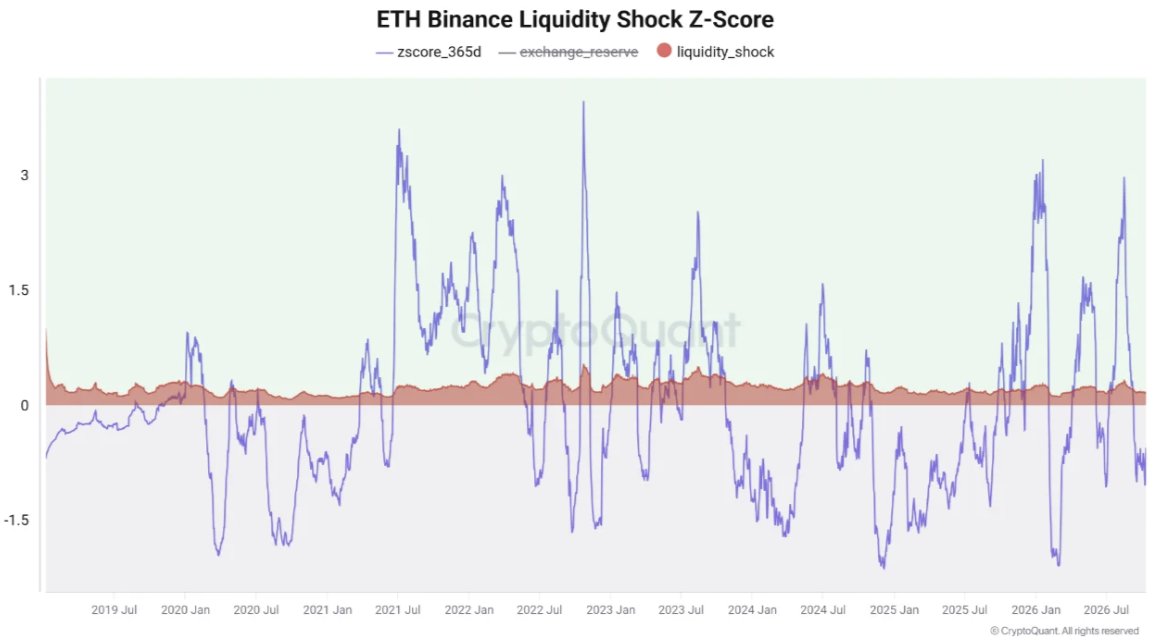
The chart, which spans approximately 2019 through mid-2026, shows the Z-score (blue line) oscillating with sharp spikes above 3 — periods when ETH flooded onto Binance — and dips below -1.5, marking phases of aggressive withdrawal. The red/brown shaded area representing the underlying reserve level remains compressed near zero across the full timeline, meaning the Z-score is doing most of the analytical work. The current reading shows the blue line making a sharp decline toward -1.5, the lower bound visible on the Y-axis, following a prior spike above 3. That spike-then-withdrawal pattern is precisely the dynamic @ArabxChain is flagging.
What a Drop in Exchange Reserves Actually Means
Exchange reserves are a supply-side metric. When ETH sits on Binance, it is immediately available to sell — it represents liquid, accessible sell pressure. When ETH is withdrawn to external wallets — cold storage, hardware wallets, DeFi protocols, staking contracts — it is removed from the immediate order book. The total ETH supply does not change. What changes is how much of that supply can reach a seller’s finger with one click.
A falling reserve level, in isolation, does not guarantee a price rally. It means one input into the supply-demand equation is tightening on the sell side. If demand remains constant or rises while sell-side liquidity contracts, the math favors upward price pressure. The qualification @ArabxChain is careful to include — “if this trend continues” — is the right framing. A one-day withdrawal spike that reverses immediately is noise. A sustained seven-month low in the Z-score reading is a structural shift worth tracking.
This matters in the context of Ethereum’s broader positioning. The asset has been navigating significant institutional interest — BlackRock’s approach toward a spot Ethereum ETF represents exactly the kind of demand-side catalyst that, combined with shrinking exchange liquidity, could compress available supply faster than the market expects.
The Liquidity Shock Framework — Why Binance Specifically
Binance is not one exchange among many in this context. It consistently accounts for the largest share of global ETH spot and derivatives volume. A Z-score measuring Binance ETH reserves is therefore a proxy for global ETH sell-side liquidity, not just one platform’s book. When Binance reserves fall to a 7-month statistical extreme, the signal has market-wide relevance.
The Z-score framework also smooths out short-term noise that distorts raw reserve numbers. Large institutional deposits and withdrawals can swing raw reserve counts significantly in a single day. The Z-score, by normalizing against the full history from 2019 onward, separates genuine structural trends from single-day anomalies. The current reading — a sharp move toward -1.5 — indicates this is not a single-day event.
What the Signal Does and Doesn’t Confirm
The CryptoQuant analysis is supply-side only. @ArabxChain makes no price target, no support level, no upside projection. The article respects that boundary. What the data confirms: ETH on Binance is statistically scarce relative to a seven-month baseline, and the Z-score trend is moving in the direction historically associated with reduced sell pressure. What the data does not confirm: that demand is sufficient to absorb any rally, that the withdrawal trend will persist, or that a specific price level will be reached. Those questions require separate demand-side metrics.
The analyst’s conditional language — “may indicate,” “potentially reducing,” “if this trend continues” — is not hedging for its own sake. It reflects that exchange reserve data is one signal in a multi-variable system. A supply reduction that coincides with weakening demand produces a different outcome than one that coincides with rising institutional inflows.
Bullish Scenario
If ETH Binance reserves continue declining — the Z-score sustaining below -1.5 — and on-chain demand indicators (net exchange flows, active addresses, staking inflows) show concurrent strength, the supply-demand imbalance becomes self-reinforcing. Reduced sell-side liquidity means larger price impact per unit of buy pressure, amplifying any demand-driven move from the current $2,553.15.
Bearish Scenario
If ETH reserve levels on Binance recover — the Z-score reverting toward zero or above — the supply-side signal dissipates. A reversal in the withdrawal trend, particularly if accompanied by large exchange inflows from whale wallets tracked by Lookonchain or Arkham, would neutralize the current reading and return sell-side liquidity to normal levels.
The Level Traders Are Watching
@ArabxChain does not specify a price trigger in this note. The signal is structural, not technical. What the market is watching is the persistence of the withdrawal trend itself — tracked in real time through CryptoQuant’s Binance reserve dashboard. If the 7-month low deepens, the supply-side thesis strengthens. If reserves recover sharply, it fades. The CryptoQuant data will answer that question before price does.
Ethereum at $2,553.15 is trading into a supply environment that is statistically thinner than at any point in the past seven months on Binance. @ArabxChain’s analysis does not predict what price does next — it maps the input. Whether that input produces a sustained supply shock depends on what demand-side data prints alongside it. Watch the Binance ETH reserve Z-score: a continued decline toward and below -1.5 keeps the supply-side thesis intact. A rebound toward zero negates it.
Source: x.comFrequently Asked Questions
What is the Ethereum Liquidity Shock Z-Score on Binance?
Does falling ETH on Binance automatically mean the price will rise?
How do I track whether the ETH Binance reserve withdrawal trend is continuing?
What price target did @ArabxChain give alongside this supply signal?
Source: CryptoQuant · Published by CoinsProbe Markets Desk
The opinions and market insights shared on CoinsProbe represent the views of individual authors based on prevailing market conditions at the time of publication. Cryptocurrency investments carry significant risk and volatility. Readers are encouraged to conduct their own research and seek professional financial advice before making investment decisions. CoinsProbe and its contributors do not accept responsibility for financial losses or decisions made based on published content.
CoinsProbe may publish sponsored articles, affiliate links, or promotional collaborations. All sponsored material is clearly labeled to maintain transparency with our audience. Our editorial decisions remain fully independent, and advertising partnerships do not influence reviews, rankings, or published opinions.
Since 2023, CoinsProbe has delivered reliable insights on cryptocurrency, blockchain, and digital assets. Our content is created by experienced researchers and analysts who follow strict editorial standards focused on accuracy, transparency, and credibility. Every article is carefully reviewed and verified using trusted sources and current market data. We provide unbiased analysis and timely updates covering everything from emerging crypto projects to major industry developments.