
- Bitcoin trades at $83,578 (+0.74% 24h) as CryptoQuant flags three converging bottom signals in October 2026
- Exchange reserves hit cycle lows near 2.67M BTC while apparent demand recovers from a −300,000 BTC 30-day trough
- Analyst @xwinfinance: confirmation requires sustained ETF inflows, stronger U.S. spot buying, and continued demand recovery — none yet confirmed
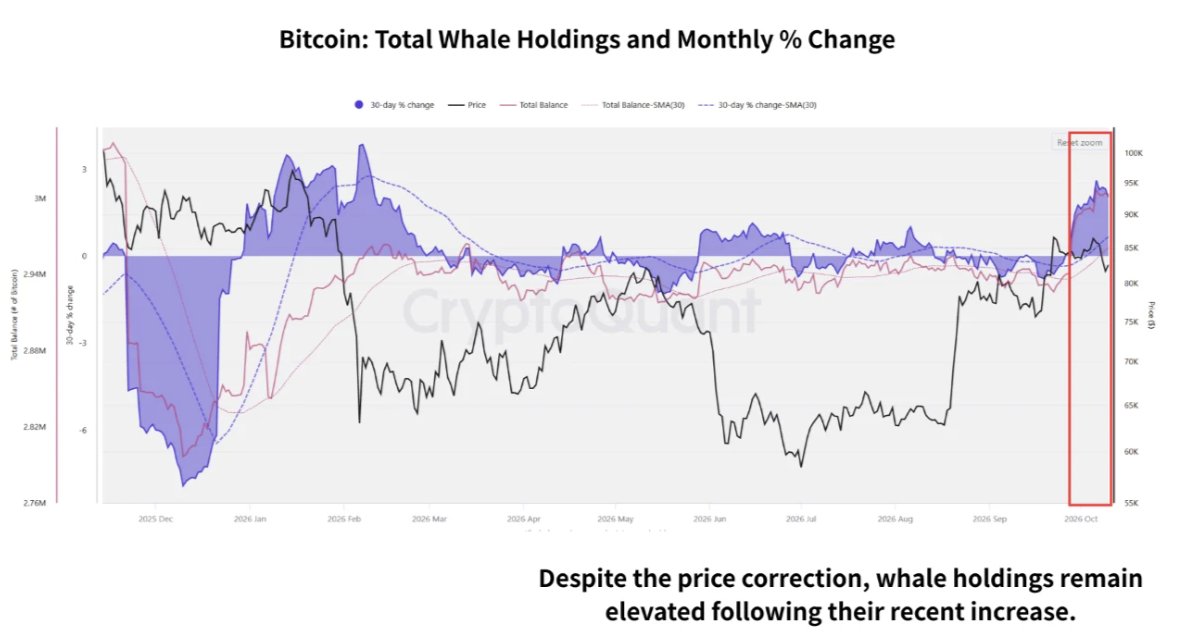
- Whale 30-day balance change shows an October uptick despite the broader price correction from 2025 highs
Bitcoin is trading at $83,578 — up 0.74% in the past 24 hours — with a market capitalization of approximately $1.68 trillion, as on-chain data begins assembling a case that October 2026 may mark a cyclical floor. Three separate CryptoQuant metrics — exchange reserves, apparent demand, and whale holdings — are each registering conditions the platform associates with prior market bottoms.
CryptoQuant contributor @xwinfinance, writing via the official @cryptoquant_com channel on October 12, 2026, frames the setup directly: “These developments suggest conditions for a bottom are improving. Confirmation requires sustained ETF inflows, stronger U.S. spot buying and continued demand recovery.” The note is deliberately conditional — not a call that the bottom is in, but a structured argument that the necessary preconditions are accumulating ahead of the U.S. midterm elections.
Signal 1 — Exchange Reserves Drop to Cycle Lows
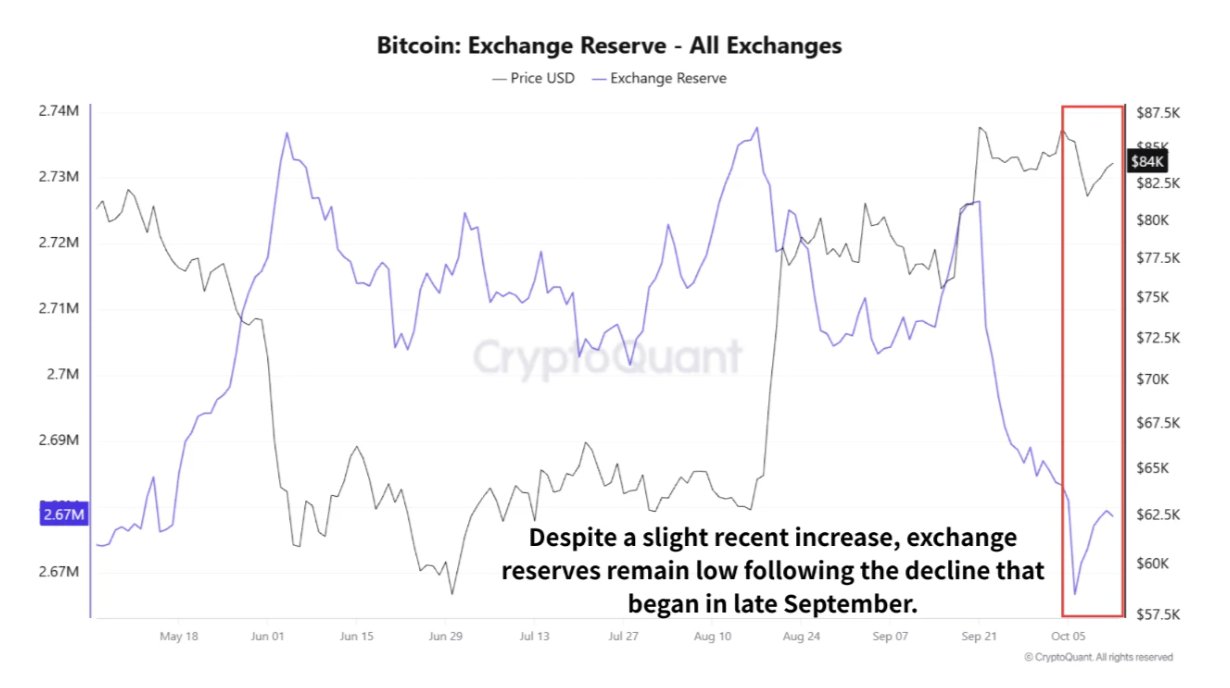
The first chart from @xwinfinance tracks Bitcoin exchange reserves against spot price across roughly May 2024 through early October 2026. The left axis of the chart shows reserves moving from approximately 2.74 million BTC down to a labeled low of 2.67 million BTC — a reading that appears twice on the axis, marking the floor. The right axis shows price ranging between $57,500 and $87,500 during the same window, with a current price tag on the chart of $84,000 (chart annotation; live price at time of writing is $83,578).
The analyst highlights a red-boxed October 2026 region where exchange reserves fell sharply following a late-September decline. Despite a minor uptick in reserves after that low, they remain at cycle lows. The structural interpretation: coins leaving exchanges reduce the immediately available sell-side supply. When that withdrawal happens at depressed prices, it typically signals holders removing BTC from sale — an accumulation behavior rather than distribution.
Signal 2 — Apparent Demand Recovers From Deeply Negative Territory
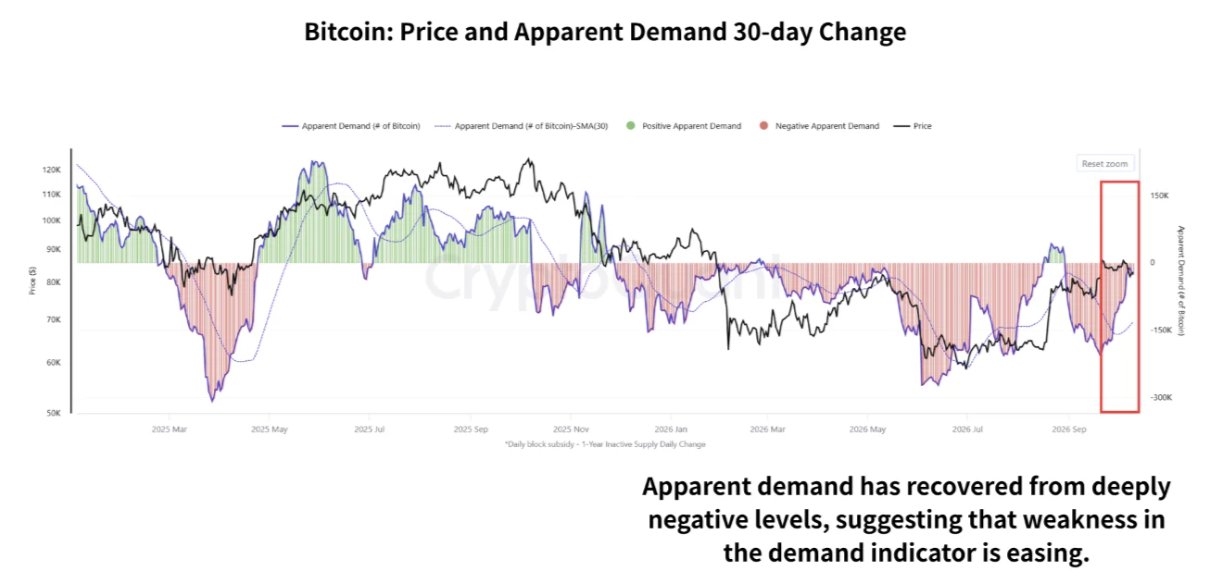
The second chart covers Bitcoin apparent demand — specifically the 30-day change — from approximately March 2025 through September 2026. During the sharpest phase of Bitcoin’s correction, the demand metric dropped into deeply negative territory, with the right axis of the chart showing readings as low as −300,000 BTC on the 30-day rolling basis. Price in the same window troughed in the $50,000–$60,000 range before recovering toward the current level.
The red-boxed recent period on this chart shows the apparent demand reading has recovered sharply upward — moving back toward the zero line from those extreme negative readings. The analyst flags this recovery as a key part of the improving bottom thesis. However, the stated confirmation condition is explicit: the recovery must be accompanied by sustained ETF inflows and stronger U.S. spot buying. Neither condition is listed as confirmed in the note — they are the forward tests that would validate the signal. Readers following Bitcoin’s broader on-chain structure will recognize apparent demand recovery as one of several metrics that have historically led price reversals.
Signal 3 — Whale Holdings Stabilize in October
The third chart narrows the timeframe to November 2025 through October 2026, overlaying Bitcoin price against whale total balance and the 30-day percentage change in that balance. The whale total balance axis runs from approximately 2.76 million BTC to 3.00 million BTC. The 30-day percentage change axis runs from −6 to +3.
Price on this chart declined sharply from late 2025 highs toward a mid-2026 trough before partially recovering toward the $80,000–$85,000 range. Whale total balance trended relatively flat through the decline and has stabilized. The blue shaded area representing the 30-day percentage change in whale holdings shows a large negative dip earlier in the cycle, then oscillated near zero — with the red-boxed October 2026 region showing a recent uptick. The analyst’s interpretation: despite the price correction, whale-tier holders have not reduced exposure in October — and the marginal uptick in 30-day balance change suggests early accumulation. This behavior pattern mirrors what previous analyses of Bitcoin’s fractal structures have identified at comparable price levels.
The Midterm Context — Why October Timing Matters
The analyst’s note explicitly connects the timing to U.S. midterm elections. This is not a technical overlay — it is a macro-political framing. Historically, the months surrounding U.S. midterms have coincided with shifts in institutional risk appetite, fiscal policy signaling, and equity market volatility. Bitcoin, increasingly correlated with institutional risk assets, has shown sensitivity to these windows.
The note does not provide a specific price level tied to the midterm catalyst, nor does it quantify the magnitude of any expected move. The midterm reference functions as a timing anchor — not a price trigger. Readers should treat it as context for why this particular October is receiving analytical attention, not as a standalone trading rationale.
What Confirmation Actually Requires
@xwinfinance is precise about what the bottom thesis still needs. Three conditions must converge:
- Sustained ETF inflows — not a single-day spike, but a durable multi-day or multi-week inflow pattern into U.S. spot Bitcoin ETFs
- Stronger U.S. spot buying — a recovery in Coinbase Premium or equivalent U.S.-centric spot demand data
- Continued demand recovery — the apparent demand metric must sustain its move back toward and through the zero line, not stall at it
None of these are described as confirmed in the October 12 note. The analyst is identifying improving conditions, not a completed bottom. That distinction is the analytical core of this note — and it matters for how the data should be interpreted. For broader context on how long-term holder metrics are behaving alongside these signals, the LTH MVRV analysis provides additional structural framing.
Bullish Scenario
If ETF inflows sustain over multiple days, U.S. spot buying strengthens as reflected in Coinbase Premium data, and apparent demand continues recovering through the zero line, the three-signal convergence identified by @xwinfinance would be confirmed. Exchange reserves at cycle lows would then represent a structurally reduced sell-side float at a point of renewed demand — a setup historically associated with price acceleration.
Bearish Scenario
If ETF inflows reverse, apparent demand stalls near the zero line without crossing it, or whale balance percentages roll back negative in the 30-day window, the improving conditions described in the note would fail to convert into confirmation. A demand recovery that stalls without ETF and spot buying support has historically resolved lower before eventually finding a genuine floor.
Three independent CryptoQuant metrics — exchange reserves at cycle lows near 2.67 million BTC, apparent demand recovering from a −300,000 BTC 30-day trough, and whale holdings stabilizing in October 2026 — are collectively signaling what @xwinfinance describes as improving conditions for a bottom. The analyst’s conclusion is conditional, not declarative. Watch for sustained ETF inflows, stronger U.S. spot buying, and continued apparent demand recovery as the three specific data points that would convert this setup from a probability into a confirmation.
Source: x.comFrequently Asked Questions
What does ‘apparent demand’ mean in Bitcoin on-chain analysis?
Why are Bitcoin exchange reserves at cycle lows considered a bullish signal?
Has CryptoQuant confirmed that Bitcoin’s October 2026 bottom is already in?
What is the connection between U.S. midterm elections and Bitcoin price cycles?
Source: CryptoQuant · Published by CoinsProbe Markets Desk
The opinions and market insights shared on CoinsProbe represent the views of individual authors based on prevailing market conditions at the time of publication. Cryptocurrency investments carry significant risk and volatility. Readers are encouraged to conduct their own research and seek professional financial advice before making investment decisions. CoinsProbe and its contributors do not accept responsibility for financial losses or decisions made based on published content.
CoinsProbe may publish sponsored articles, affiliate links, or promotional collaborations. All sponsored material is clearly labeled to maintain transparency with our audience. Our editorial decisions remain fully independent, and advertising partnerships do not influence reviews, rankings, or published opinions.
Since 2023, CoinsProbe has delivered reliable insights on cryptocurrency, blockchain, and digital assets. Our content is created by experienced researchers and analysts who follow strict editorial standards focused on accuracy, transparency, and credibility. Every article is carefully reviewed and verified using trusted sources and current market data. We provide unbiased analysis and timely updates covering everything from emerging crypto projects to major industry developments.