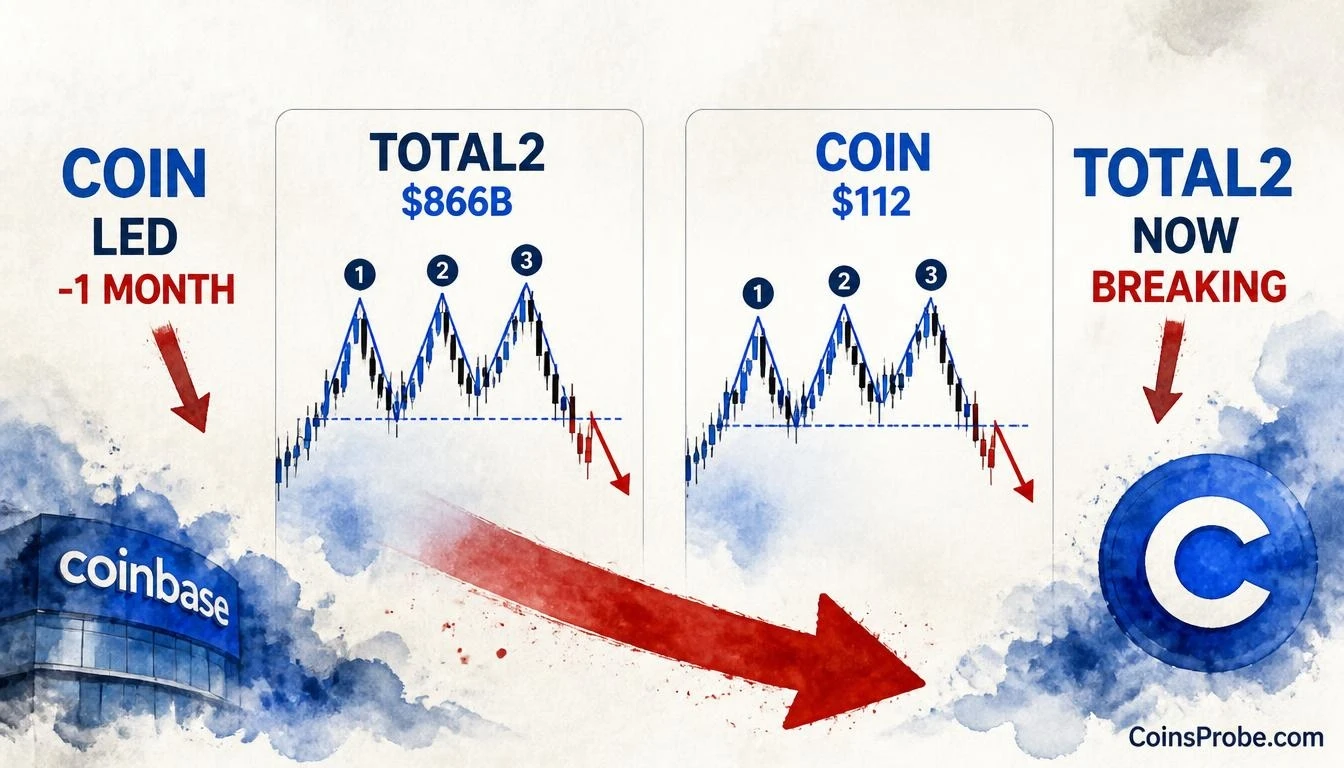
- TOTAL2 sits at $866.12B — breaking the same horizontal support that Coinbase broke one month ago
- An analyst flags an identical three-peak topping structure on both TOTAL2 (monthly) and COIN ($112.03), with COIN leading the breakdown by ~1 month
- No analyst-stated downside target — watch $866B support and COIN price action for directional confirmation
The altcoin market cap is flashing a structural warning that one analyst says is impossible to ignore. TOTAL2 — which measures total crypto market capitalization excluding Bitcoin — is currently trading at $866.12 billion, mirroring the exact same three-peak topping pattern that preceded Coinbase’s breakdown roughly one month ago.
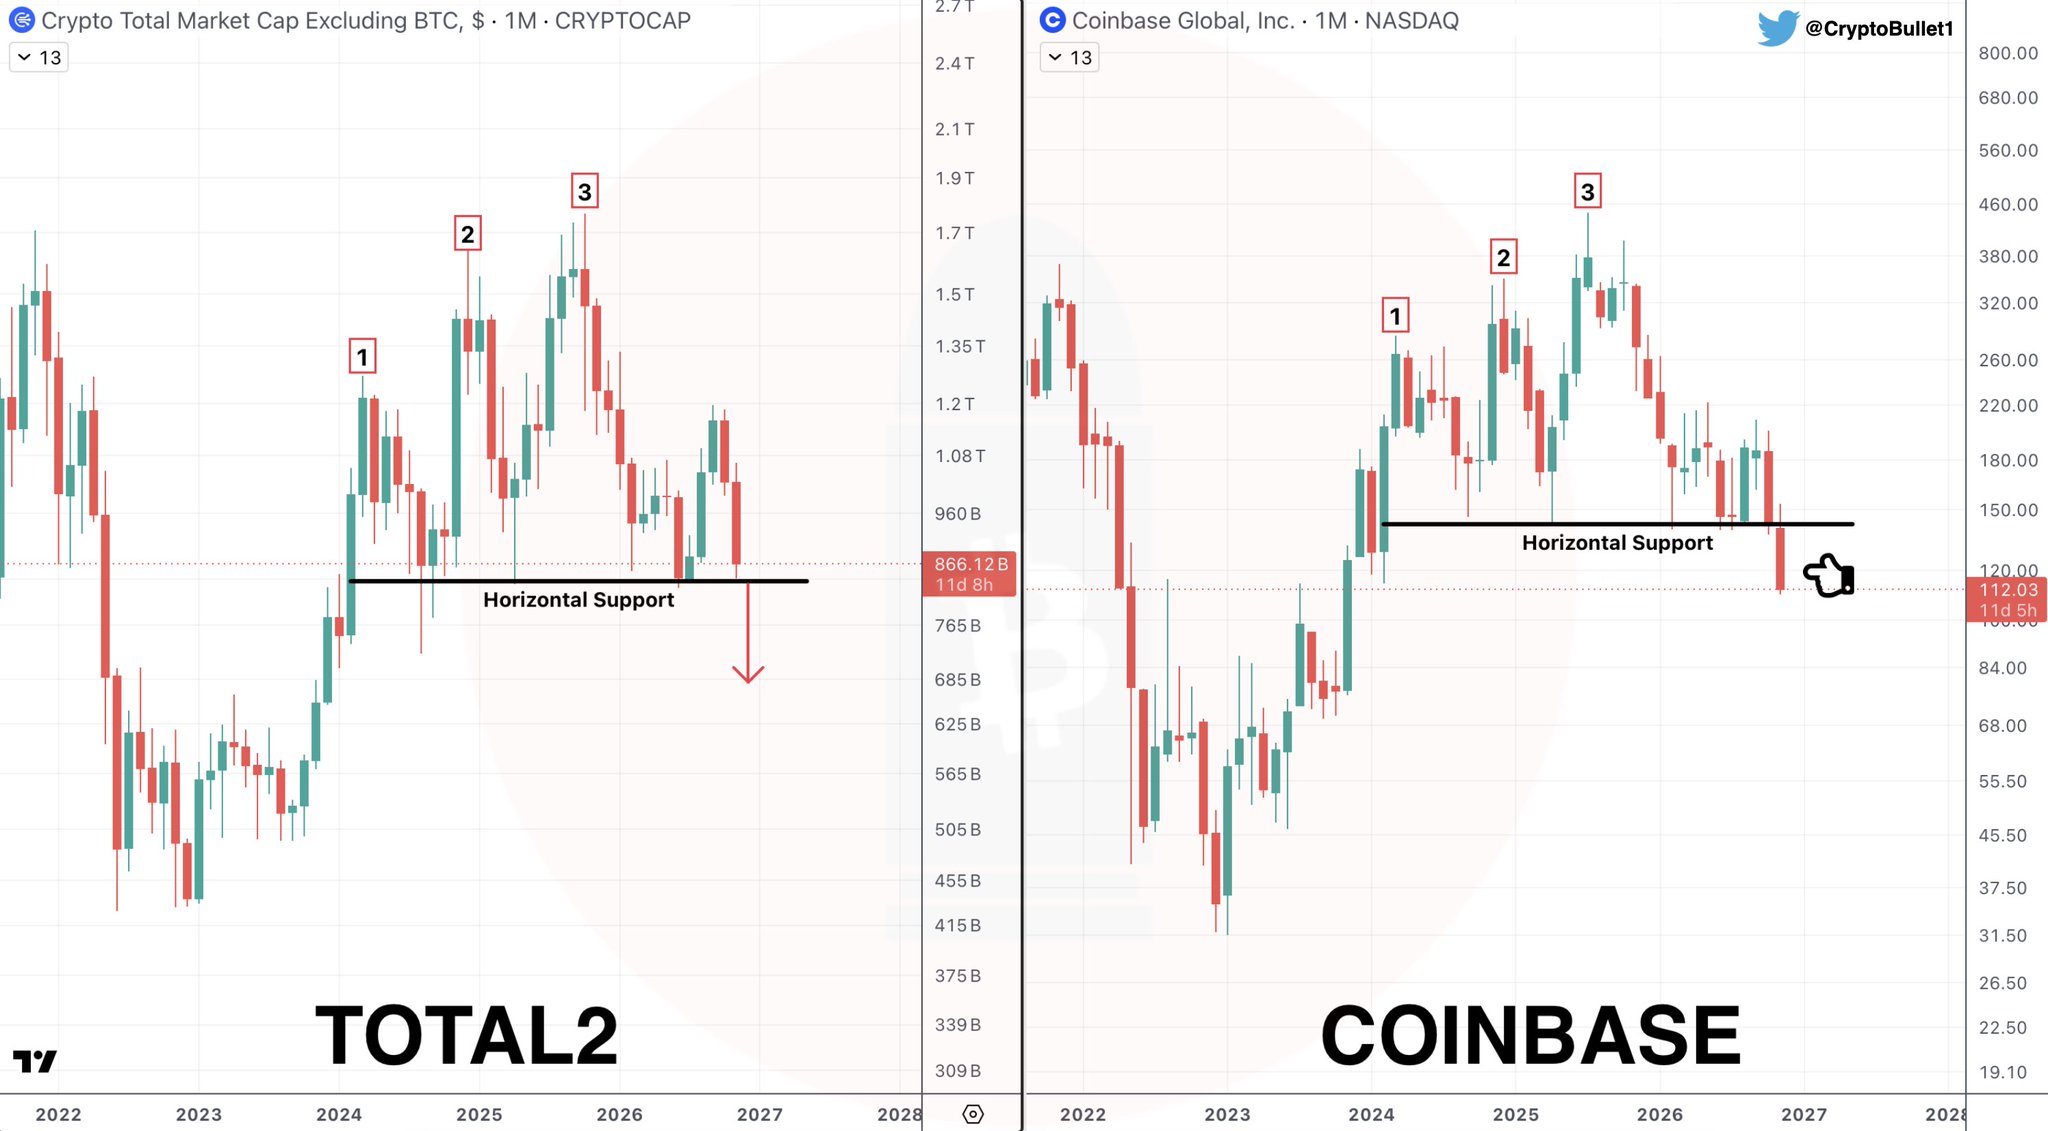
An analyst who goes by the handle @CryptoBullet1 on X posted the comparison on November 19, 2026, writing: “TOTAL2 is as cooked as $COIN was a month ago. The same pattern, $COIN is just leading.” The chart places both assets side-by-side on a monthly timeframe, showing an identical three-peak topping formation followed by a breakdown below horizontal support — with Coinbase having already confirmed the break while TOTAL2 is now replicating it in real time.
The Pattern — Three Peaks, One Break, and a Leading Indicator
What makes this comparison structurally significant is not just visual similarity — it is sequence. Coinbase stock broke its equivalent horizontal support level approximately one month before TOTAL2 reached the same inflection point. The analyst’s thesis is that COIN functioned as a leading indicator for broader altcoin market cap performance, completing its topping structure first and now being confirmed by TOTAL2 beginning the same breakdown.
On the monthly chart, both TOTAL2 and COIN show three distinct peaks — labeled 1, 2, and 3 — forming a topping structure that resolved with a bearish break below a horizontal support line. COIN’s current price is $112.03 on the monthly chart, already trading below its support. TOTAL2, sitting at $866.12 billion, is now breaking the equivalent support level that COIN cleared a month ago. The analyst’s annotation includes a bearish arrow pointing downward on both charts, reinforcing the directional conclusion.
Why COIN as a Leading Indicator Has Historical Logic
Coinbase’s business is structurally linked to altcoin trading volume. When retail and institutional participants reduce exposure to non-Bitcoin assets, Coinbase revenue contracts first — before the aggregate market cap metrics reflect the same sentiment. This is why COIN breaking down ahead of TOTAL2 is mechanically coherent, not coincidental. The stock market priced in reduced altcoin activity before on-chain and aggregated data caught up.
That dynamic is now inverting: TOTAL2 is confirming what COIN already priced in. The lag between COIN’s breakdown and TOTAL2’s current break is consistent with the sequencing the analyst identifies — roughly one month of price discovery in the equity market before the altcoin aggregate followed suit.
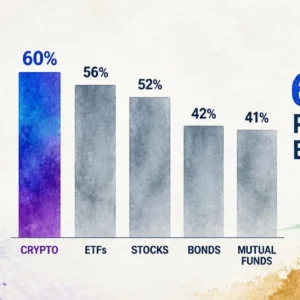
It is worth placing this in the context of broader investor behavior. Recent survey data showed 60% of crypto investors planned to buy more, topping every asset class in sentiment — a reading that now appears to have preceded rather than supported the current structural deterioration in TOTAL2.
The Current TOTAL2 Reading — $866.12 Billion at Support
TOTAL2 at $866.12 billion places the altcoin market cap at what the chart identifies as the broken support level — the same relative position COIN was in before accelerating lower. The monthly chart axis shows the next visible reference levels descending through $765 billion and $685 billion. These are chart display values, not analyst-stated targets. The analyst has not published explicit downside price targets for TOTAL2 — the note identifies the pattern and the leading relationship, not a measured move.
What is explicit in the analysis: the break is happening now, COIN led it by approximately one month, and the structural pattern across both charts is described as identical. That is the complete stated claim — no more, no less.
What This Means for Altcoin Exposure
TOTAL2 is the broadest measure of altcoin market health. It captures everything outside of Bitcoin — Ethereum, Solana, XRP, and thousands of smaller tokens. A sustained break below its horizontal support on the monthly timeframe is not a minor technical event. Monthly timeframe signals are slow to form and slow to resolve, but when they confirm, they reflect structural positioning shifts — not short-term volatility.
The analyst’s framing — “as cooked as COIN was” — is deliberately direct. Coinbase spent the month following its breakdown declining further before stabilizing. If the leading indicator relationship holds, TOTAL2 may be entering a similar phase. Investors with significant altcoin exposure watching the broader equity-to-crypto risk relationship should note that the equity signal in COIN arrived first and confirmed in advance.
What to Watch
The analyst has not stated a specific recovery level that would invalidate the bearish structure, nor a downside target. The variables to track are straightforward: whether TOTAL2 reclaims its broken horizontal support on a monthly closing basis, and whether COIN stabilizes or continues declining — since COIN has functioned as the forward-looking signal throughout this sequence. A COIN recovery ahead of TOTAL2 stabilization would be the first evidence that the leading indicator relationship is shifting toward a potential bottom, not a continuation.
Until then, the pattern the analyst identifies is active, the break on TOTAL2 is in progress at $866.12 billion, and COIN at $112.03 remains the chart to watch for the next directional signal in altcoin market cap. Those monitoring altcoin sentiment more broadly may note that individual altcoins are reaching historically significant levels — but the aggregate TOTAL2 breakdown suggests the macro structure for the asset class remains under pressure.
Frequently Asked Questions
What is TOTAL2 and why does it matter for altcoin investors?
Why is Coinbase stock considered a leading indicator for TOTAL2?
Has the analyst stated a downside price target for TOTAL2?
What would signal that the bearish TOTAL2 structure is invalidated?
Source: Cryptobullet1 · Published by CoinsProbe Markets Desk
The opinions and market insights shared on CoinsProbe represent the views of individual authors based on prevailing market conditions at the time of publication. Cryptocurrency investments carry significant risk and volatility. Readers are encouraged to conduct their own research and seek professional financial advice before making investment decisions. CoinsProbe and its contributors do not accept responsibility for financial losses or decisions made based on published content.
CoinsProbe may publish sponsored articles, affiliate links, or promotional collaborations. All sponsored material is clearly labeled to maintain transparency with our audience. Our editorial decisions remain fully independent, and advertising partnerships do not influence reviews, rankings, or published opinions.
Since 2023, CoinsProbe has delivered reliable insights on cryptocurrency, blockchain, and digital assets. Our content is created by experienced researchers and analysts who follow strict editorial standards focused on accuracy, transparency, and credibility. Every article is carefully reviewed and verified using trusted sources and current market data. We provide unbiased analysis and timely updates covering everything from emerging crypto projects to major industry developments.