
- SUI trades at $1.01 — up 22.12% in 24 hours — pressing against the $1.03 weekly channel midline
- Analyst Ali Martinez (@alicharts) flags $1.03 as immediate resistance; break opens $1.40 upper channel boundary
- Rejection at $1.03 risks pullback to $0.84 support; loss of $0.65 invalidates the full channel structure
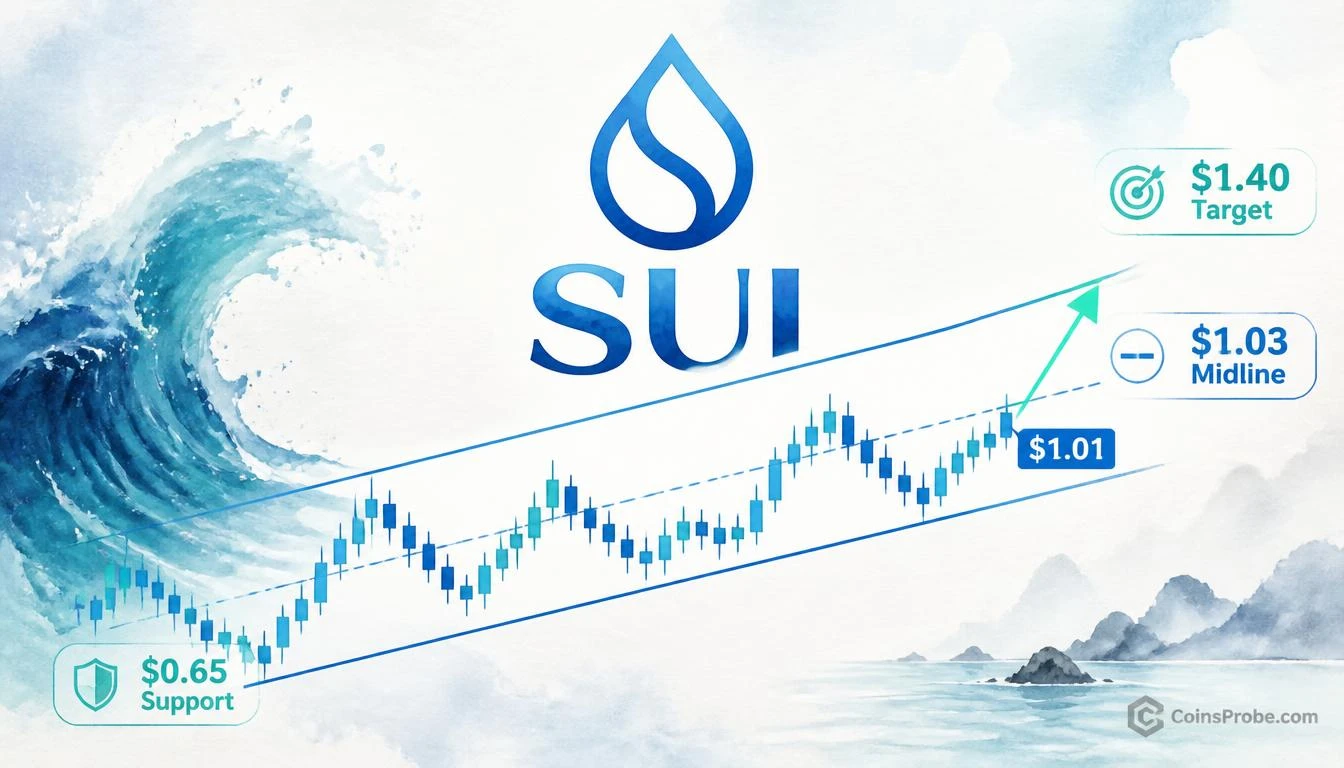
- Weekly parallel channel intact since May 2024 with lower boundary at $0.65 and upper target at $1.40
SUI is trading at approximately $1.01 — up 22.12% in 24 hours — with a market capitalization of $4.12 billion. After spending months consolidating between $0.65 and $1.40, price is now pressing directly against the level that determines whether this recovery becomes a breakout or a reversal.
That level is $1.03 — the midline of a weekly parallel channel that crypto analyst Ali Martinez (@alicharts) has flagged as the critical immediate resistance. In his own words: “The channel’s mid-range near $1.03 is the immediate upside target. A break above it would put the upper boundary near $1.40 in focus.” The channel has been intact since May 2024 — making this week’s test of the midline one of the more structurally significant moments SUI has faced in this cycle.
The Parallel Channel — What It Is and Why It Matters
A parallel channel is a ranging structure defined by two equidistant trendlines — an upper boundary acting as resistance and a lower boundary acting as support — with a midline bisecting the range. The midline is not arbitrary: in ranging markets, it frequently acts as a magnet during recoveries and as a rejection zone that sends price back toward the lower boundary.
On SUI’s weekly chart, the channel boundaries are well-defined:
| Level | Role | Status |
|---|---|---|
| $0.65 | Lower channel boundary / hard support | Held in base formation |
| $0.84 | Mid-lower support zone | Acted as base before current recovery |
| $1.03 | Channel midline / immediate resistance | Current test — price at $1.01 |
| $1.21 | Secondary resistance | First target above midline |
| $1.40 | Upper channel boundary | Full measured move target |
Key levels within the weekly parallel channel | Source: @alicharts (X)
Price recovered from the $0.65–$0.84 base zone across September and October, with recent weekly candles showing a clear directional shift. At $1.01, SUI sits less than 2% below the $1.03 midline — meaning the current 24-hour surge has brought price to the exact decision point Martinez identified.
The Chart — Midline Test in Real Time
The weekly chart shared by @alicharts shows SUI’s full parallel channel structure from May 2024 onward. The lower boundary at $0.65 provided a clean base. Recent September and October candles demonstrate recovering bullish momentum from the $0.65–$0.84 zone — and price is now approaching the $1.03 midline with momentum. Annotated arrows on the chart highlight $1.03 and $1.40 as the two resistance levels traders must watch for confirmation of continuation. Martinez notes that a weekly close above $1.03 is the trigger that brings $1.40 into focus as the upper boundary target.
[CHART_HERE]This channel structure is consistent with a broader SUI recovery thesis. As we detailed in SUI Three Technical Signals Align — $0.98 Is the Confirmation Level, SUI had been building a technical base with multiple signals converging near that confirmation zone. Price has since cleared $0.98 and is now testing the next structural level.
Signal — $1.03 Midline: What a Break Means
The midline of a parallel channel is the most important internal level in a ranging structure. Here is why it matters structurally:
When price trades below the midline, it is in the lower half of the range — bearish bias, with sellers in control of the distribution. When price trades above the midline, it shifts into the upper half — bullish bias, with buyers controlling the structure. A weekly close above $1.03 would represent a regime shift within the channel: SUI would no longer be in the recovery phase but in the expansion phase, with $1.21 as the intermediate target and $1.40 as the measured full move.
At $1.01 with a 22.12% single-day gain, price is already doing the mechanical work. The question is whether the weekly candle closes above $1.03 — or whether the level acts as resistance and sends price back toward $0.84.
What Rejection at $1.03 Would Mean
The parallel channel framework is explicit on the downside scenario. A failure to close above $1.03 on the weekly timeframe would confirm the midline as resistance — a historically common outcome on first contact. In that case, the channel structure points to a pullback toward $0.84, the mid-lower support zone that served as the prior base. A loss of $0.84 would put the lower channel boundary at $0.65 back in play — representing a 35.5% downside from current levels.
This is not a failure signal on its own — parallel channels routinely require multiple tests of the midline before a sustained break. But the weekly close matters more than any intraday reading at this level.
Bullish and Bearish Scenarios
Bullish Scenario — Weekly Close Above $1.03
A sustained weekly close above the $1.03 channel midline shifts SUI into the upper half of the range and opens the path to $1.21 as the first intermediate target, followed by the upper channel boundary at $1.40. From the current price of $1.01, that represents a potential move of +38.6% to the upper boundary. The 22.12% single-session move has already demonstrated that when SUI moves, it does so with compression-release velocity. A midline break would be the structural trigger for the next leg.
Bearish Scenario — Rejection at $1.03
If the weekly candle closes below $1.03, the midline holds as resistance. Immediate support is $0.84 — a 16.6% pullback from current levels. A loss of $0.84 reopens the lower channel boundary at $0.65. That level is the line between an intact ranging structure and a broader breakdown. Loss of $0.65 on a weekly close would invalidate the channel entirely.
Why This Setup Has Weight — The Weekly Timeframe
Weekly chart signals carry structural significance that daily or 4-hour setups do not. A channel that has been intact since May 2024 — spanning multiple months of price action — is not a speculative pattern. It reflects the actual supply and demand equilibrium of the market over an extended period. Each touch of the boundaries has been meaningful. The midline test now occurring at $1.03 is the most consequential test within that structure because it determines which half of the range SUI belongs in for the sessions ahead.
For context on how analyst Martinez approaches these multi-timeframe setups, his channel work on SUI follows a similar framework to his analysis of other Layer-1 assets — see his recent read on NEAR Protocol’s macro double bottom for a comparable structural methodology.
Bottom Line
SUI is trading at $1.01, up 22.12% in 24 hours, and is now pressing against the $1.03 channel midline — the single most important level within the weekly parallel channel that analyst Ali Martinez identified on @alicharts. The channel has been intact since May 2024, with clear boundaries at $0.65 (lower) and $1.40 (upper). A confirmed weekly close above $1.03 opens $1.21 as the first intermediate target and $1.40 as the full measured move — a +38.6% extension from current price. A rejection at $1.03 sends price back toward $0.84 support, with $0.65 as the structural invalidation level. The weekly close is the only data point that matters here — intraday touches of $1.03 are noise. Watch the weekly candle close above or below $1.03 as the definitive confirmation or rejection signal for the next directional leg.
Frequently Asked Questions
What is the $1.03 level for SUI and why does it matter?
What is SUI’s price target if it breaks above $1.03?
What happens to SUI if $1.03 acts as resistance?
Why is the weekly close more important than the intraday price for SUI right now?
Source: Ali Charts · Published by CoinsProbe Markets Desk
The opinions and market insights shared on CoinsProbe represent the views of individual authors based on prevailing market conditions at the time of publication. Cryptocurrency investments carry significant risk and volatility. Readers are encouraged to conduct their own research and seek professional financial advice before making investment decisions. CoinsProbe and its contributors do not accept responsibility for financial losses or decisions made based on published content.
CoinsProbe may publish sponsored articles, affiliate links, or promotional collaborations. All sponsored material is clearly labeled to maintain transparency with our audience. Our editorial decisions remain fully independent, and advertising partnerships do not influence reviews, rankings, or published opinions.
Since 2023, CoinsProbe has delivered reliable insights on cryptocurrency, blockchain, and digital assets. Our content is created by experienced researchers and analysts who follow strict editorial standards focused on accuracy, transparency, and credibility. Every article is carefully reviewed and verified using trusted sources and current market data. We provide unbiased analysis and timely updates covering everything from emerging crypto projects to major industry developments.