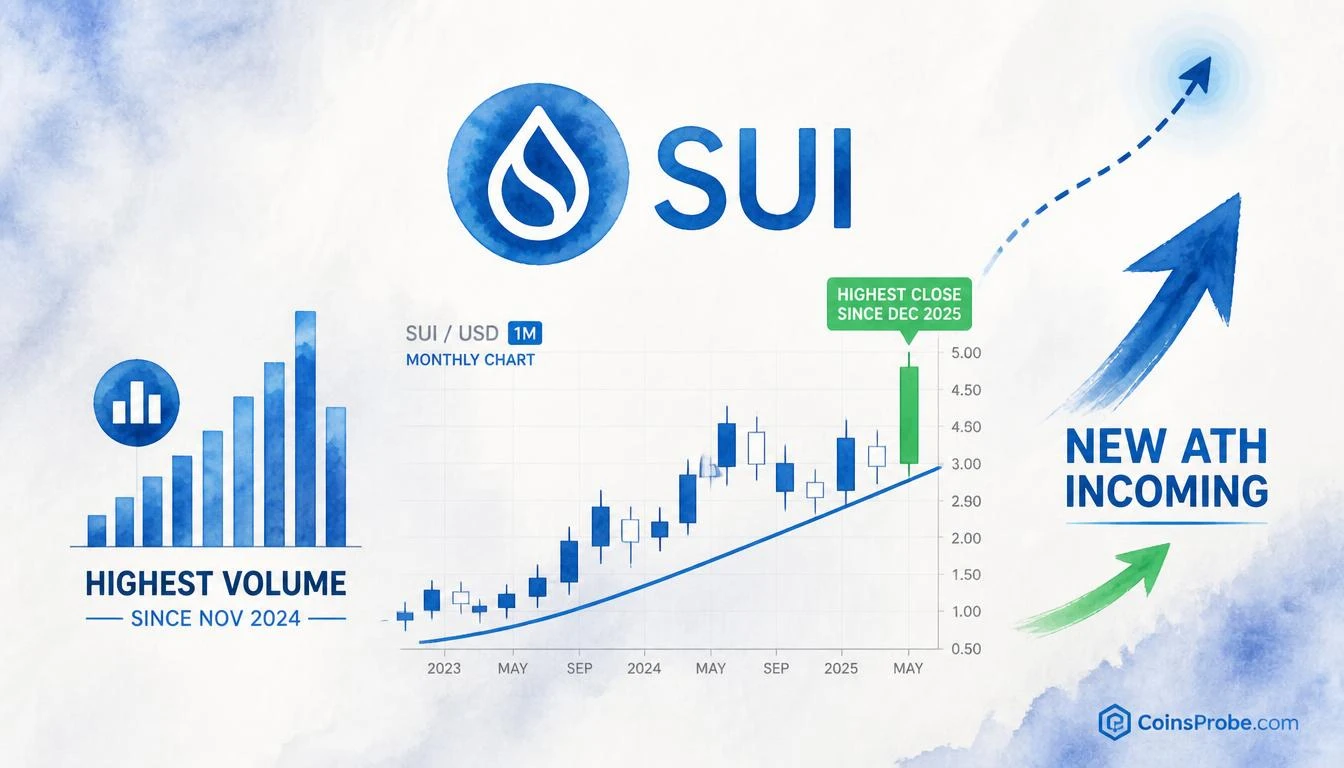

- SUI posts highest monthly close since December 2025 at $1.1898, trading at $1.19 (-4.47% 24h)
- September 2026 monthly volume is the highest since November 2024 — two simultaneous ten-to-twenty-two-month records
- @CryptoBullet1 declares new ATH incoming; $0.90–$1.00 is the dip zone to watch if pullback materializes
- Chart support trendline and explicit $0.9000 horizontal level define the invalidation floor
SUI is trading at $1.19 — down 4.47% in the past 24 hours — with a market cap of $4.90 billion. But the daily candle is noise. The monthly chart is the signal, and what it just printed is the strongest monthly structure SUI has produced in ten months.
Analyst @CryptoBullet1 flagged the development on October 5: the September monthly close was the highest monthly close since December 2025, accompanied by the highest monthly volume since November 2024. His conclusion was direct: “A new ATH is coming anyway.” That is not a hedge. That is a declaration backed by two simultaneous monthly-timeframe records.
Signal 1 — Highest Monthly Close Since December 2025
A monthly close is not an intraday print. It is the price at which the market chose to end a full 30-day period — the single most durable data point on any price chart. When that close is the highest in ten months, it means every seller who entered above this level over that window has been absorbed, and the market has re-established equilibrium at a higher price floor.
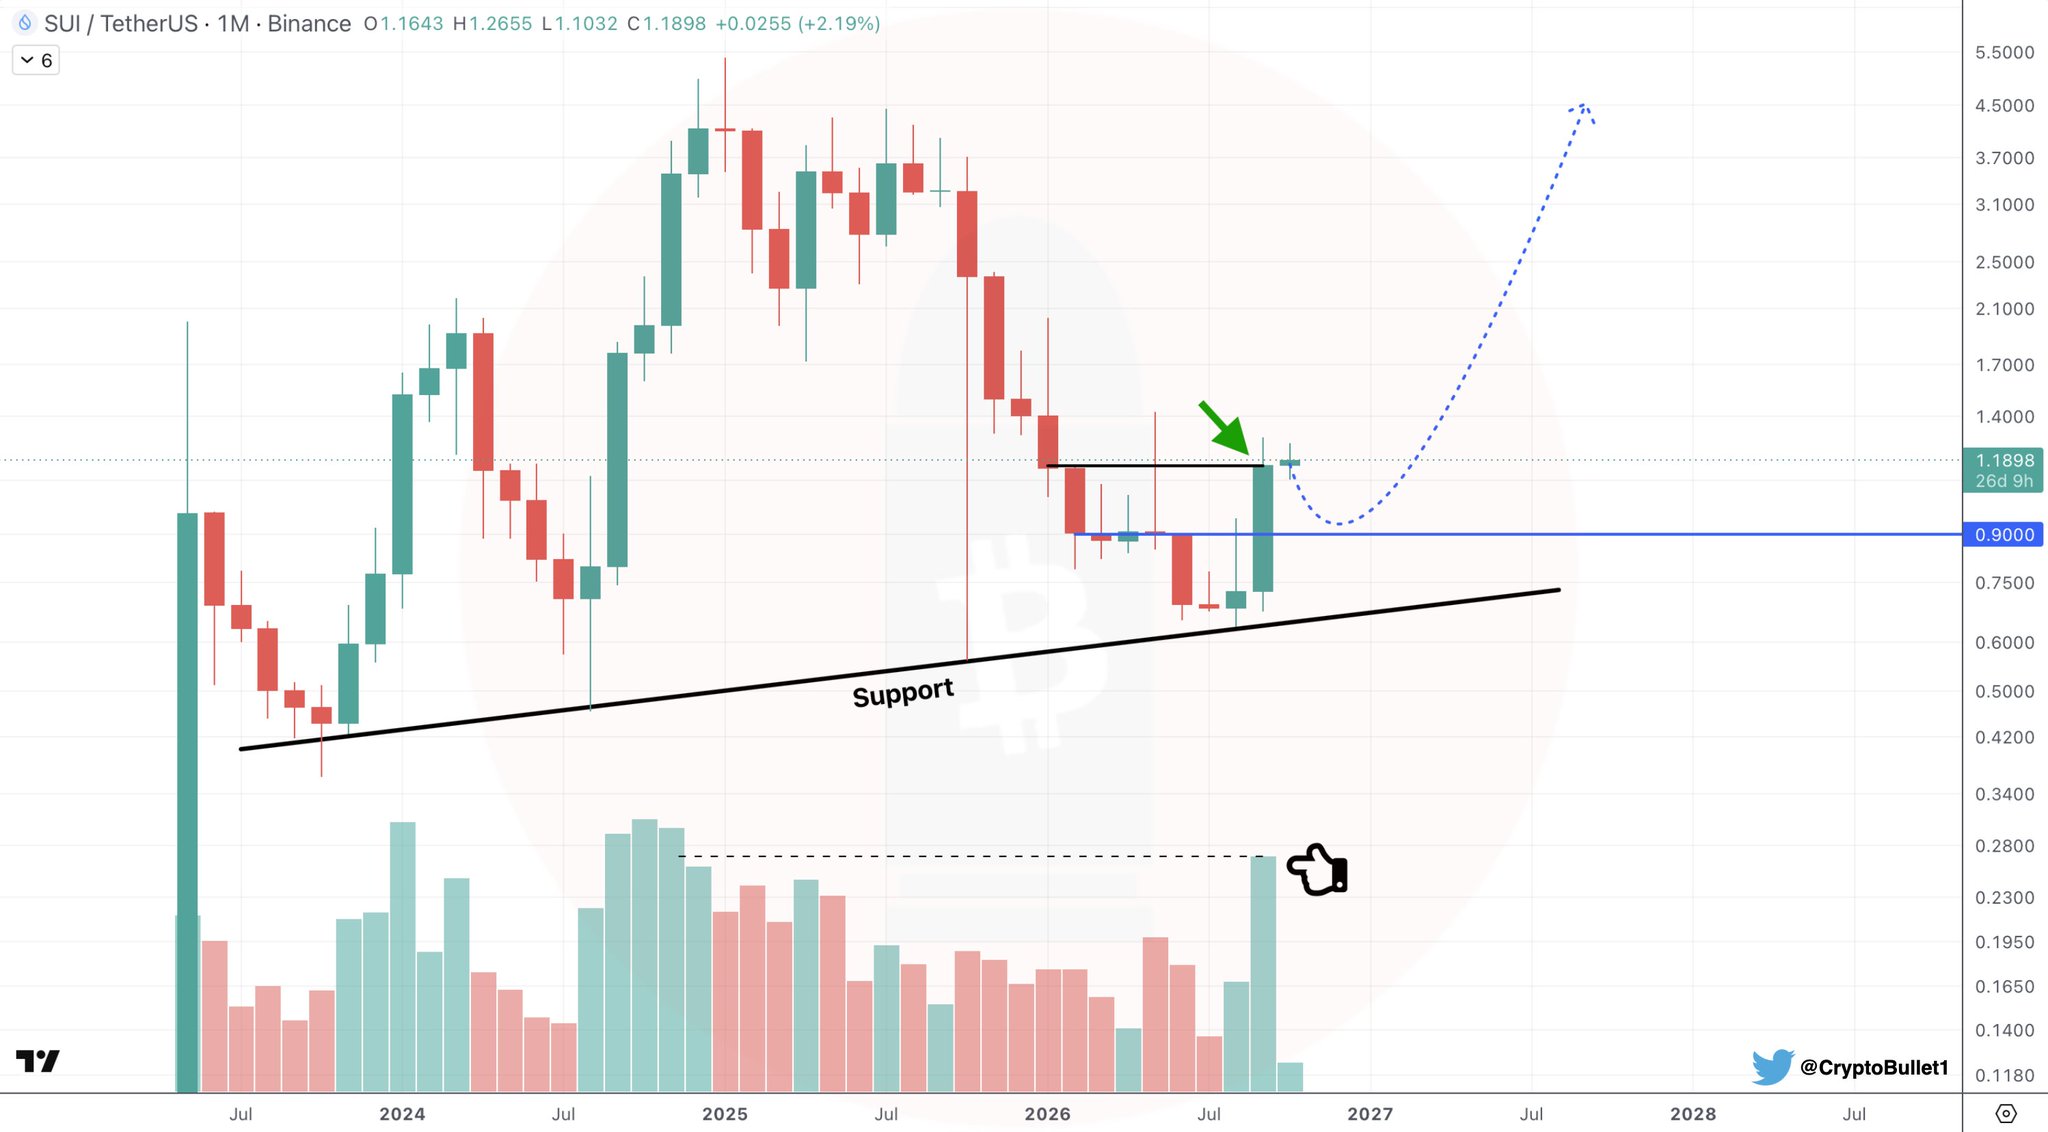
The September 2026 monthly close came in at $1.1898 — above the prior candle’s close and above the recovery range that defined SUI’s base-building period through mid-2026. For context, SUI had previously been analyzed as reclaiming the $1 mid-range level with the channel top at $1.40 in focus. That reclaim has now been followed by a monthly close that confirms structural demand is compounding, not fading. The monthly close above the prior range is the confirmation that level was not resistance — it was a launchpad.
The chart shared by @CryptoBullet1 shows a clear rising diagonal support trendline running from lower-left to upper-right, with price recently bouncing from near that trendline. The horizontal support zone is explicitly marked at $0.9000 on the chart — a level the analyst identifies as the key dip zone if a pullback materializes.
Signal 2 — Highest Monthly Volume Since November 2024
Volume is conviction. Price moves without volume are speculation. Price moves with record volume are consensus. The September 2026 monthly volume on SUI was the highest recorded since November 2024 — a period that, for reference, preceded one of SUI’s most significant directional moves.
The combination of a ten-month closing price high with a twenty-two-month volume high is not a random coincidence. It indicates that the September close was not a low-participation drift higher — it was a high-conviction monthly candle where buyers stepped in at scale. That is the definition of institutional-grade accumulation visible on a public chart.
SUI’s Parabolic SAR previously flipped bullish on the weekly timeframe after an 83% drawdown — a macro bull signal that established the structural floor. The September volume record now confirms that the recovery from that drawdown is accelerating, not stalling.
The $0.90–$1.00 Zone — Opportunity, Not Threat
@CryptoBullet1’s note on a potential dip is precise: “A dip to $0.9–1 would be welcome (not guaranteed, but if it happens, don’t hesitate to pull the trigger).” Two things are embedded in that sentence worth parsing separately.
First: the dip is not guaranteed. The analyst is not calling for a pullback — he is identifying the level where a pullback, if it occurs, becomes an asymmetric entry. The monthly chart’s rising diagonal support trendline converges near the $0.90–$1.00 zone, which is also where the chart’s explicit horizontal support line sits at $0.9000. A test of that zone would be a test of the trendline — a standard technical re-test of a breakout level, not a breakdown.
Second: at current price of $1.19, the $0.90–$1.00 zone represents a 16%–24% pullback from current levels. That is a meaningful but historically routine retracement within SUI’s monthly structure, particularly given the volatility that accompanied the prior 83% drawdown and subsequent recovery.
The TD Sequential ’13’ buy signal that SUI printed earlier in this cycle produced a 45% rally already confirmed. A dip into the $0.90–$1.00 support would reset short-term momentum indicators while leaving the monthly structure — the highest close in ten months — entirely intact.
New ATH Thesis — What the Monthly Chart Is Projecting
SUI’s all-time high was recorded in January 2025. The path to a new ATH from current levels requires sustained monthly closes above the current structure, with volume confirming each step. The dashed projection on @CryptoBullet1’s chart extends toward the 4.5+ range on the price axis — consistent with the ATH thesis but not an analyst-stated target with a specific price. The analyst’s stated conclusion is directional, not a precise number: a new ATH is the destination.
What the monthly data does confirm: SUI has now produced the strongest monthly close in ten months, backed by the highest volume in twenty-two months. Both of those are necessary conditions for a sustained uptrend. Neither is sufficient alone. Together, they constitute the strongest monthly signal SUI has generated since its prior all-time high cycle.
The prior SUI reclaim of $1 set the channel top at $1.40 in focus. A monthly close above $1.40 would be the next structural confirmation point after the current $1.1898 close.
Bullish Scenario
SUI holds above the $0.9000 support on any pullback and posts a second consecutive monthly close above $1.19. Volume sustains above the November 2024 baseline. The monthly structure compounds upward toward the $1.40 channel top, with the ATH thesis remaining intact. The dip zone of $0.90–$1.00, if tested, becomes the highest-conviction re-entry point in the current cycle.
Bearish Scenario
A monthly close below $0.9000 would negate the rising diagonal support trendline that defines the current recovery structure. That outcome would signal that the September monthly close was a false breakout rather than a genuine momentum shift — invalidating the ATH thesis until a new base is established.
The September 2026 monthly candle has delivered two simultaneous records: the highest close in ten months and the highest volume in twenty-two months. @CryptoBullet1’s read is unambiguous — the structure favors a new all-time high. The $0.90–$1.00 zone is the level to watch on any dip; a monthly close below $0.9000 is the only data point that challenges the current thesis. Watch $0.9000 as the line that separates continuation from reset.
Frequently Asked Questions
What does a highest monthly close mean for SUI’s price outlook?
Is the $0.90–$1.00 dip zone a buy signal or a warning sign?
What would invalidate SUI’s ATH thesis on the monthly chart?
Why is the November 2024 volume comparison significant for SUI?
Source: Cryptobullet1 · Published by CoinsProbe Markets Desk
The opinions and market insights shared on CoinsProbe represent the views of individual authors based on prevailing market conditions at the time of publication. Cryptocurrency investments carry significant risk and volatility. Readers are encouraged to conduct their own research and seek professional financial advice before making investment decisions. CoinsProbe and its contributors do not accept responsibility for financial losses or decisions made based on published content.
CoinsProbe may publish sponsored articles, affiliate links, or promotional collaborations. All sponsored material is clearly labeled to maintain transparency with our audience. Our editorial decisions remain fully independent, and advertising partnerships do not influence reviews, rankings, or published opinions.
Since 2023, CoinsProbe has delivered reliable insights on cryptocurrency, blockchain, and digital assets. Our content is created by experienced researchers and analysts who follow strict editorial standards focused on accuracy, transparency, and credibility. Every article is carefully reviewed and verified using trusted sources and current market data. We provide unbiased analysis and timely updates covering everything from emerging crypto projects to major industry developments.