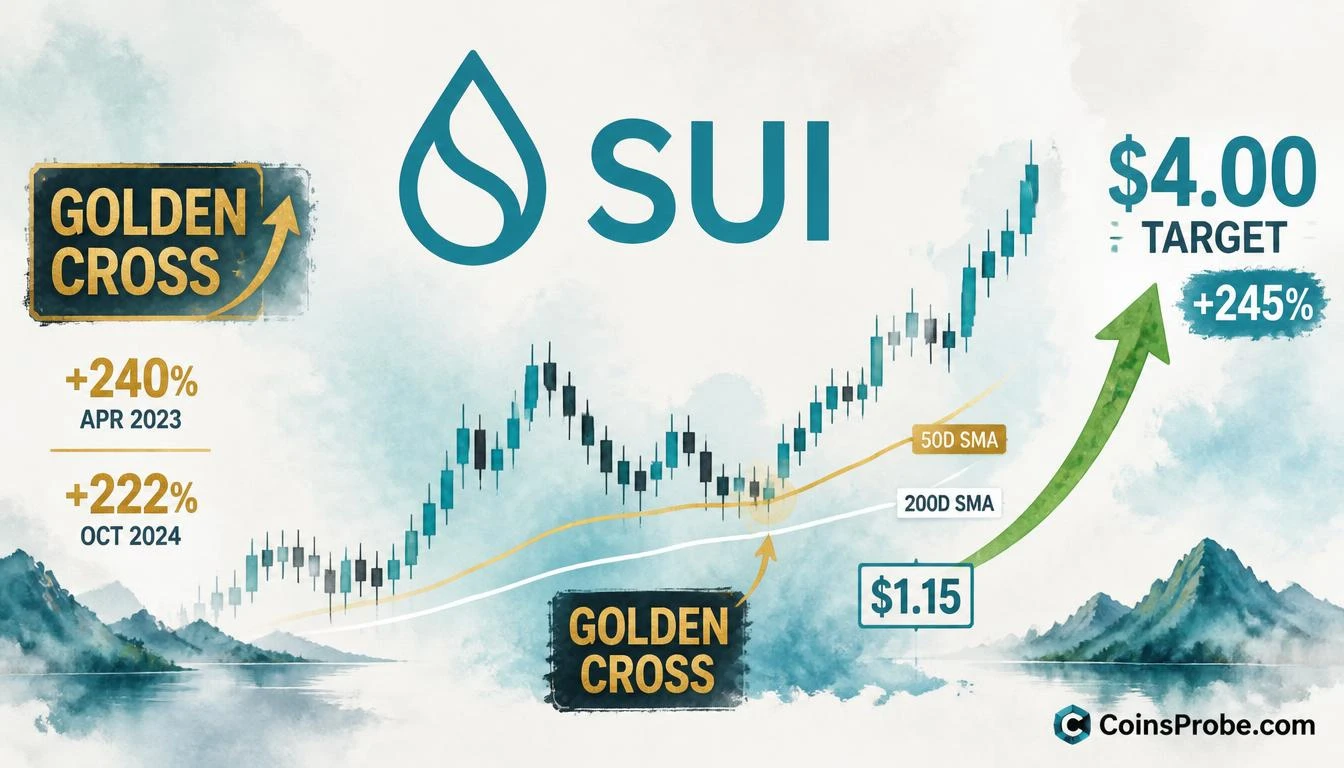

- SUI trades at $1.15 (+2.96% 24h, $4.72B market cap) as a golden cross forms on the daily chart
- Analyst @alicharts flags 50D SMA crossing above 200D SMA — prior two instances produced +240.25% and +222.45% rallies
- $4.00 price target requires +245% from current $1.15; key resistance at $1.80 and $3.00
- Invalidation level: $0.72 — a break below negates the golden cross thesis entirely
SUI is trading at $1.15 — up 2.96% in 24 hours — with a market cap of $4.72 billion, as one of the most reliable trend-reversal signals in technical analysis begins to form on its daily chart: a golden cross.
Crypto analyst Ali Martinez (@alicharts) flagged the setup on September 30, 2026, identifying SUI as “on the verge of printing a new golden cross, with the 50-day SMA beginning to cross above the 200-day SMA.” Martinez called it “a major bullish trend signal” that “could mark the beginning of a longer-term bull market” — with a price target of $4.00.
What a Golden Cross Actually Measures
The golden cross is not a price level — it is a momentum event. It occurs when a shorter-term moving average (the 50-day SMA) crosses above a longer-term one (the 200-day SMA), signaling that recent price action has accelerated above the longer-term trend baseline. The 200-day SMA acts as the long-cycle anchor; when the 50-day breaches it from below, it reflects sustained buying pressure that has outpaced months of prior selling.
This matters on the daily chart because the 200-day SMA represents roughly 40 weeks of price history. A cross above it is not noise — it requires a structural shift in momentum to execute.
The Track Record — Two Prior Golden Crosses, Two +220%+ Rallies
The daily chart shared by @alicharts documents SUI’s prior golden cross instances across the 2025 cycle. Both resulted in sustained rallies of comparable magnitude:
| Instance | Signal Type | Rally Produced |
|---|---|---|
| Golden Cross #1 (2025 Cycle — Early) | 50D SMA crosses above 200D SMA | +240.25% |
| Golden Cross #2 (2025 Cycle — Mid) | 50D SMA crosses above 200D SMA | +222.45% |
| Golden Cross #3 (Forming — Sept 2026) | 50D SMA crossing above 200D SMA | Target: +245% to $4.00 |
Source: @alicharts daily SUI chart, September 30, 2026
Two-for-two is a track record. The current signal is now forming at a structurally similar setup — a deep correction from prior highs followed by a base at approximately $0.72, now recovering with the 50-day SMA curling upward through the 200-day SMA.
Reading the Chart — Levels That Matter
Ali Martinez’s daily SUI chart reveals the full structure of the current setup. Price bottomed near $0.72 — the key support zone — before recovering to current levels around $1.15–$1.16. Two resistance checkpoints stand between current price and the $4.00 target: $1.80 (first resistance) and $3.00 (second major resistance). The $4.00 target represents a +245% move from the $1.15 entry level.
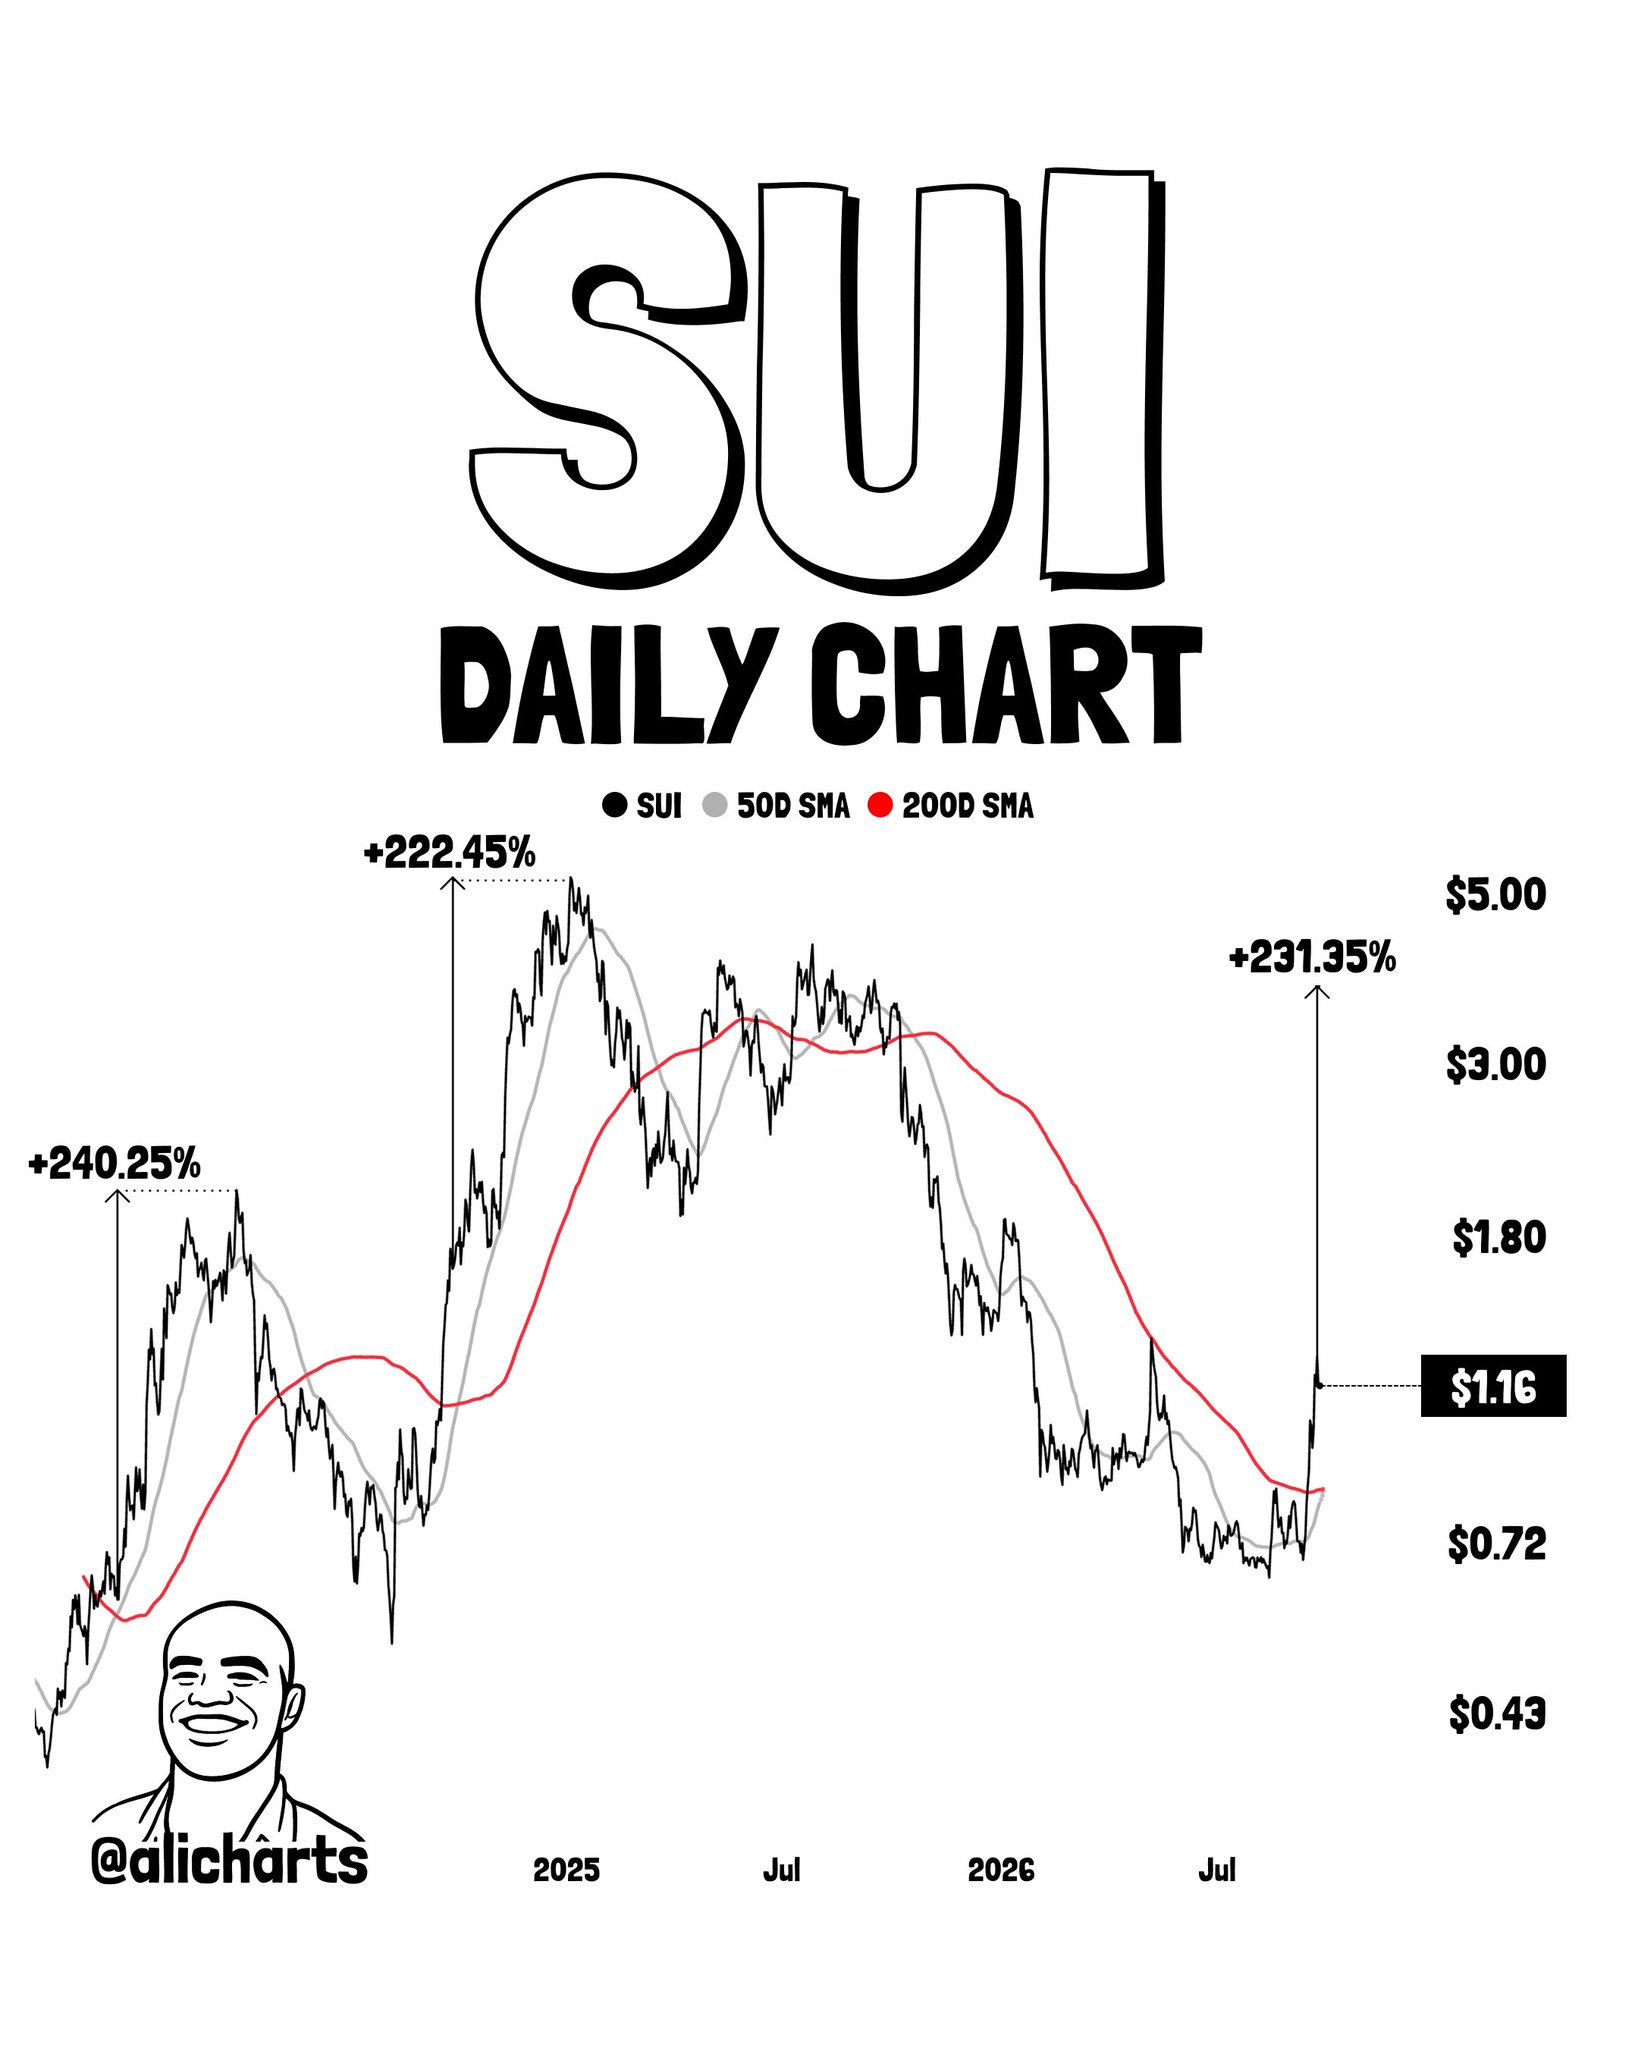
The prior percentage moves annotated on the left side of the chart — the +240.25% and +222.45% labels — represent already-completed rallies from the 2025 cycle peaks, confirming the pattern context. The current formation mirrors those prior launchpad conditions: base established, golden cross imminent, momentum returning.
Key Levels — Support, Resistance, and the Invalidation Line
Three prices define this trade:
- $0.72 — Support / Invalidation: The recent cycle low. A sustained breakdown below this level would invalidate the golden cross thesis and suggest the 200-day SMA is not acting as support but rather resistance from below.
- $1.80 — First Resistance: The initial checkpoint. A clean break and hold above $1.80 on daily closes would confirm the trend reversal is advancing as expected.
- $3.00 — Second Resistance: The intermediate target before the $4.00 zone. Historical resistance from the 2025 cycle structure. Clearing $3.00 on high volume opens the direct path to Martinez’s target.
Bullish Scenario — Confirmed Golden Cross and $1.80 Reclaim
If SUI’s 50-day SMA completes the cross above the 200-day SMA on a daily close, and price subsequently reclaims and holds $1.80, the pattern aligns with the two prior golden cross instances that each produced 220%–240% gains. From $1.80, the next measured move targets $3.00, then $4.00. The +245% path from current levels to $4.00 is consistent with both prior precedents.
Bearish Scenario — Death Cross Invalidation at $0.72
A failure of the golden cross — where the 50-day SMA stalls and rolls back below the 200-day SMA — combined with a breakdown below the $0.72 support level would negate the current bullish structure entirely. In that scenario, SUI would be printing a failed golden cross, historically a bearish signal when the cross reverses quickly, with downside risk reopening toward prior accumulation zones.
Two-for-Two Becomes Three-for-Three — or Doesn’t
SUI’s golden cross is forming at $1.15 with a documented two-for-two track record of producing +220% to +240% rallies in both prior instances this cycle, per Ali Martinez’s daily chart analysis. The mechanism is straightforward: the 50-day SMA crossing above the 200-day SMA signals that medium-term momentum has structurally overtaken the long-term trend, historically the inflection point for SUI’s largest sustained moves. The $4.00 target requires +245% from current price, with $1.80 and $3.00 as the intermediate checkpoints that will define whether the third instance matches its predecessors. Watch $0.72 as the hard invalidation — and watch $1.80 as the first confirmation that the cross is holding.
Frequently Asked Questions
What is a golden cross and why does it matter for SUI specifically?
What price levels must SUI clear for the $4.00 target to remain valid?
What would invalidate the SUI golden cross bull thesis?
How long did prior SUI golden cross rallies take to play out?
Source: Ali Charts · Published by CoinsProbe Markets Desk
The opinions and market insights shared on CoinsProbe represent the views of individual authors based on prevailing market conditions at the time of publication. Cryptocurrency investments carry significant risk and volatility. Readers are encouraged to conduct their own research and seek professional financial advice before making investment decisions. CoinsProbe and its contributors do not accept responsibility for financial losses or decisions made based on published content.
CoinsProbe may publish sponsored articles, affiliate links, or promotional collaborations. All sponsored material is clearly labeled to maintain transparency with our audience. Our editorial decisions remain fully independent, and advertising partnerships do not influence reviews, rankings, or published opinions.
Since 2023, CoinsProbe has delivered reliable insights on cryptocurrency, blockchain, and digital assets. Our content is created by experienced researchers and analysts who follow strict editorial standards focused on accuracy, transparency, and credibility. Every article is carefully reviewed and verified using trusted sources and current market data. We provide unbiased analysis and timely updates covering everything from emerging crypto projects to major industry developments.