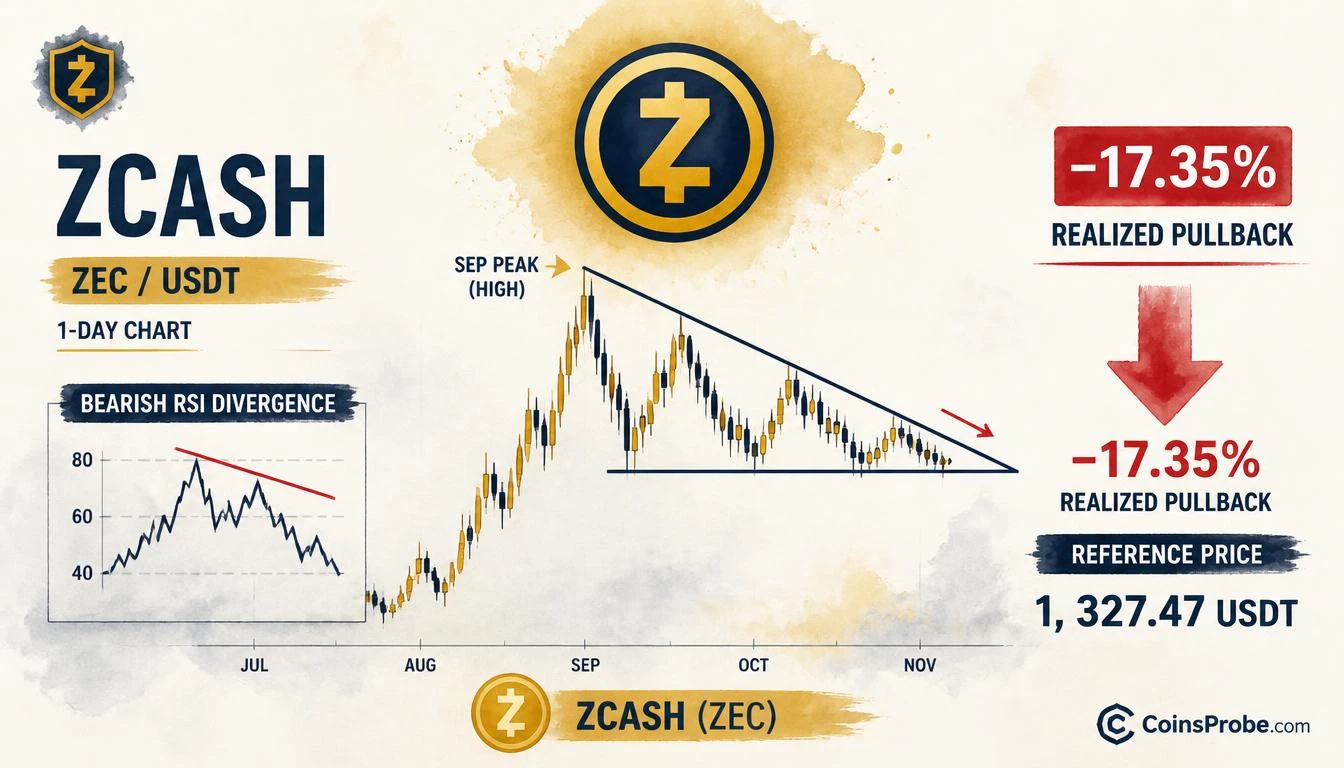
- ZEC has realized a confirmed −17.35% decline from its September peak, per the 1-day chart shared by @CryptoBullet1
- The bearish descending triangle and RSI divergence setup called by @CryptoBullet1 is executing as predicted — analyst confirms "so far so good"
- ZEC daily OHLC on the signal date: Open 1,352.37
- High 1,356.92
- Low 1,302.62
- Close 1,327.47 (−1.84%)
- Watch 1,302 daily close as the key line between pullback completion and continued breakdown
Zcash (ZEC) is executing a textbook bearish pullback — and the analyst who called it is watching it unfold in real time. Trader @CryptoBullet1 flagged a bearish descending structure on ZEC weeks ago, and the asset has now delivered the anticipated decline with near-surgical precision. The word from the analyst: “So far so good.”
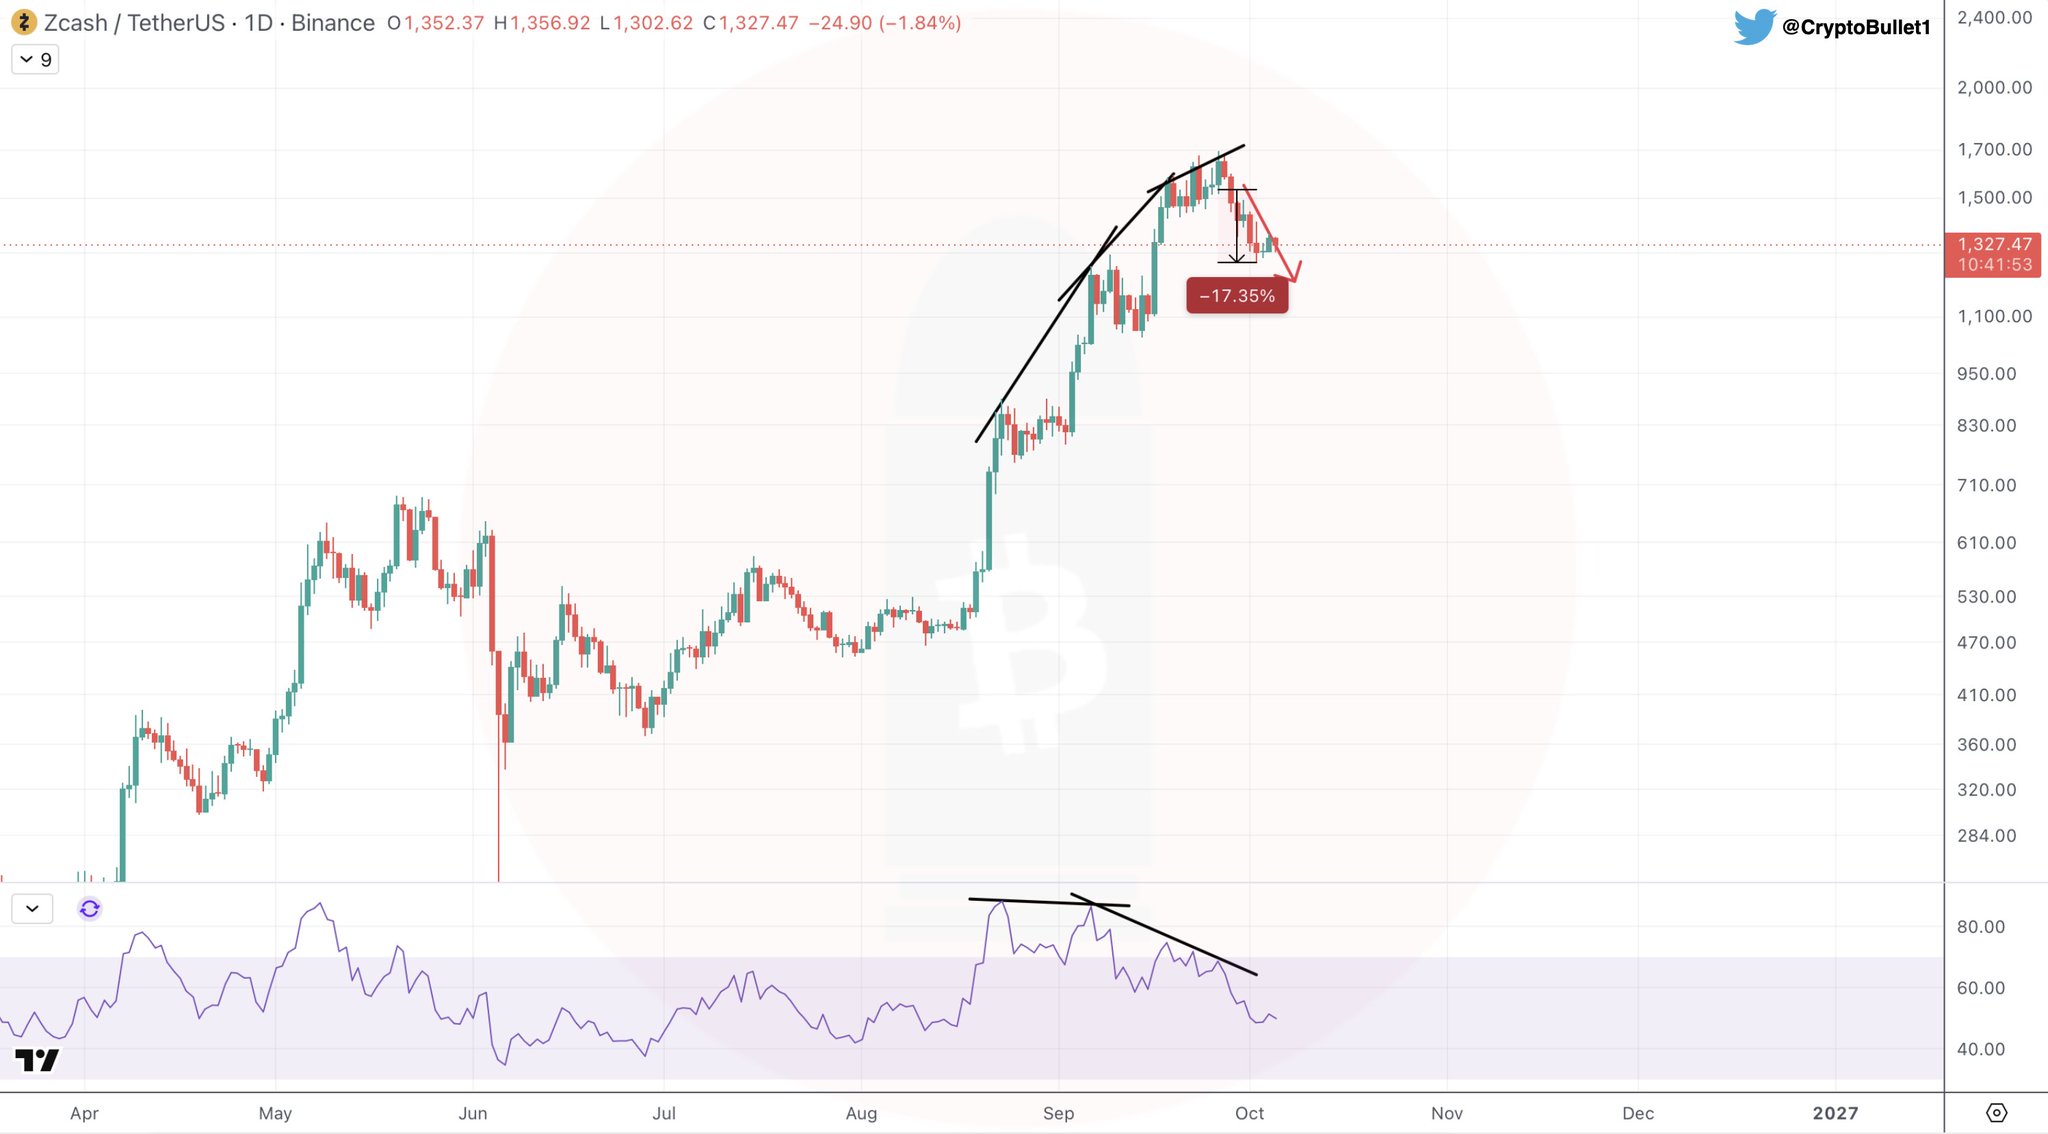
The chart shared by @CryptoBullet1 on X shows a realized drawdown of exactly −17.35% from Zcash’s September peak — printed directly on the 1-day Binance chart as a confirmed, completed move. This is not a projection. The label is in the past tense. The trade thesis the analyst built around a bearish descending triangle and RSI divergence is now validated by price action.
The Setup — Descending Triangle Meets RSI Bearish Divergence
The 1-day ZEC/USDT chart on Binance reveals a classic bearish configuration at the September peak. Converging trendlines formed a downward-pointing wedge — structurally a descending triangle or bear flag — as price compressed below resistance and failed to hold higher lows. This pattern type typically resolves in the direction of the dominant trend: lower.
Compounding the price structure, the RSI indicator painted a declining trendline across the same period — a bearish divergence shape where momentum deteriorated as price attempted to maintain levels. The RSI axis on the chart marks key thresholds at 80, 60, and 40, and the declining RSI trajectory confirmed that buying pressure was systematically weakening at the September highs.
This combination — price compression in a descending wedge with deteriorating RSI — is precisely what CoinsProbe covered in an earlier analysis. As we noted in Zcash (ZEC) Bearish RSI Divergence — Is a 15–20% Drop Already in Motion?, the RSI divergence structure was already signaling that a meaningful pullback was building. The −17.35% realized move sits squarely within that 15–20% forecast range.
The Printed Move — −17.35% From September Peak to October Low
The OHLC data on the chart anchors the analysis precisely. On the day @CryptoBullet1 posted the update, ZEC printed: Open 1,352.37 | High 1,356.92 | Low 1,302.62 | Close 1,327.47 — a daily loss of 24.90 points, or −1.84%. The broader context is the red annotation box on the chart, which marks the −17.35% decline from the September high to the October drawdown zone. That move is confirmed and complete.
The price axis on the chart runs from 284.00 at the base to 2,400.00 at the top, with key visible levels at 1,100.00, 950.00, and 830.00 below current price — and 1,500.00, 1,700.00, and 2,000.00 above. None of these are analyst-stated targets in this note; they are chart axis reference points. @CryptoBullet1’s message is singular: the predicted setup is executing.
Why ‘So Far So Good’ Matters — The Analyst Is Still Watching
The phrase “so far so good” is not a declaration that the trade is over. It is a confirmation that the structure is behaving as modeled — and an implicit signal that @CryptoBullet1 is still positioned or still monitoring for the next phase. In chart analysis, a setup that validates its first leg typically has a second leg or a defined resolution point — either a support hold that triggers a reversal, or continued breakdown through the next structural level.
For context on the scale of positioning around ZEC at these levels, earlier reporting showed that a major Zcash whale’s spot bag reached $220M in unrealized profit alongside a $58M short hedge — a dual position that reflects exactly this kind of anticipation of near-term weakness against a longer-term bullish core. The −17.35% move would represent meaningful realization on that short leg.
What the Chart Confirms — and What It Doesn’t
What it confirms: The bearish descending triangle pattern and RSI divergence that @CryptoBullet1 identified produced the anticipated drawdown. The −17.35% decline from the September high is realized and labeled on the chart. The setup has played out as predicted.
What it doesn’t confirm: @CryptoBullet1’s note does not state a bottom. No support level is declared as a floor. No reversal signal is flagged. The analyst says the setup is progressing — not that it is complete. Additional downside toward the 1,100.00–950.00 axis zone cannot be ruled out from the chart data alone.
What to watch: Whether ZEC finds a definitive support reaction at a structurally significant level and the RSI prints a higher low — which would be the first indication of the bearish momentum exhausting. Without that, the descending structure remains intact.
Bullish Scenario
ZEC stabilizes at or above the current 1,302–1,327 range, RSI prints a higher low versus the September trough, and price reclaims the descending wedge’s upper boundary. This would suggest the −17.35% pullback marked the completion of the correction rather than its midpoint.
Bearish Scenario
ZEC fails to hold 1,302 on a daily closing basis, RSI continues its declining trendline below 40, and price extends toward the next axis reference zones at 1,100 and 950. @CryptoBullet1’s “so far so good” would then imply further downside continuation is still in progress.
The large-scale whale position context adds another layer: as covered in prior reporting, Garrett Jin holds 202,078 ZEC at a $312.8M valuation with $224.5M in unrealized profit — a position size large enough to influence ZEC liquidity at key structural levels. Whether that accumulation acts as a demand floor in this pullback zone is the open question the market is now pricing.
@CryptoBullet1’s call on ZEC remains active. The −17.35% predicted decline has materialized. The next data point is whether price finds a structural base or the descending pattern reasserts. Watch the 1,302 daily close as the immediate line between consolidation and continuation.
Frequently Asked Questions
What is the −17.35% move @CryptoBullet1 flagged on ZEC?
Has the ZEC bearish setup fully played out, or is more downside possible?
What pattern did @CryptoBullet1 identify on the ZEC chart before the drop?
How does the Garrett Jin whale position relate to this ZEC pullback?
Source: Cryptobullet1 · Published by CoinsProbe Markets Desk
The opinions and market insights shared on CoinsProbe represent the views of individual authors based on prevailing market conditions at the time of publication. Cryptocurrency investments carry significant risk and volatility. Readers are encouraged to conduct their own research and seek professional financial advice before making investment decisions. CoinsProbe and its contributors do not accept responsibility for financial losses or decisions made based on published content.
CoinsProbe may publish sponsored articles, affiliate links, or promotional collaborations. All sponsored material is clearly labeled to maintain transparency with our audience. Our editorial decisions remain fully independent, and advertising partnerships do not influence reviews, rankings, or published opinions.
Since 2023, CoinsProbe has delivered reliable insights on cryptocurrency, blockchain, and digital assets. Our content is created by experienced researchers and analysts who follow strict editorial standards focused on accuracy, transparency, and credibility. Every article is carefully reviewed and verified using trusted sources and current market data. We provide unbiased analysis and timely updates covering everything from emerging crypto projects to major industry developments.