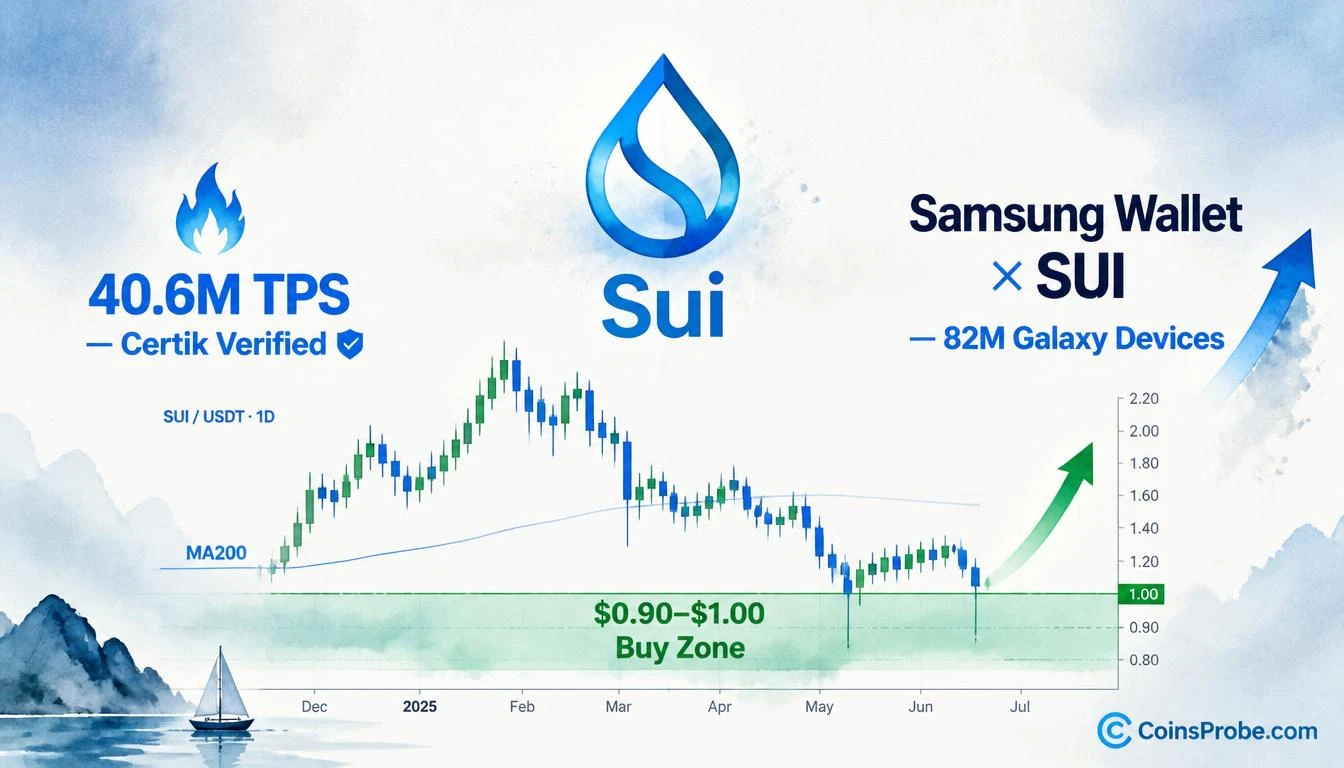

- SUI trades at $1.0460 — down 2.51% in 24h but up 47.80% over 30 days, market cap $4.31B
- Analyst @CryptoBullet1 flags $0.90–$1.00 as the MA200-backed "Buy The Dip" zone after two sub-$1 wicks in 7 days
- Sui sets 40.6M TPS mainnet record verified by Certik — network throughput at a new all-time high
- Samsung Wallet integrating Sui to bring USDC to 82 million US Galaxy devices
Sui (SUI) is trading at $1.0460 — down 2.51% in the past 24 hours and 6.82% over the past seven days — but up 47.80% over the past 30 days, with a market cap of approximately $4.31 billion. The pullback follows a sharp monthly surge, and despite two dips below $1.00 in the past week, the structure has not broken. The asset is consolidating directly above a zone that carries both technical and fundamental weight.
Analyst @CryptoBullet1 identifies the $0.90–$1.00 range as the strategic accumulation zone — what he calls the “Buy The Dip” zone — coinciding with MA200 support on the daily chart. His October 13 post notes the pullback was “expected” and frames the sub-$1 wicks not as failure but as the dip worth buying. His prior monthly-chart note flagged the same zone: “dip to $0.9–$1 welcome (not guaranteed). New ATH coming anyway.”
Signal 1 — The $0.90–$1.00 Accumulation Zone (MA200 Confluence)
The daily chart shared by @CryptoBullet1 shows SUI printing two wicks below $1.00 within a seven-day window, each recovering back above the level. The MA200 sits within the $0.90–$1.00 band, providing dynamic support that aligns with the analyst’s stated buy zone. The chart projects a blue path — a volatile W-shaped consolidation followed by a sharp upward impulse — suggesting the current pullback is the setup phase, not the reversal. The current price label on the chart reads $1.0446, sitting just above the shaded accumulation zone.
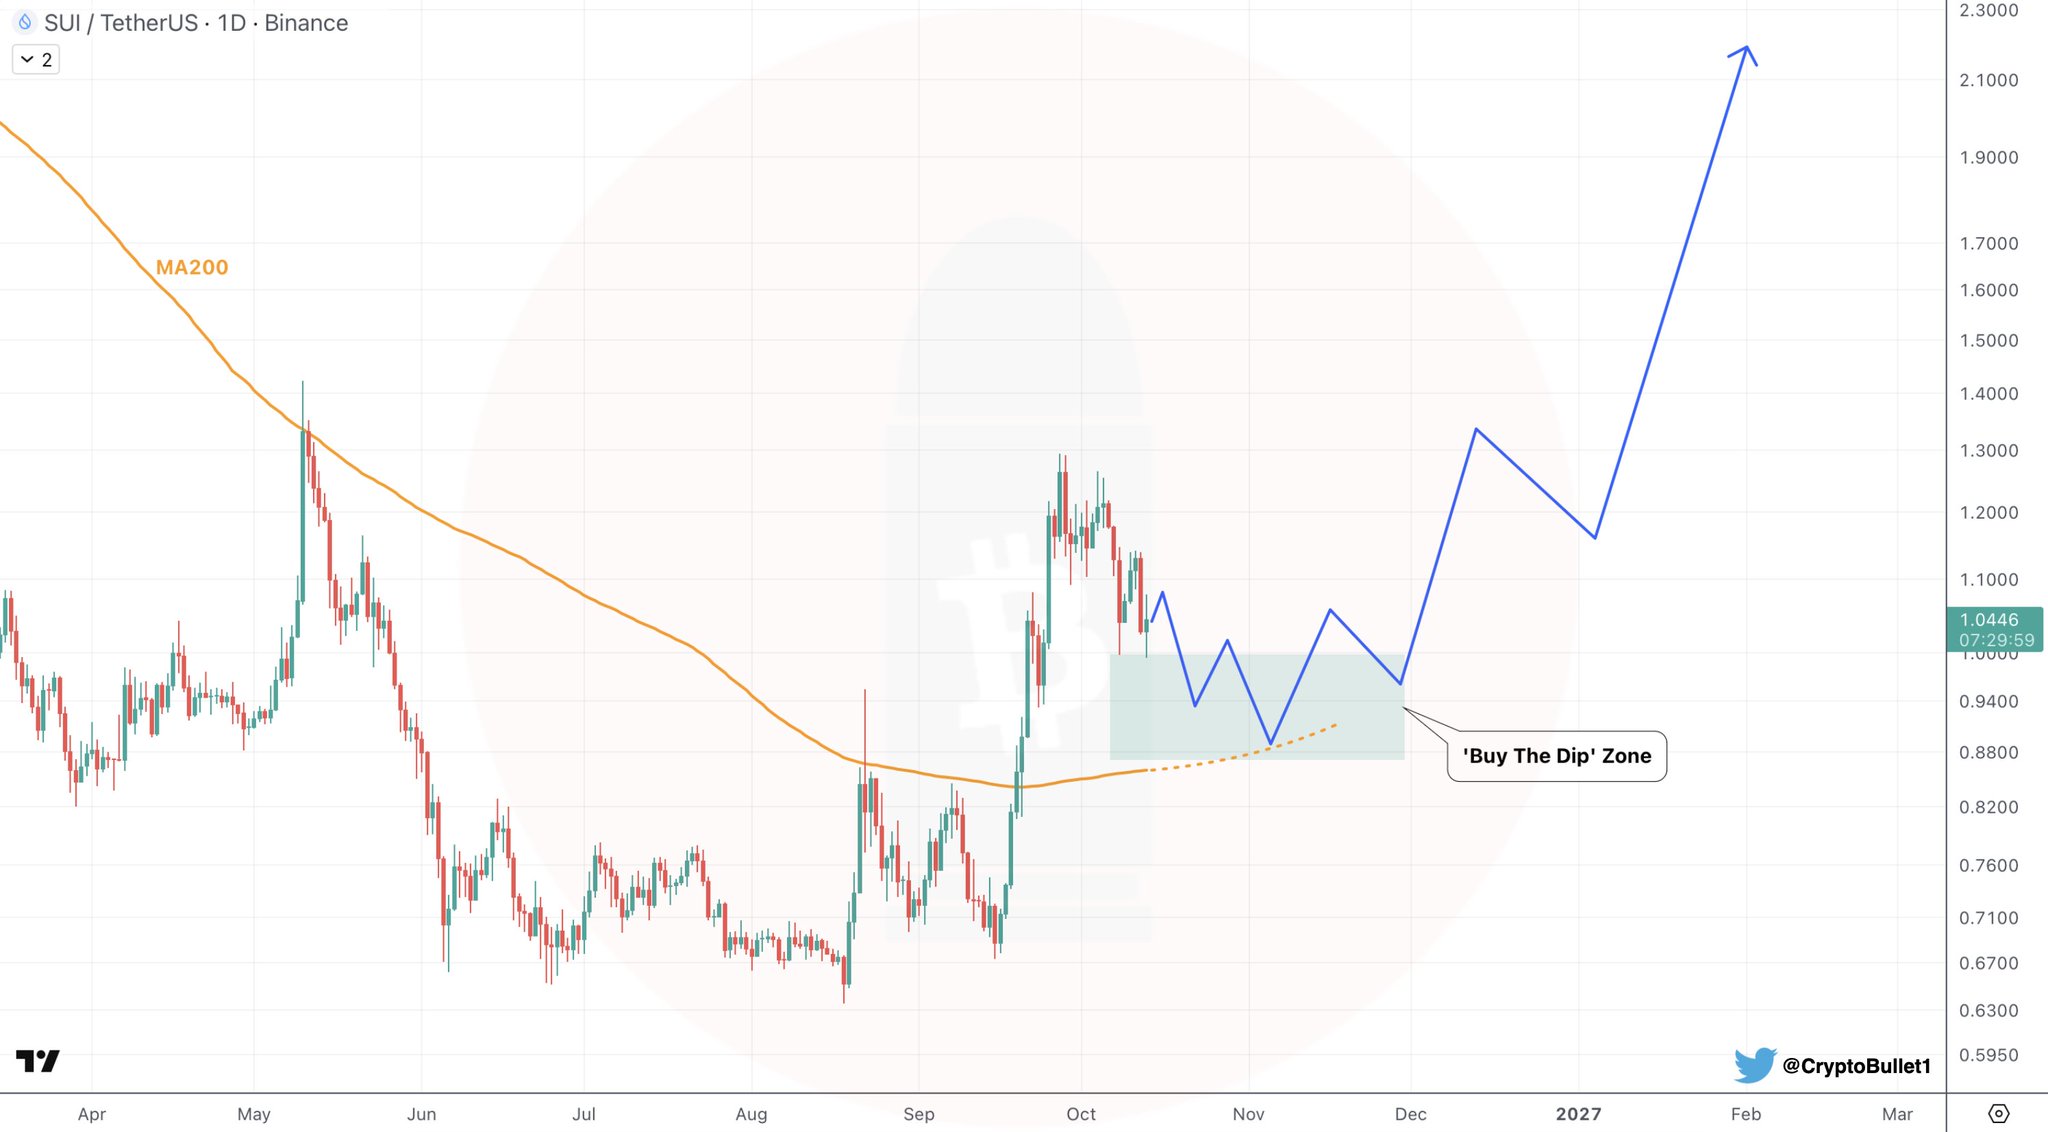
This is not the first time SUI’s MA200 has acted as a floor. When SUI reclaimed $1.00 earlier this cycle, the channel top at $1.40 came into immediate focus. The structure is repeating: price dips into the zone, tests it twice, and the question becomes whether demand absorbs the supply.
@CryptoBullet1’s monthly chart context adds weight to the setup. His October 5 note flagged that SUI had printed its highest monthly close since December 2025 and its highest monthly volume since November 2024 — two structural readings that don’t appear during bear phases. The 47.80% 30-day surge that preceded this dip is the direct result of that monthly momentum.
Signal 2 — 40.6M TPS Record, Verified by Certik
The technical setup is underpinned by a verifiable on-chain milestone. Sui recently set a new transactions-per-second record of 40.6 million TPS — independently verified by blockchain security firm Certik. This is not a theoretical throughput number from a testnet or marketing document. It is a live mainnet figure with third-party verification.
Network throughput at this scale matters for token valuation because it directly expands the addressable use cases. A blockchain capable of 40.6M TPS can support real-time gaming, high-frequency DeFi, and enterprise-grade payment rails simultaneously without congestion. SUI’s macro bull signal from its Parabolic SAR weekly flip was already flagging institutional-grade accumulation — the TPS record confirms the network is delivering the throughput that signal anticipated.
Signal 3 — Samsung Wallet Integration: USDC to 82 Million Galaxy Devices
The adoption catalyst is concrete and distribution-scale. Samsung Wallet is integrating Sui to bring USDC to 82 million US Galaxy devices. This is not an MOU or a letter of intent — it is a wallet-level integration with one of the world’s largest hardware manufacturers, targeting an installed base of 82 million active devices in the United States alone.
The mechanism is direct: Samsung Galaxy users gain native USDC access through Sui’s network infrastructure, bypassing the friction that has historically kept mainstream users off crypto rails. Each Galaxy device becomes a potential on-ramp to Sui’s ecosystem — DeFi, payments, gaming, NFTs. At 82 million devices, even a 1% activation rate represents 820,000 new wallet addresses entering the Sui network.
This is structurally different from typical exchange listing narratives. An exchange listing brings traders. A Samsung Wallet integration brings consumers who have never opened a crypto app. The long-term TVL and transaction volume implications of that distinction are not priced into a single week’s price action. The last time SUI’s SuperTrend buy signal flashed, the token rallied 77.53% — that signal preceded adoption catalysts of significantly smaller scale than a Samsung integration.
The Dip in Context — Monthly Strength vs. Weekly Weakness
The 6.82% seven-day decline looks sharp in isolation. Placed against the 47.80% 30-day gain, it is a pullback of approximately 12% from peak — entirely within the range of healthy consolidation following a momentum surge of that magnitude. The two sub-$1 wicks signal that sellers tested the zone twice and failed to sustain price below it. That is the definition of demand absorption, not capitulation.
@CryptoBullet1’s monthly read remains unchanged: highest monthly close since December 2025, highest monthly volume since November 2024. Neither of those readings reverses on a weekly pullback. They represent the structural bid that the $0.90–$1.00 zone is defending.
Bullish Scenario
SUI holds $0.90 as the floor and reclaims $1.10 with conviction. The MA200 confluence and dual sub-$1 wicks are absorbed as accumulation. The Samsung Wallet activation cycle drives new wallet growth into the network, and the 40.6M TPS record attracts developer and institutional attention. @CryptoBullet1’s conclusion: “New ATH coming anyway.”
Bearish Scenario
A sustained daily close below $0.90 would break the MA200 and invalidate the accumulation zone thesis. @CryptoBullet1 does not name a downside target beyond the zone — a close below $0.90 would require reassessment of the monthly structure that currently supports the bullish read.
The confluence of three simultaneous signals — MA200 support at a technically defined accumulation zone, a Certik-verified 40.6M TPS record, and a Samsung Wallet integration reaching 82 million US devices — makes the $0.90–$1.00 zone one of the more structurally supported dip-buy setups in the current altcoin cycle. The weekly noise is real. The monthly structure and the adoption trajectory are more real. Watch $0.90 as the line that keeps the thesis intact, and watch a reclaim of $1.10 as the first confirmation that the dip has been absorbed.
Frequently Asked Questions
What is the $0.90–$1.00 buy zone for SUI and why does it matter?
What is SUI’s 40.6M TPS record and who verified it?
How does the Samsung Wallet integration benefit SUI?
What level would invalidate the bullish SUI thesis?
Source: Cryptobullet1 · Published by CoinsProbe Markets Desk
The opinions and market insights shared on CoinsProbe represent the views of individual authors based on prevailing market conditions at the time of publication. Cryptocurrency investments carry significant risk and volatility. Readers are encouraged to conduct their own research and seek professional financial advice before making investment decisions. CoinsProbe and its contributors do not accept responsibility for financial losses or decisions made based on published content.
CoinsProbe may publish sponsored articles, affiliate links, or promotional collaborations. All sponsored material is clearly labeled to maintain transparency with our audience. Our editorial decisions remain fully independent, and advertising partnerships do not influence reviews, rankings, or published opinions.
Since 2023, CoinsProbe has delivered reliable insights on cryptocurrency, blockchain, and digital assets. Our content is created by experienced researchers and analysts who follow strict editorial standards focused on accuracy, transparency, and credibility. Every article is carefully reviewed and verified using trusted sources and current market data. We provide unbiased analysis and timely updates covering everything from emerging crypto projects to major industry developments.