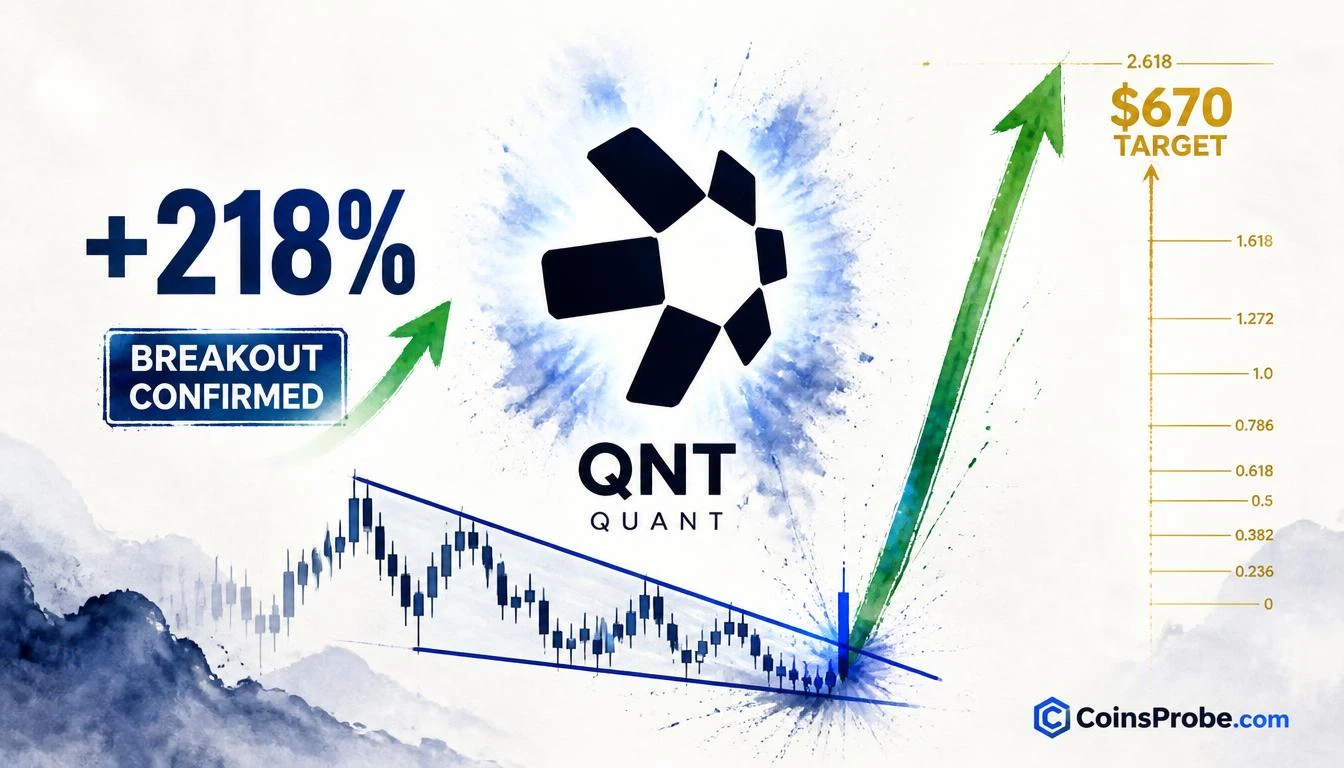
- QNT is trading near $165 — a +218.62% rally from its multi-year wedge support low near $52–$63
- Analyst @CryptoBullet1 flags a weekly descending wedge breakout with a projected $670 target (1.618 Fibonacci extension)
- $670 target represents a further ~305% move from current price of ~$165
- Critical invalidation level: a weekly close below $100 would signal a false breakout and flip the structure bearish
Quant (QNT) is trading near $165 after completing a +218.62% rally from its trendline low near $52–$63 — a move that has now fully exited a multi-year descending wedge compression pattern that formed between mid-2022 and late 2024. This is not a speculative breakout in early stages. The breakout has already printed, been measured, and confirmed on the weekly chart.
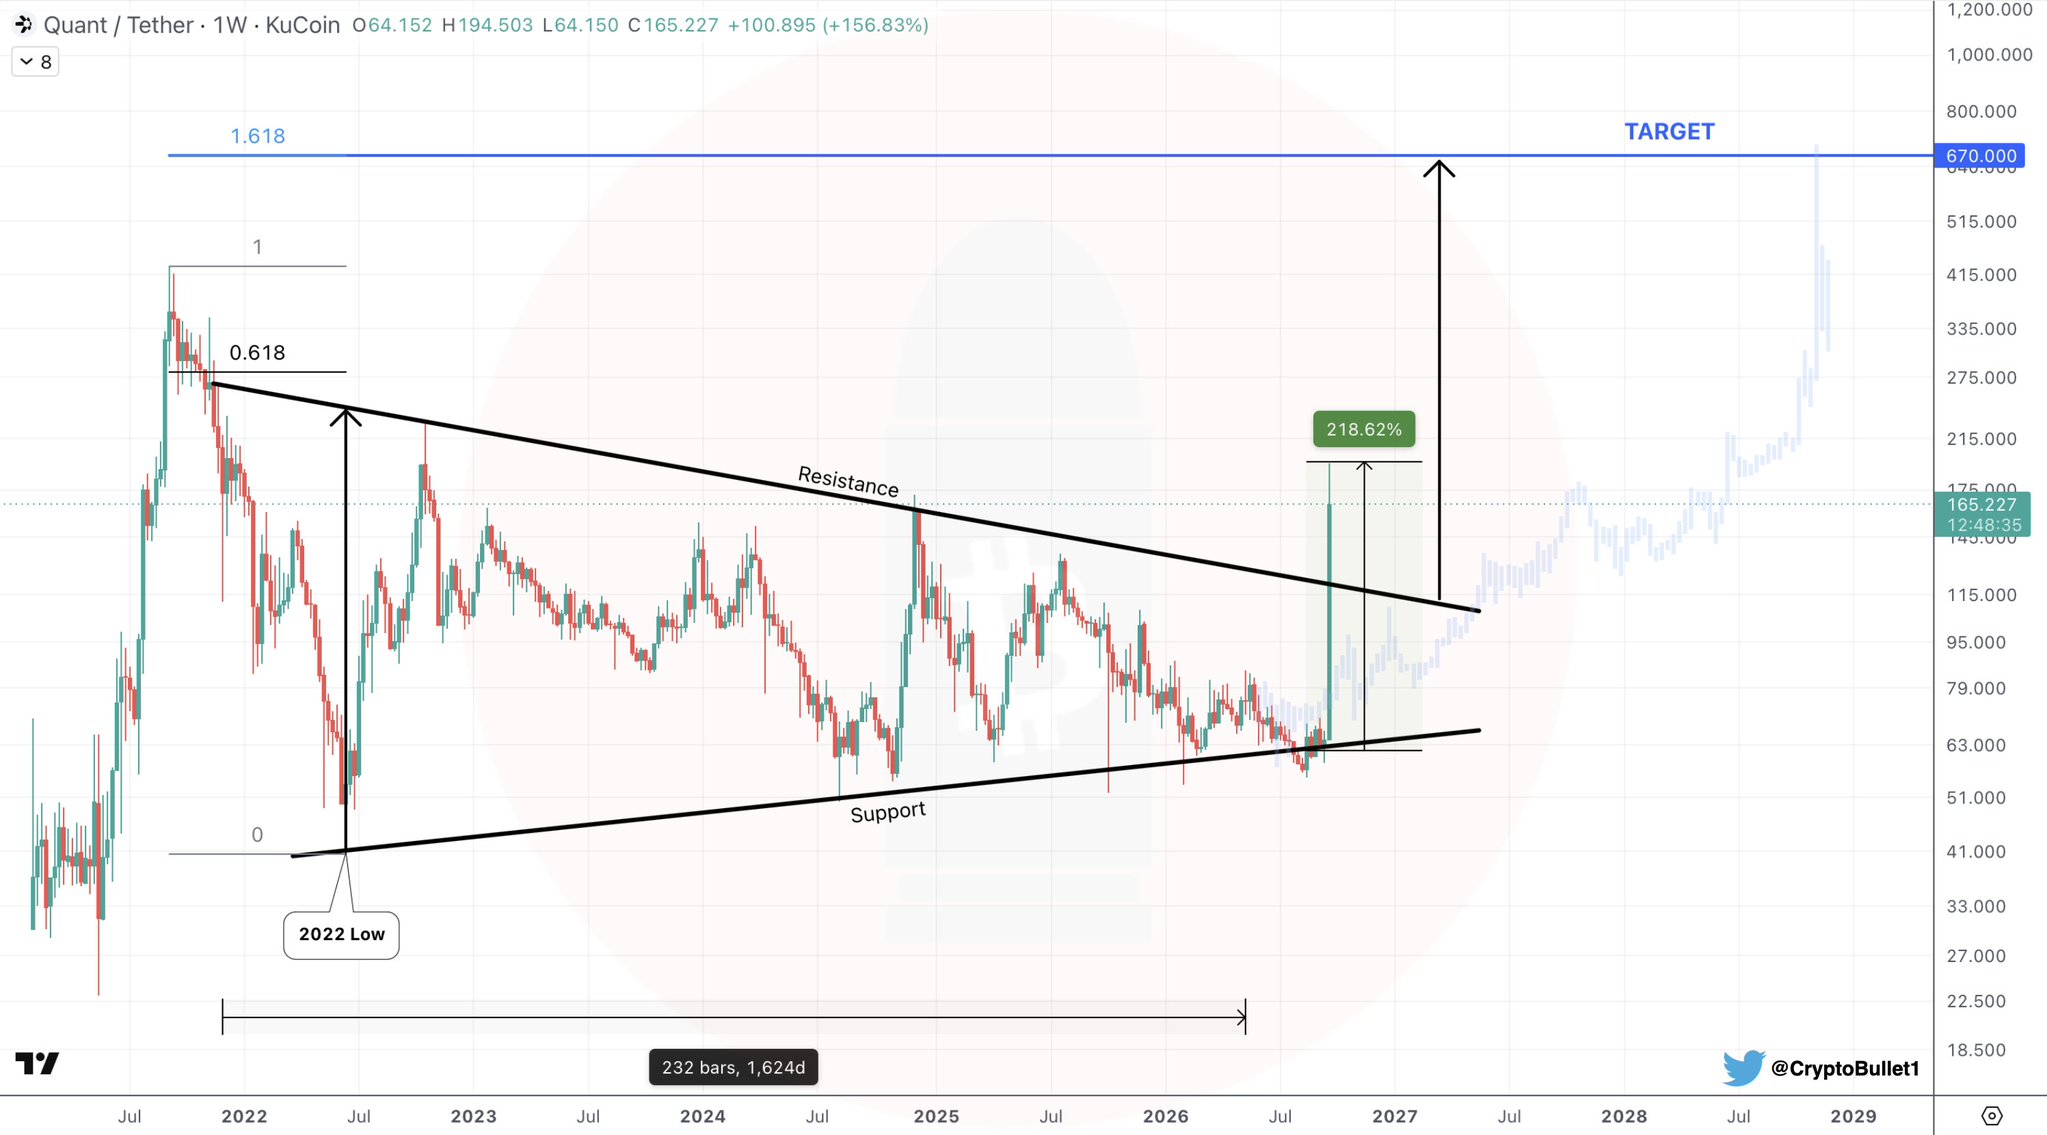
Crypto analyst @CryptoBullet1 flagged the move with a direct declaration: “What a breakout! +218% so far.” The post was accompanied by a weekly QNT/USDT chart on KuCoin that documents the completed move — and projects a continuation toward $670, the 1.618 Fibonacci extension level, representing a further ~305% move from current price.
The Pattern — A Multi-Year Descending Wedge, Now Broken
The weekly chart shared by @CryptoBullet1 reveals a descending triangle/wedge structure spanning roughly 2022 to late 2024. The pattern formed as QNT compressed between a rising support trendline (holding the $52–$63 zone) and a descending resistance trendline (capping price near $100–$115 at the point of breakout). Patterns like this represent energy compression — each failed breakdown into the trendline support and each lower high rejection building tension inside the structure.
Price has now broken upward from the apex of that compression and extended to approximately $165. The +218.62% label on the chart documents the already-completed rally — measuring from the support trendline base (~$52) to the current price. This is not a projected gain. It is a realized, historical move that has already run.
The $670 Target — What the 1.618 Fibonacci Extension Says
The forward projection on the chart places the next major target at $670, derived from the 1.618 Fibonacci extension of the wedge structure’s measured move. From the current price of ~$165, reaching $670 would represent an additional ~305% advance.
The 1.618 Fibonacci extension is a standard tool for projecting the continuation leg of a breakout from a compression pattern. When a multi-year structure like this resolves, the measured move methodology typically anchors the target to the height of the pattern applied from the breakout point. The $670 level is where that measurement terminates.
It is important to separate what the chart confirms from what it projects:
| Phase | Price Zone | Status | Move |
|---|---|---|---|
| Wedge Base (Support Low) | ~$52–$63 | Completed | Starting point |
| Breakout Level | ~$100–$115 | Completed | Resistance cleared |
| Current Price | ~$165 | Current | +218.62% from base |
| 1.618 Fib Extension | $670 | Projected | +305% from current |
QNT Breakout Phase Summary | Source: @CryptoBullet1 (X)
The $670 target remains a projected future goal, not an achieved level. The chart establishes it as the logical terminus of the measured move — not a guarantee.
Why a Multi-Year Wedge Breakout Carries Weight
Weekly-timeframe breakouts from multi-year compression structures are statistically significant for one reason: they require sustained, not impulsive, buying pressure to execute. A daily chart breakout can be manufactured by a single session of volume. A weekly chart breakout from a two-year structure requires multiple weeks of higher closes, meaning the buyer base is broad and persistent.
The descending wedge specifically is a bullish reversal pattern. Each lower high within the pattern represents sellers losing relative strength — they control the narrative but deliver progressively less downside. The rising trendline support simultaneously shows buyers absorbing every dip at higher absolute lows. The breakout is the moment buyers finally overwhelm sellers at the apex.
In QNT’s case, this compression ran for approximately two years before resolving upward. The length of compression often correlates with the magnitude of the breakout — a principle consistent with the $670 projection being substantially above current levels. Similar dynamics have played out in large-cap altcoins that built multi-year bases before extending: assets like Chainlink, where whale accumulation preceded major structural moves, followed comparable patterns of compression before breakout.
Bull and Bear Scenarios From Current Price
Bullish Scenario — $670 in View
If QNT holds above the former descending resistance trendline — now acting as support near $100–$115 — and continues to post higher weekly closes, the measured move toward $670 remains the active technical target. A retest of the $115–$130 zone on a pullback that holds on a weekly closing basis would be a textbook breakout-retest-continuation setup, and would represent a high-conviction re-entry zone for traders using the breakout thesis.
Bearish Scenario — Loss of Breakout Level
A weekly close back below $100 — inside the wedge — would invalidate the breakout structure entirely. That outcome would suggest the current move is a false breakout, and QNT would likely revert toward the rising trendline support near $63–$70. A false breakout from a two-year pattern would be a structurally bearish development, not a buying opportunity.
The Level That Matters
QNT has completed one of the cleaner multi-year descending wedge breakouts in the current altcoin cycle, with +218.62% already realized from the trendline base. The analyst’s $670 target — the 1.618 Fibonacci extension — is the logical continuation of a measured move that has already demonstrated significant follow-through. Whether the rally extends to that level or consolidates first, the structure is constructive as long as weekly closes remain above the former resistance trendline, now support near $100–$115. The structural thesis holds or fails at that level. Watch $100 on any pullback — a close below it on the weekly chart is the one reading that changes the narrative entirely. Similar patterns of altcoin accumulation and breakout are visible in names like Dogecoin, where whale activity into resistance preceded major structural decisions.
Frequently Asked Questions
What is the $670 price target for QNT based on?
Has QNT already completed the +218% move, or is that a future projection?
What price level would invalidate the QNT breakout thesis?
Why is a weekly chart breakout more significant than a daily chart breakout for QNT?
Source: Cryptobullet1 · Published by CoinsProbe Markets Desk
The opinions and market insights shared on CoinsProbe represent the views of individual authors based on prevailing market conditions at the time of publication. Cryptocurrency investments carry significant risk and volatility. Readers are encouraged to conduct their own research and seek professional financial advice before making investment decisions. CoinsProbe and its contributors do not accept responsibility for financial losses or decisions made based on published content.
CoinsProbe may publish sponsored articles, affiliate links, or promotional collaborations. All sponsored material is clearly labeled to maintain transparency with our audience. Our editorial decisions remain fully independent, and advertising partnerships do not influence reviews, rankings, or published opinions.
Since 2023, CoinsProbe has delivered reliable insights on cryptocurrency, blockchain, and digital assets. Our content is created by experienced researchers and analysts who follow strict editorial standards focused on accuracy, transparency, and credibility. Every article is carefully reviewed and verified using trusted sources and current market data. We provide unbiased analysis and timely updates covering everything from emerging crypto projects to major industry developments.