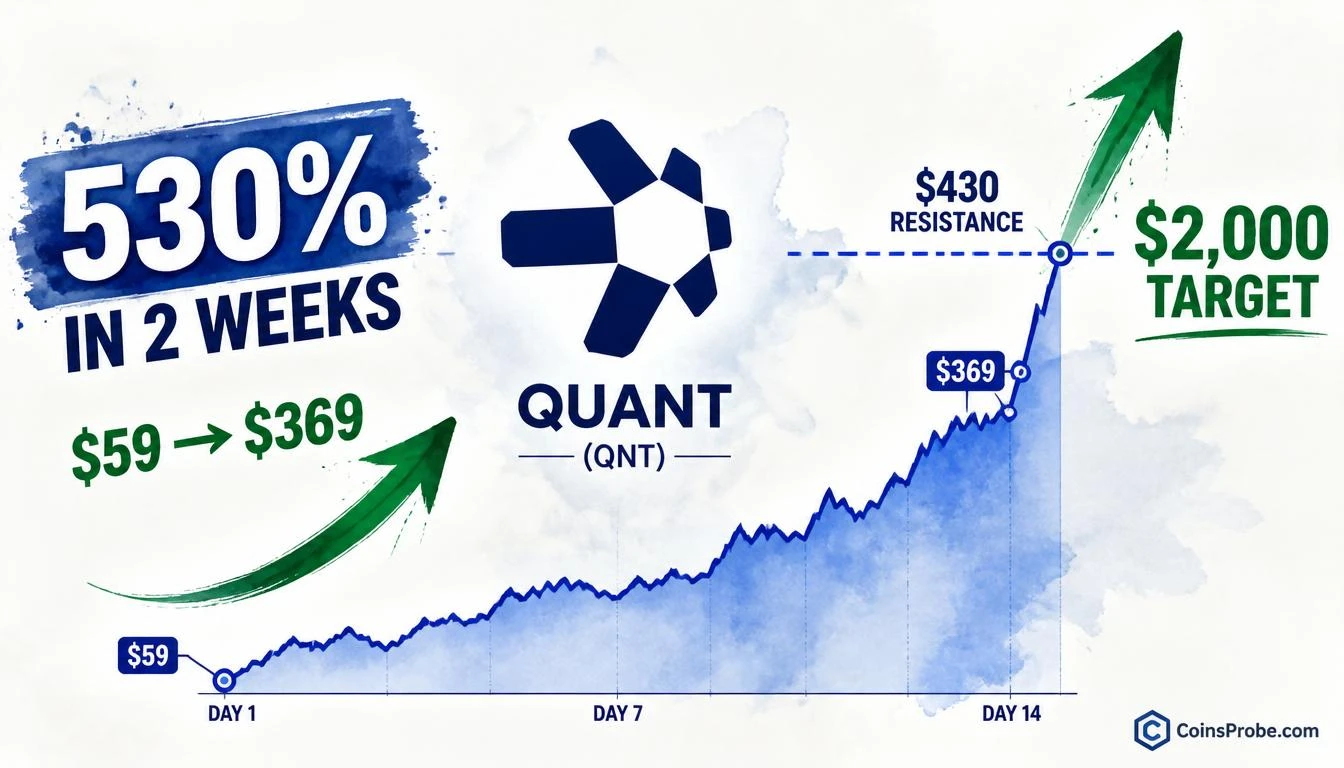
- QNT surged 530% in two weeks — from $59 to $369 — one of the sharpest large-cap moves on record
- Analyst @alicharts issues unhedged call: "QUANT: BULL RUN. TARGET $2,000" contingent on $430 break
- $430 is the decisive gate — channel top + 2021 ATH zone — 32% above chart price of $326
- $2,000 target represents +500% from current levels if price discovery phase activates
Quant (QNT) has posted one of the most violent two-week rallies in its history — climbing from approximately $59 to $369, a gain of roughly 530% — placing it among the sharpest short-duration moves recorded for a large-cap protocol token. At the time of writing, QNT is trading near $293 as bulls test the next major structural ceiling.
The move has drawn immediate attention from independent analyst Ali Martinez (@alicharts), who issued a direct, unhedged declaration: “QUANT: BULL RUN. TARGET $2,000.”
Martinez identifies the top of a multi-month ascending channel near $430 as the single pivotal level separating the current rally from a full price discovery phase — one that, if breached decisively, he argues could trigger a continuation toward that four-digit target.
The 530% Move
A 530% rally in fourteen days is not noise. It is a regime change in price structure. QNT opened the two-week period near $59 — a level last seen during the broader market compression of late 2025 — and has since compressed nearly five months of expected move into a single fortnight. To place this in context: QNT’s prior all-time high was approximately $427 in September 2021, meaning the token is now within striking distance of reclaiming that historical peak for the first time in roughly five years.
The velocity of the move matters analytically. Rallies of this magnitude in compressed timeframes typically fall into one of two categories: liquidity-driven short squeezes that fully retrace, or genuine demand-side re-rating events that find support at newly established equilibrium levels. The distinction is determined by what happens at resistance — in this case, the $430 channel top that Martinez has flagged as the decisive line.
The $430 Level — Channel Resistance and the Price Discovery Gate
Martinez’s analysis places the critical resistance at approximately $430, which aligns with the top of QNT’s ascending price channel on the weekly timeframe. This is not an arbitrary technical level — it coincides with QNT’s 2021 all-time high zone, making it a convergence of both channel structure and historical supply.
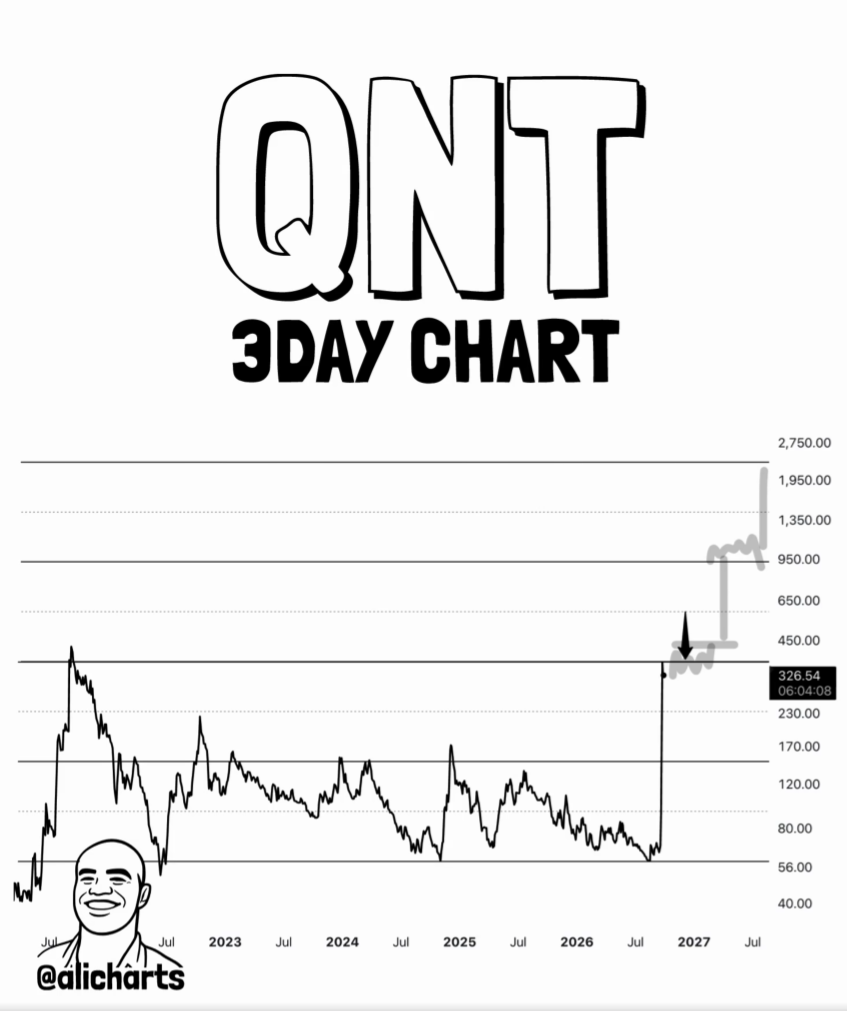
The significance of a channel breakout at this juncture is specific: once an asset clears its all-time high within the context of a well-defined channel, the chart structure provides no overhead supply reference. That is the technical definition of price discovery — a state where the next resistance level must be constructed from first principles, typically measured moves and psychological round numbers.
At $430, QNT would be approximately 16.5% above current levels. A decisive close above that level — not an intraday wick, not a brief tag — is the condition Martinez sets for the $2,000 thesis to activate.
| Level | Type | Distance from $326 |
|---|---|---|
| $326 | Current Chart Price | — |
| $430 | Channel Top / ATH Zone Resistance | +32% |
| $2,000 | Analyst Price Discovery Target | +500% |
Key levels per @alicharts (X) — October 2026
The $2,000 Target — Measured Move or Speculation?
A $2,000 target from current levels represents a further +500% move from $326. That sounds extreme until framed against the already-documented 530% two-week rally. The question is not whether QNT can produce large moves — it demonstrably can — but whether the post-$430 structure supports a continuation of that magnitude.
In prior QNT cycles, the token’s move from its 2020 base near $5 to the 2021 peak near $427 represented an approximately 8,440% rally. A $2,000 target from a $59 cycle base would represent a roughly 3,290% total move — within the historical range of QNT’s prior bull cycle amplitude, though smaller in absolute percentage terms. This is the precedent-based case Martinez is implicitly referencing when he calls this a bull run rather than a bounce.
What separates this reading from generic price optimism is the structural anchor: the $430 level must break first. Without that confirmation, the $2,000 figure is a conditional target, not a current projection. Martinez’s framing is conditional — “a decisive break above that level could send Quant into price discovery” — which is analytically honest.
What Determines Whether the Rally Sustains
The metric to track is straightforward: a sustained weekly close above $430. That single condition determines whether QNT enters price discovery or reverts into the channel for a potential retest of lower support levels. Below, the immediate structural support following a 530% rally would logically sit near the prior breakout zone — approximately $200–$220, representing the area where momentum accelerated during the initial surge phase.
Bullish Scenario
A decisive weekly close above $430 — clearing both the channel top and the 2021 all-time high zone — would constitute a price discovery breakout with no historical overhead supply. Martinez’s $2,000 target (+500% from $326) would become the operative measured move. Intermediate resistance markers to watch on the way up: $600, $900, and $1,400 as psychological and round-number reference points in an uncharted zone.
Bearish Scenario
Failure to hold above $430 on a closing basis — particularly a weekly close back below the channel midline near $250 — would invalidate the price discovery thesis and suggest the two-week surge was a liquidity event rather than a demand re-rating. In that scenario, a retest of the $200–$220 structural zone is the base case, representing a 40–46% drawdown from current levels but still well above the $59 cycle base.
The Single Number That Resolves This
QNT has already done the extraordinary — 530% in two weeks from $59 to $369. The debate now is whether that move is a precursor or the entirety of this cycle’s move. Martinez’s framework makes the answer binary and testable: $430 is the gate. A decisive break above it opens price discovery and the $2,000 thesis. A rejection at $430 means the channel holds, and buyers must defend the $200–$220 zone to keep the broader bull structure intact.
Watch the weekly close at $430 as the single level that determines whether QNT’s bull run declaration becomes a confirmed breakout or a premature call.
Frequently Asked Questions
What is the $430 resistance level in QNT’s chart and why does it matter?
How does a 530% two-week rally in QNT compare to its historical bull cycle?
What level invalidates the QNT bull run thesis?
What are the intermediate price targets between $430 and $2,000 for QNT?
Source: Ali Charts · Published by CoinsProbe Markets Desk
The opinions and market insights shared on CoinsProbe represent the views of individual authors based on prevailing market conditions at the time of publication. Cryptocurrency investments carry significant risk and volatility. Readers are encouraged to conduct their own research and seek professional financial advice before making investment decisions. CoinsProbe and its contributors do not accept responsibility for financial losses or decisions made based on published content.
CoinsProbe may publish sponsored articles, affiliate links, or promotional collaborations. All sponsored material is clearly labeled to maintain transparency with our audience. Our editorial decisions remain fully independent, and advertising partnerships do not influence reviews, rankings, or published opinions.
Since 2023, CoinsProbe has delivered reliable insights on cryptocurrency, blockchain, and digital assets. Our content is created by experienced researchers and analysts who follow strict editorial standards focused on accuracy, transparency, and credibility. Every article is carefully reviewed and verified using trusted sources and current market data. We provide unbiased analysis and timely updates covering everything from emerging crypto projects to major industry developments.