
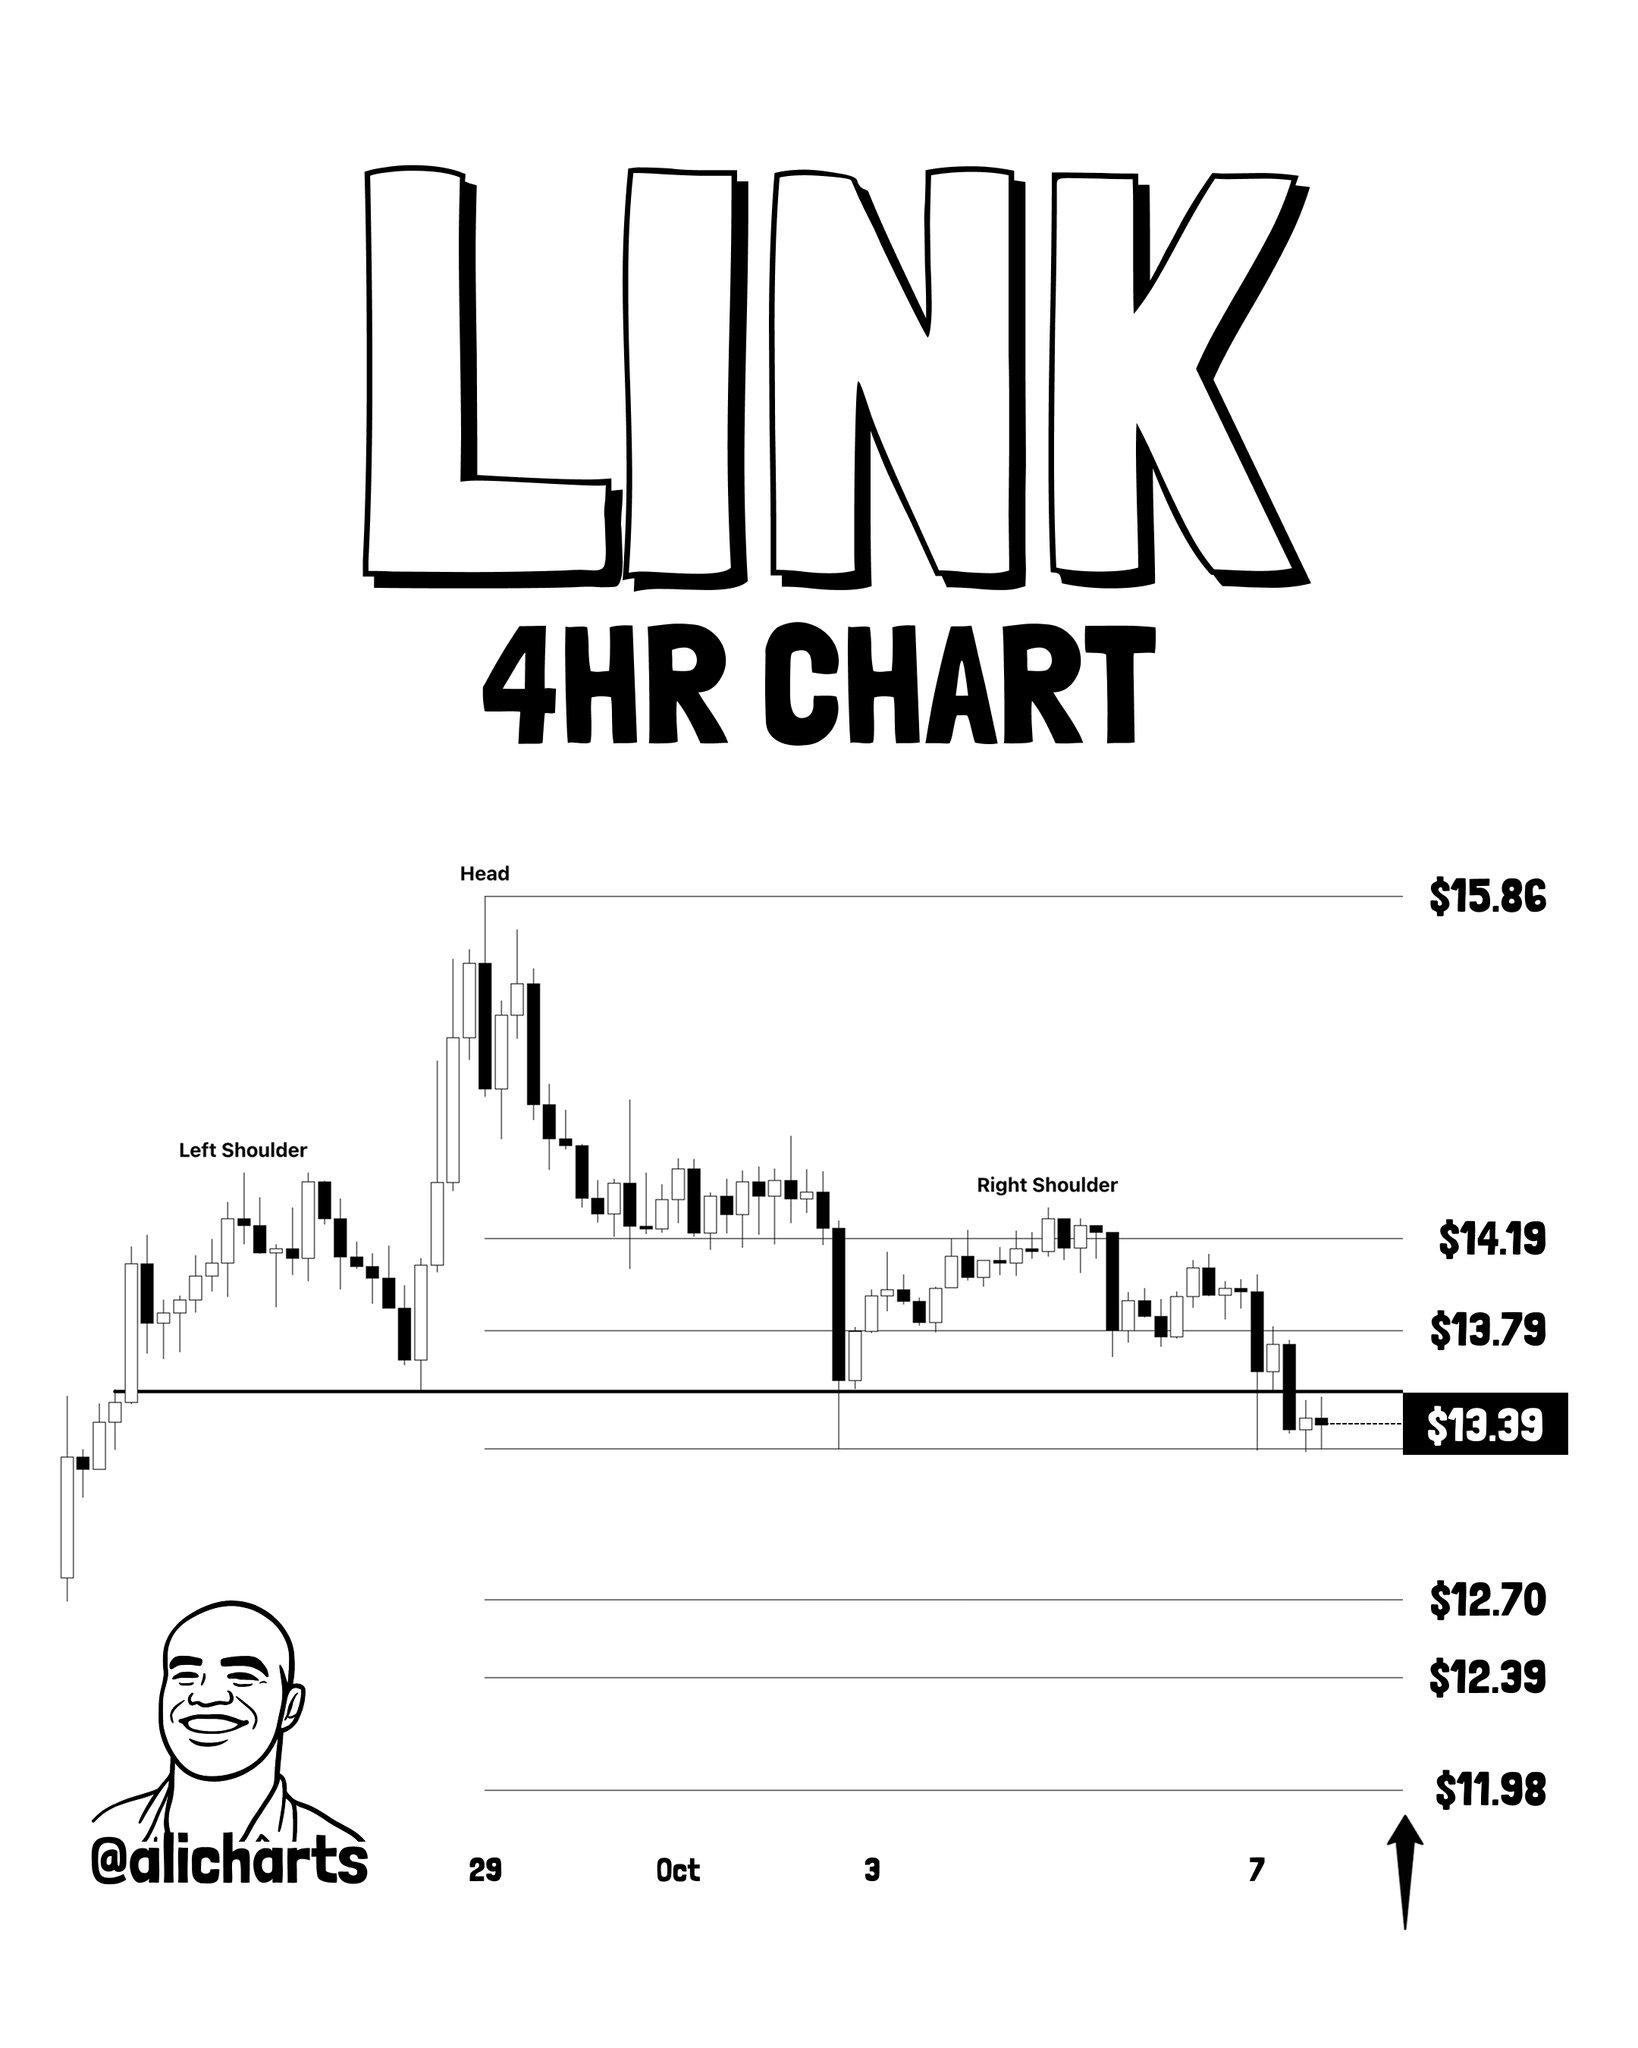
- LINK breaks H&S neckline on 4H chart — @alicharts flags $12.39 target while price holds below $13.56
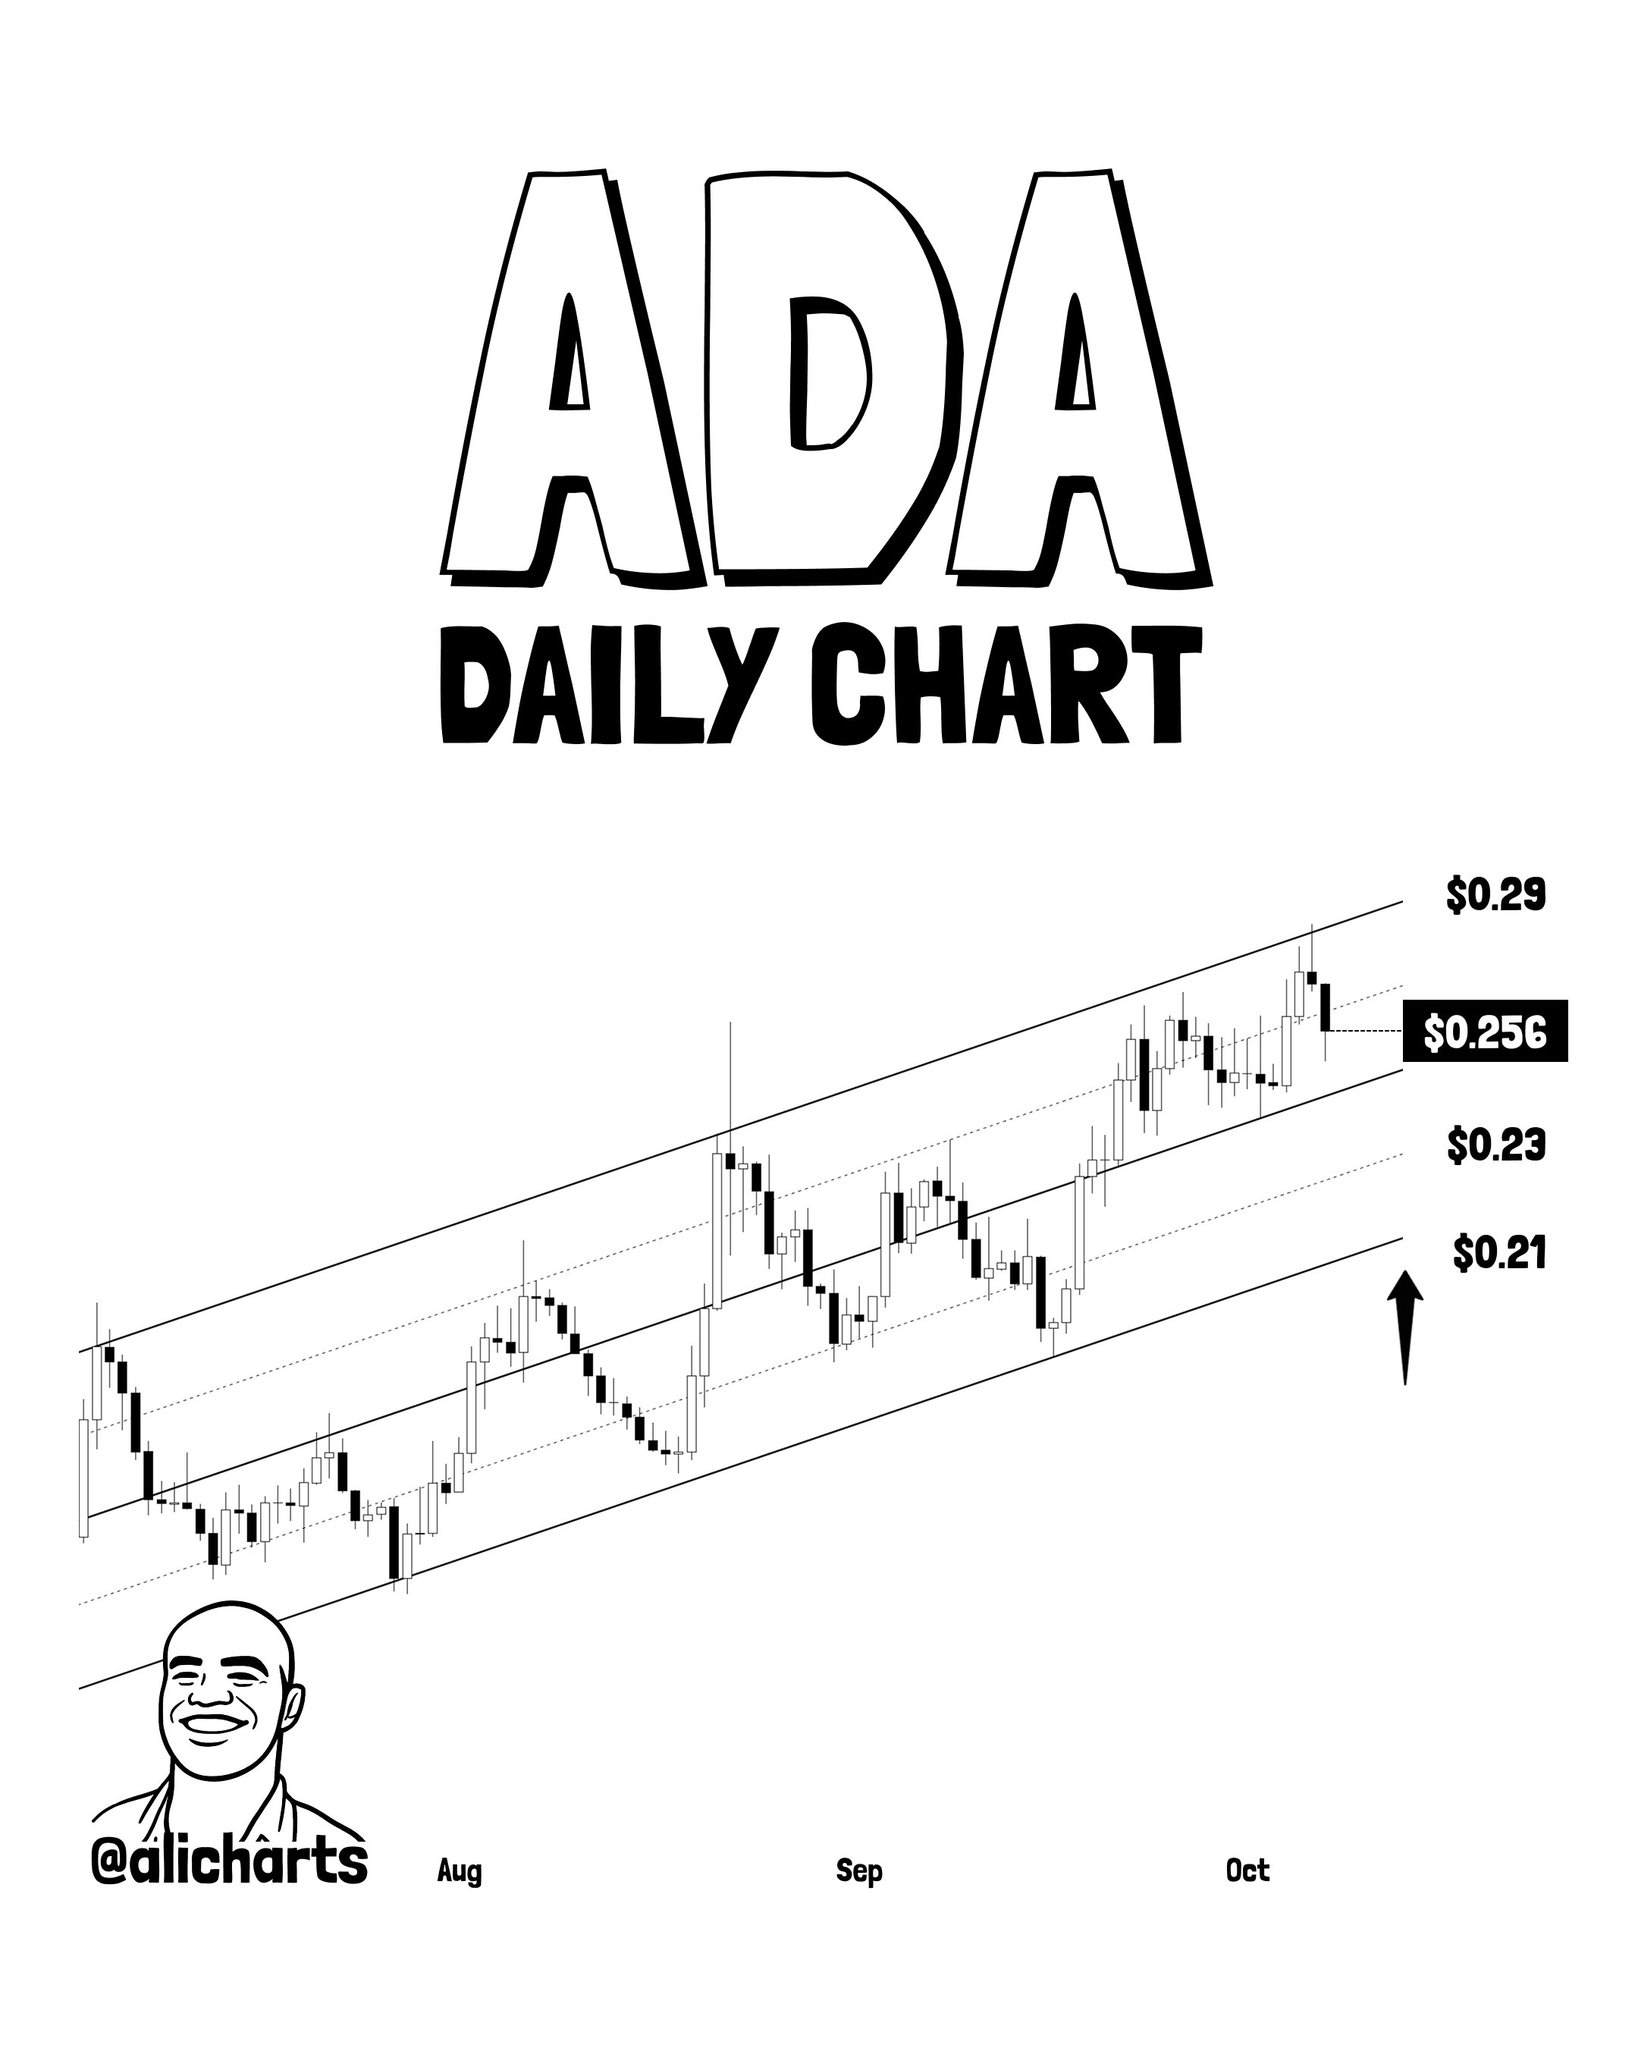
- ADA rejected at $0.29 ascending channel top — analyst targets $0.21 lower boundary if rejection holds
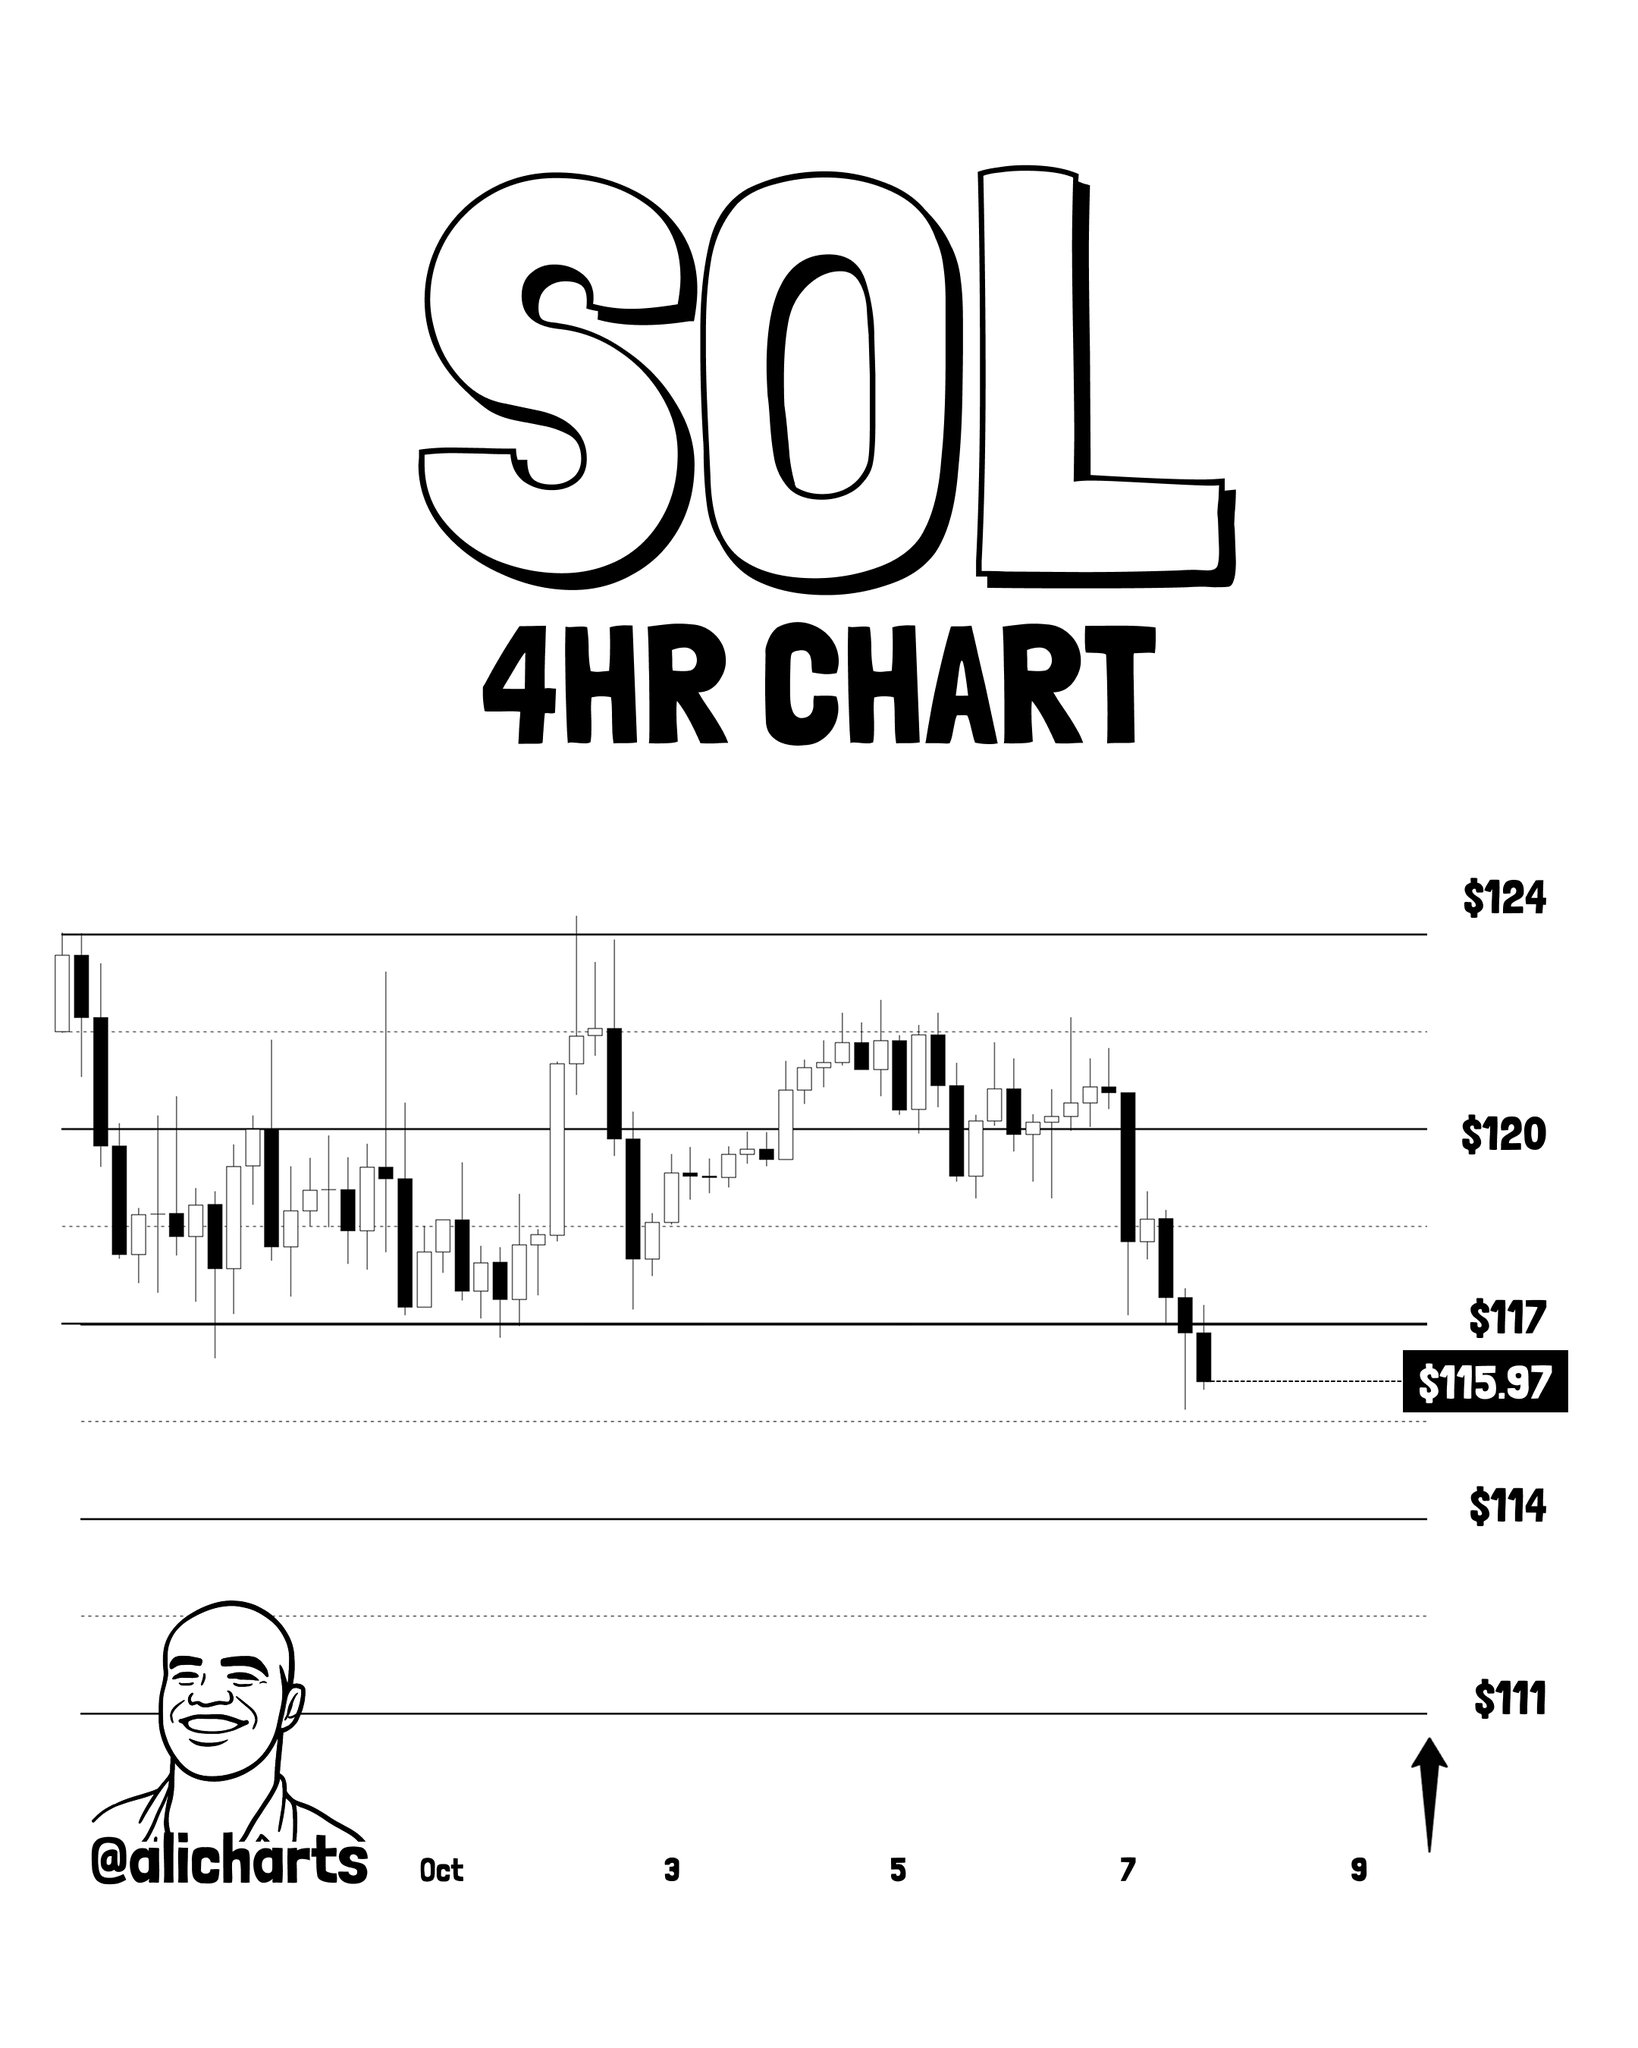
- SOL confirms 4H breakdown below $117 — next targets $114 then $111 per @alicharts thread
- SOL trading at $115.31, down 2.97% in 24h, market cap $67.9B at time of writing
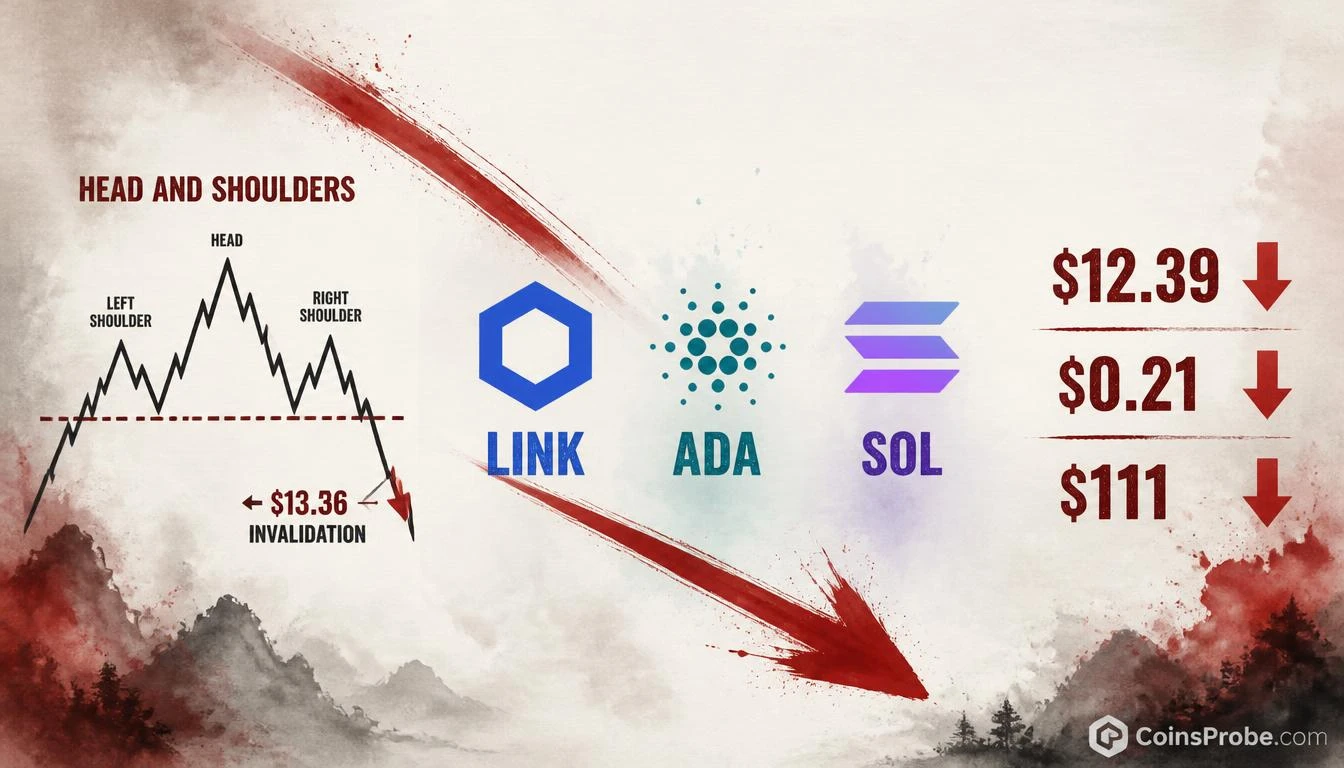
Three major altcoins are flashing simultaneous bearish technical setups — and one analyst is naming exact downside targets for each. Chainlink (LINK) is breaking below a Head and Shoulders neckline. Cardano (ADA) has been rejected at the top of an ascending channel. Solana (SOL) has confirmed a breakdown below key support, with the next level at $111. At the time of writing, Solana — whose live price is used as the tracked asset — is trading at $115.31, down 2.97% in the past 24 hours, with a market cap of approximately $67.9 billion.
The alerts come from crypto analyst Ali Martinez (@alicharts), who published a five-part thread flagging what he characterizes as coordinated bearish setups across the altcoin market. His exact words on the thread’s opening: “THESE CRYPTOS ARE ABOUT TO DUMP.” Each setup carries a specific invalidation level and one or more downside targets — not vague directional bias, but named price zones.
Signal 1 — Chainlink (LINK): Head and Shoulders Neckline Break
Chainlink’s 4-hour chart, flagged by @alicharts, shows a classic Head and Shoulders pattern with the head peaking near $15.86 and the neckline running beneath two flanking shoulders. The current price on the chart is annotated at $13.39 — at or below the neckline break point. The analyst is explicit about the condition: “As long as price stays below $13.56, the pattern points toward $12.39, with $11.98 as the next level to watch if selling continues.”
The structure is straightforward. The $13.56 level is the invalidation threshold. A sustained close below it keeps the bearish pattern active. The primary measured-move target is $12.39. If selling accelerates through that level, $11.98 becomes the secondary target. The chart labels three sequential support zones beneath the neckline: $12.70, $12.39, and $11.98 — each representing a potential staging point for sellers. No upside targets are given; the analyst’s thesis is conditional on price remaining below $13.56.
Signal 2 — Cardano (ADA): Ascending Channel Rejection
Cardano’s daily chart shows an ascending parallel channel spanning approximately August through October. Price reached the upper boundary near $0.29 and formed bearish rejection candles — a signal that the channel’s ceiling is acting as resistance rather than a breakout zone. At the time of the analysis, the chart annotates ADA’s price at $0.256. The analyst’s framing is conditional: “If that rejection holds, price could move toward the channel’s lower boundary.”
The lower boundary of the channel is labeled at $0.21 on the chart. A dotted midline runs through the structure, with $0.23 representing an intermediate level. The setup is a mean-reversion thesis within an established trend: price reached the upper extreme, rejected, and now faces a potential return toward the channel’s lower boundary. The setup is invalidated if ADA reclaims and holds above the $0.29 upper boundary.
Signal 3 — Solana (SOL): Support Breakdown Confirmed at $117
Solana’s 4-hour chart shows the sharpest and most immediate of the three setups. After ranging between support and resistance, SOL broke sharply below $117 on a 4-hour closing basis — the level the analyst identifies as the critical breakdown point. The chart annotates the current price at $115.97, with large bearish candles marking the breakdown sequence.
The analyst maps sequential downside targets below the breakdown: $114 is the immediate support. If $114 fails, $111 becomes the next target — flagged by an upward arrow on the chart’s lower right edge as a forward target zone. The chart explicitly labels $124, $120, $117, $115.97, $114, and $111 as the key price structure. The confirmed break of $117 activates the bearish sequence. A reclaim of $117 on a closing basis would negate the breakdown thesis.
For broader context on altcoin positioning, the CryptoQuant Analyst Consensus showing SOL at 92.9% bullish represents the on-chain counterargument — the technical breakdown and on-chain sentiment currently point in opposite directions for Solana.
What the Three Setups Share
Each of the three setups carries a named invalidation level, not just a directional bias. For LINK, it is $13.56. For ADA, it is a reclaim of $0.29. For SOL, it is a reclaim of $117 on a 4-hour close. @alicharts is not calling for indefinite downside on any of these — he is defining the precise condition under which the bearish case stays active. That specificity is what separates a technical breakdown call from a generic bearish take.
The timing of all three signals appearing simultaneously within a single analyst thread also matters for context. Altcoin weakness clustering across assets with different market caps and use cases — LINK at approximately $8–9B, ADA at multi-billion, SOL at $67.9B — suggests the pressure is sector-wide rather than asset-specific. Readers tracking recent altcoin volatility may also note the sharp divergence seen in altcoins posting 50%+ weekly gains — a reminder that the current market is highly selective.
Bullish Scenario
LINK reclaims $13.56 on a 4-hour close, invalidating the Head and Shoulders pattern and removing the measured-move target. ADA holds above $0.23 and breaks back toward $0.29, suggesting the channel rejection was a false breakdown. SOL reclaims $117, negating the confirmed breakdown and shifting structure back to range-bound.
Bearish Scenario
LINK sustains below $13.56, confirming progression toward $12.39 then $11.98. ADA’s rejection at $0.29 holds with follow-through toward $0.23 and $0.21. SOL loses $114 after the $117 breakdown, opening the move to $111 — the analyst’s stated secondary target.
Three altcoins, three distinct chart patterns, three sets of named price levels — all flagged in the same thread by @alicharts on October 8. The setups are conditional, not directional absolutes. For LINK, the number to watch is $13.56. For ADA, $0.29. For SOL, $117 — and below that, whether $114 holds or cedes to $111.
Frequently Asked Questions
What is the Head and Shoulders invalidation level for Chainlink (LINK)?
What are Solana’s downside targets after the $117 breakdown?
Where does Cardano need to hold to avoid a deeper pullback?
Are these three setups independent or driven by the same macro factor?
Source: Ali Charts · Published by CoinsProbe Markets Desk
The opinions and market insights shared on CoinsProbe represent the views of individual authors based on prevailing market conditions at the time of publication. Cryptocurrency investments carry significant risk and volatility. Readers are encouraged to conduct their own research and seek professional financial advice before making investment decisions. CoinsProbe and its contributors do not accept responsibility for financial losses or decisions made based on published content.
CoinsProbe may publish sponsored articles, affiliate links, or promotional collaborations. All sponsored material is clearly labeled to maintain transparency with our audience. Our editorial decisions remain fully independent, and advertising partnerships do not influence reviews, rankings, or published opinions.
Since 2023, CoinsProbe has delivered reliable insights on cryptocurrency, blockchain, and digital assets. Our content is created by experienced researchers and analysts who follow strict editorial standards focused on accuracy, transparency, and credibility. Every article is carefully reviewed and verified using trusted sources and current market data. We provide unbiased analysis and timely updates covering everything from emerging crypto projects to major industry developments.