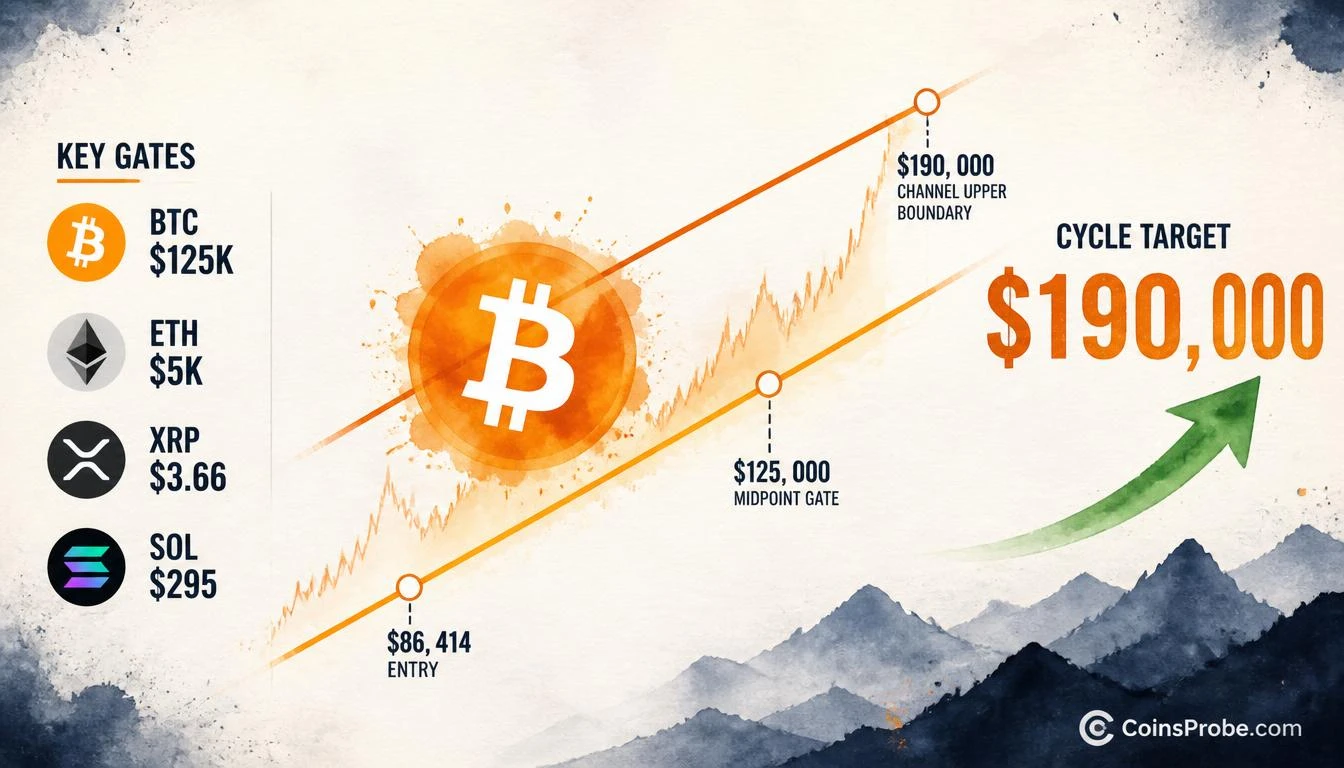
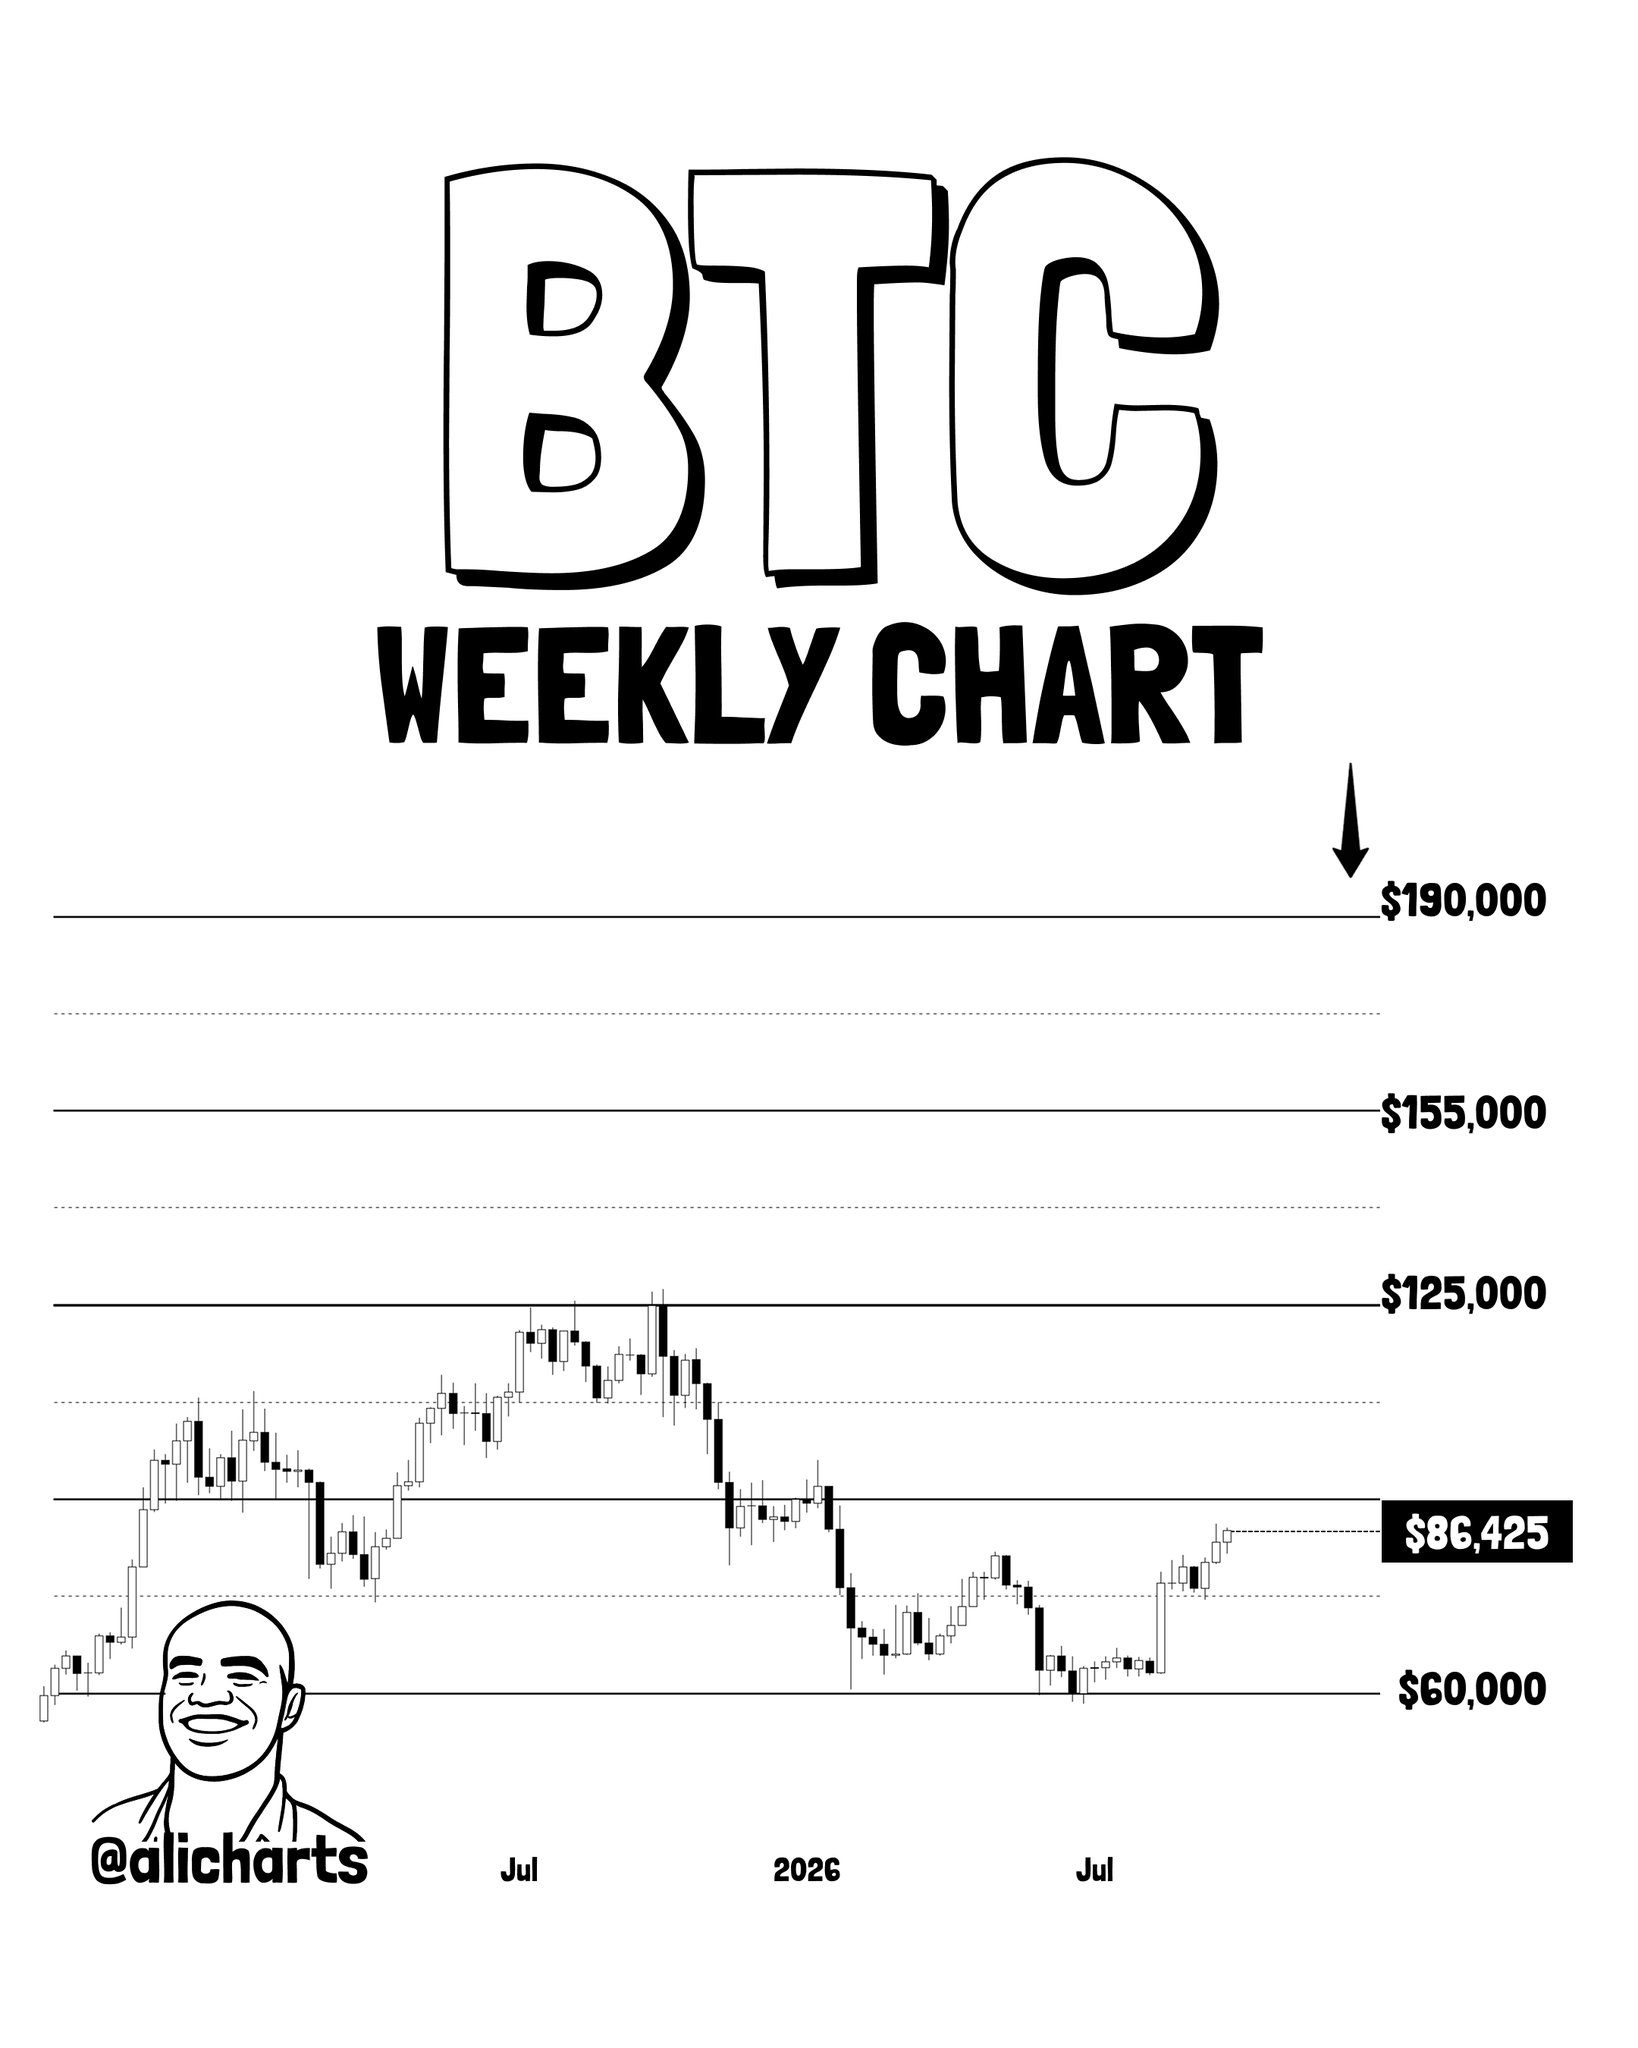
- Bitcoin trading at $86,414 (+3.23%) inside a two-year rising channel — cycle target at $190,000 per @alicharts
- $125,000 is BTC's critical gate — a decisive monthly close above it is required before $190,000 enters scope (+45% from current)
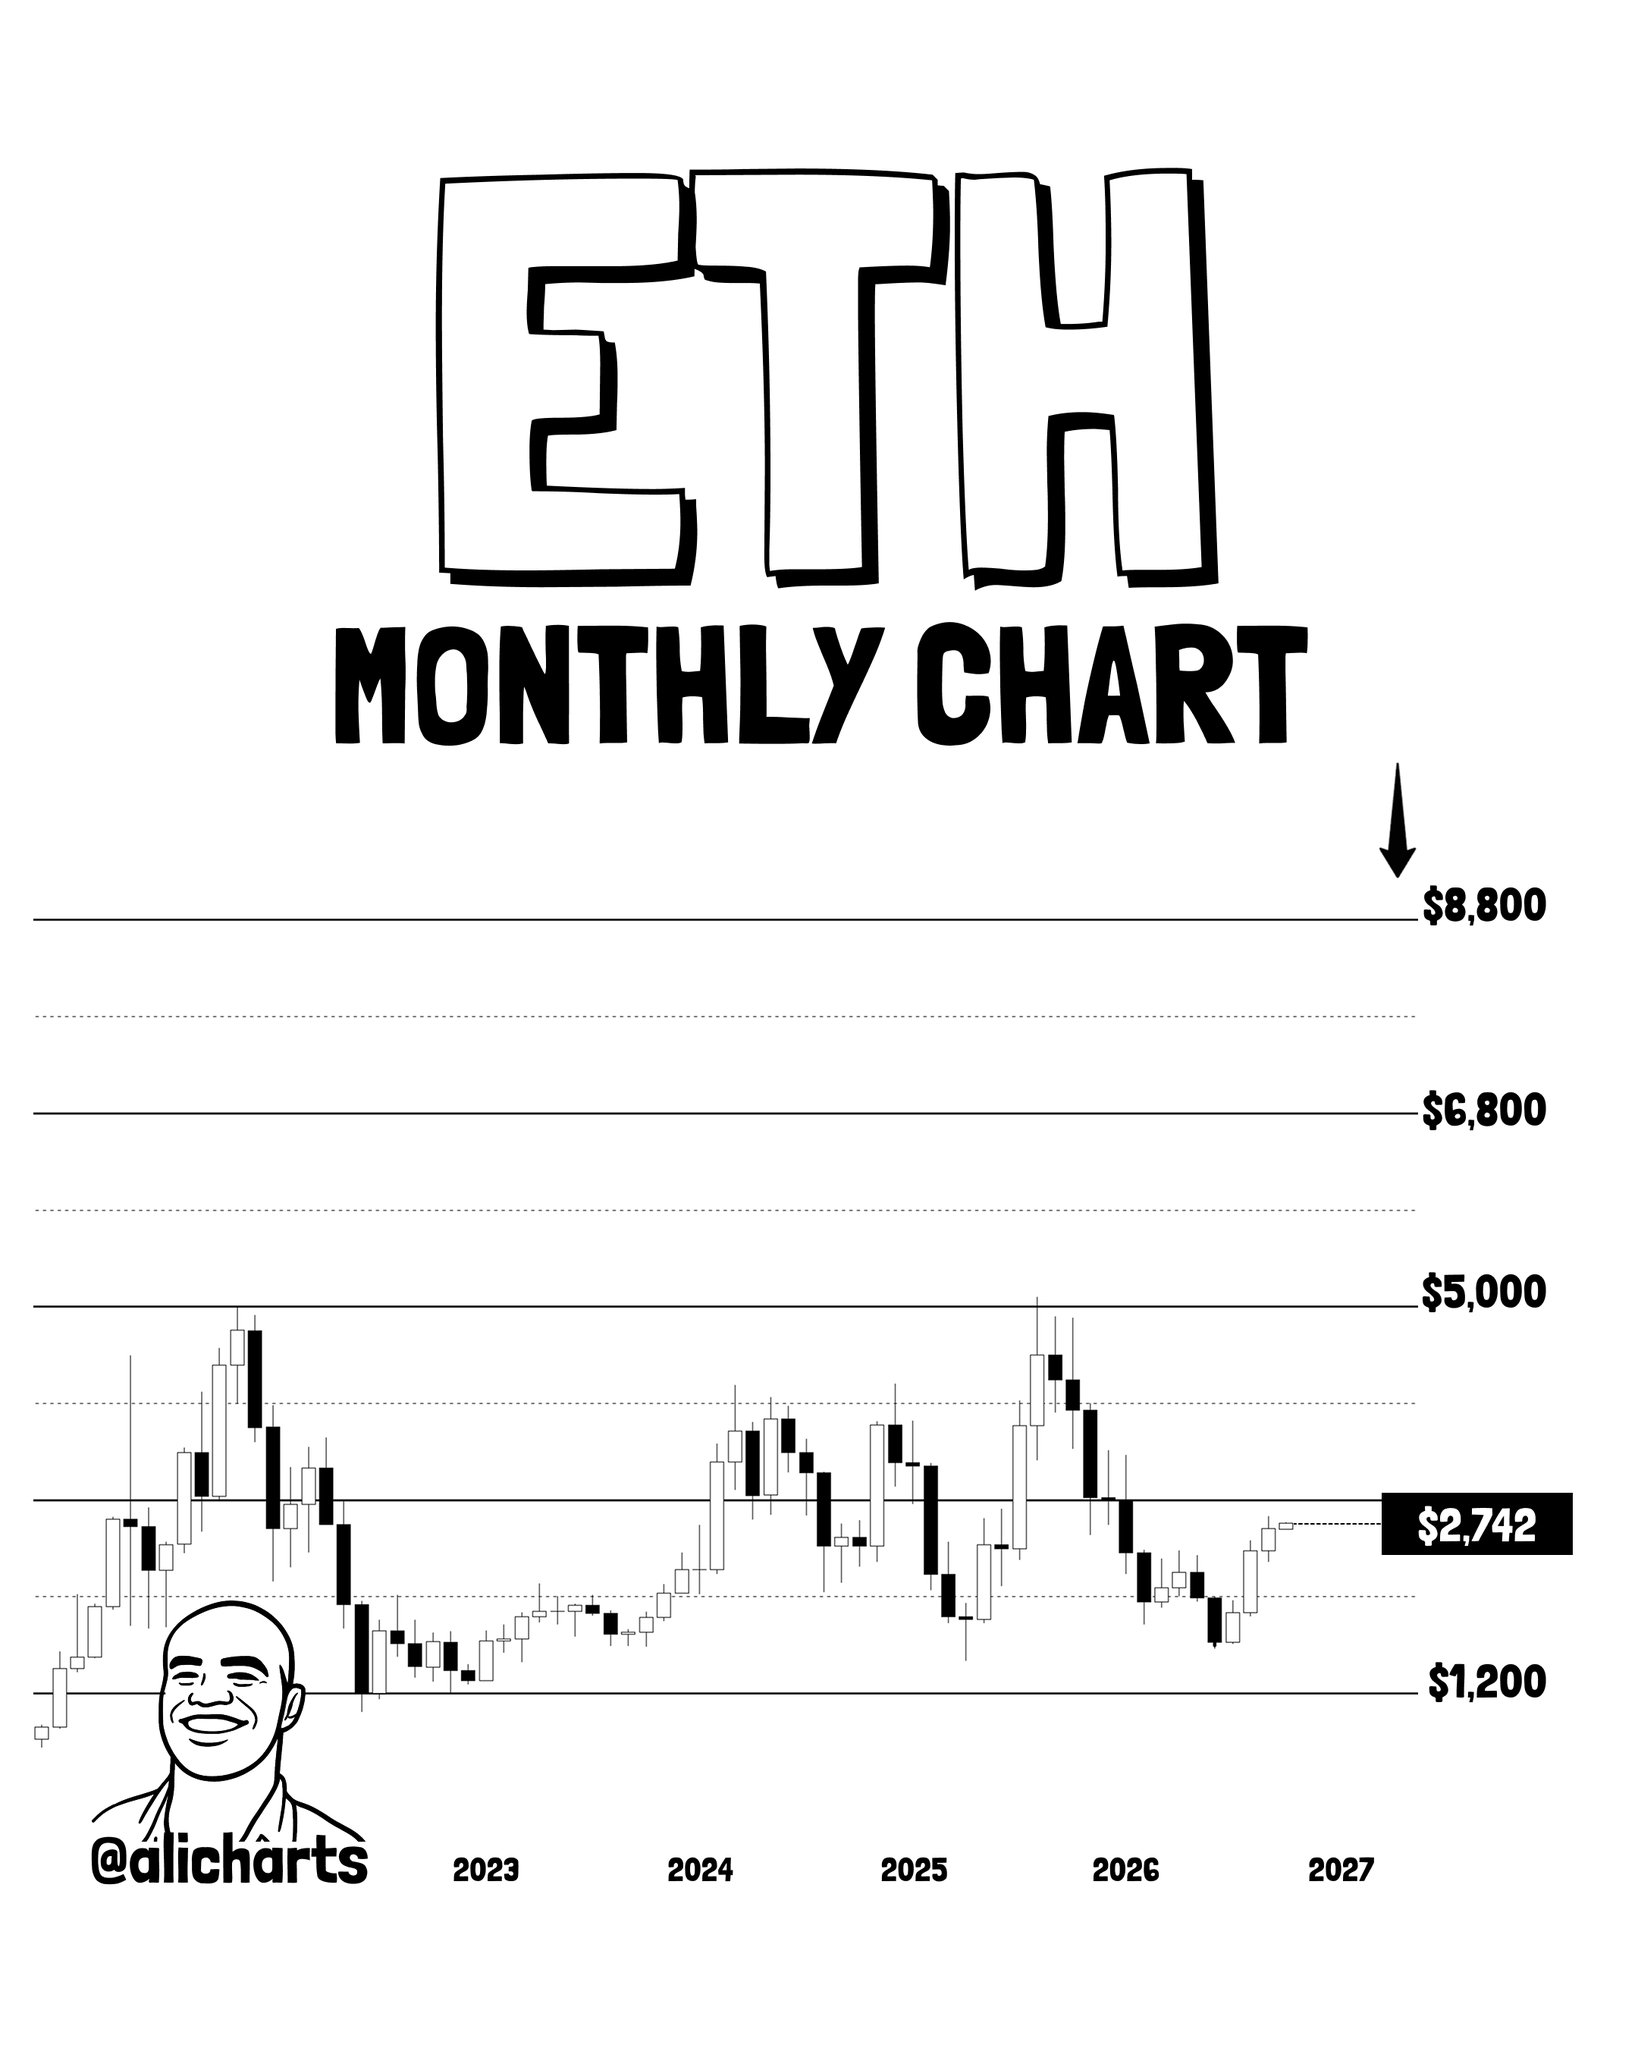
- ETH needs monthly close above $5,000 (+82%) for $8,800 target; XRP needs $3.66 (+139%) for $9.49–$31.87 targets
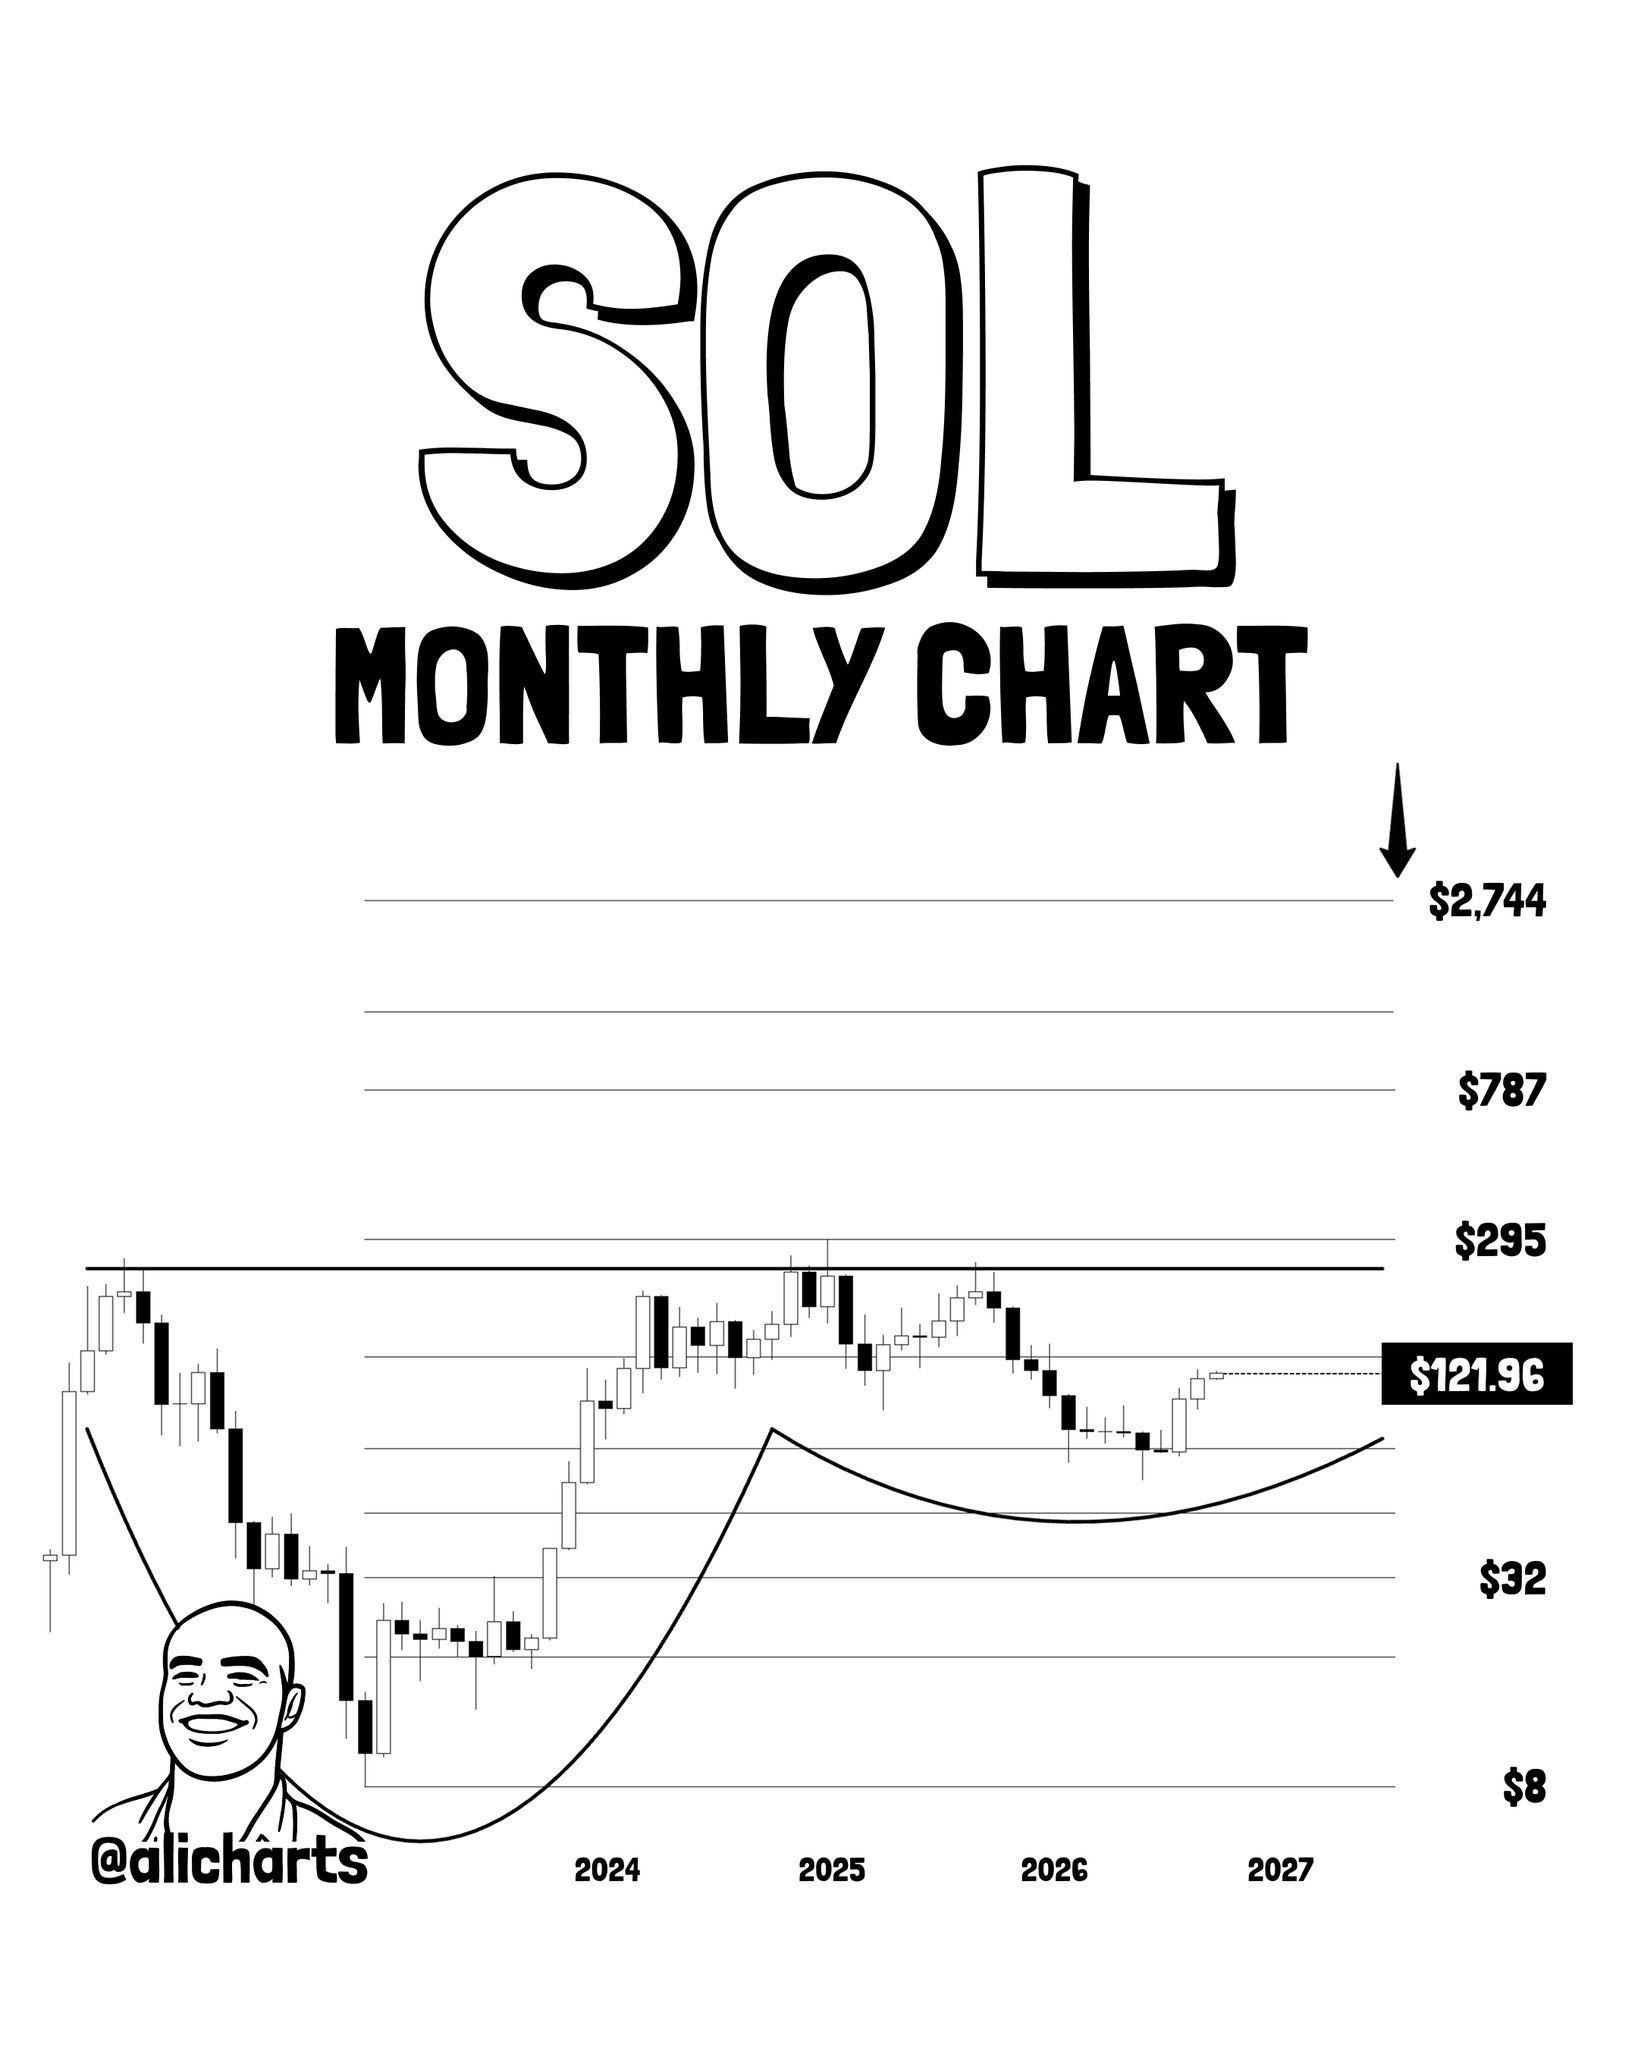
- SOL cup-and-handle neckline at $295 (+142%) — full pattern projects $2,744 on a multi-year timeline to 2027
Bitcoin is trading at $86,414 — up 3.23% in the past 24 hours — with a market cap of $1.74 trillion. Underneath that number sits a two-year rising channel structure that, if it holds, projects a cycle target of $190,000. That is not a speculative price call. It is the measured upper boundary of a channel that has contained every major BTC swing since 2024.
The observation comes from analyst Ali Martinez (@alicharts), who published a five-asset thread on October 2, 2026, mapping long-term channel structures across Bitcoin, Ethereum, XRP, and Solana. His conclusion on BTC: “Bitcoin appears to have traded within a rising channel for the past two years. The first test is its previous high near $125,000. A decisive break above it could put the channel’s upper boundary near $190,000 in focus as a potential cycle target.”
Signal 1 — Bitcoin: Two-Year Rising Channel, $125K Is the Gate
The weekly chart shared by @alicharts frames the current BTC setup with precision. Price pulled back from the previous cycle high near $125,000 to a major floor near $60,000, and has since recovered to approximately $86,414 — still inside the channel, still above the rising trendline support. The structure is intact.
The mechanics are straightforward. The channel’s lower boundary held at $60,000. Price is now mid-channel. The next test is the previous high at $125,000 — a resistance zone that doubles as the channel’s mid-line inflection. A decisive monthly close above $125,000 removes that ceiling and opens the measured move to the channel’s upper boundary at $190,000.
From current levels, the move to $125,000 requires a +45% advance. The full channel target at $190,000 represents a +120% move from $86,414. Neither is priced in today. Both are contingent on the $125K reclaim holding as support, not just being touched intraday.
This BTC setup does not exist in isolation. As noted in recent on-chain coverage, Bitcoin’s net realized profit recently hit $10.7B — its highest reading since November 2025, suggesting genuine profit-taking pressure at current levels that any sustained rally toward $125K will need to absorb. Separately, 1-3 month holders are sitting on 24% unrealized profit — a cohort that historically begins distributing as price approaches prior highs.
Signal 2 — Ethereum: Five-Year Channel, $5,000 Is the Line
Ethereum’s monthly chart extends the analytical frame beyond Bitcoin’s two-year window. @alicharts identifies a multi-year horizontal channel spanning more than five years, with a clearly defined upper boundary near $5,000 and a lower boundary near $1,200. ETH is currently trading near $2,742 — mid-channel, with room in both directions.
The channel’s upper boundary at $5,000 is the critical level. A confirmed monthly close above it does not merely represent a new high — it represents a breakout from a five-year compression structure, with the projected move pointing toward $8,800. From $2,742, the path breaks down as follows: channel resistance at $5,000 requires a +82% move, an intermediate projection at $6,800 requires +148%, and the full breakout target at $8,800 represents +221% from current price.
The qualifier is explicit in @alicharts’ analysis: $5,000 remains a rejection zone until a monthly close above it confirms the breakout. Intraday tests do not count. A weekly wick does not count. The trigger is a sustained monthly closing price above $5,000 — not a touch, not a spike. Until that confirms, $5,000 acts as resistance, not a launching pad.
Signal 3 — XRP: Ascending Triangle, $3.66 Is the Trigger
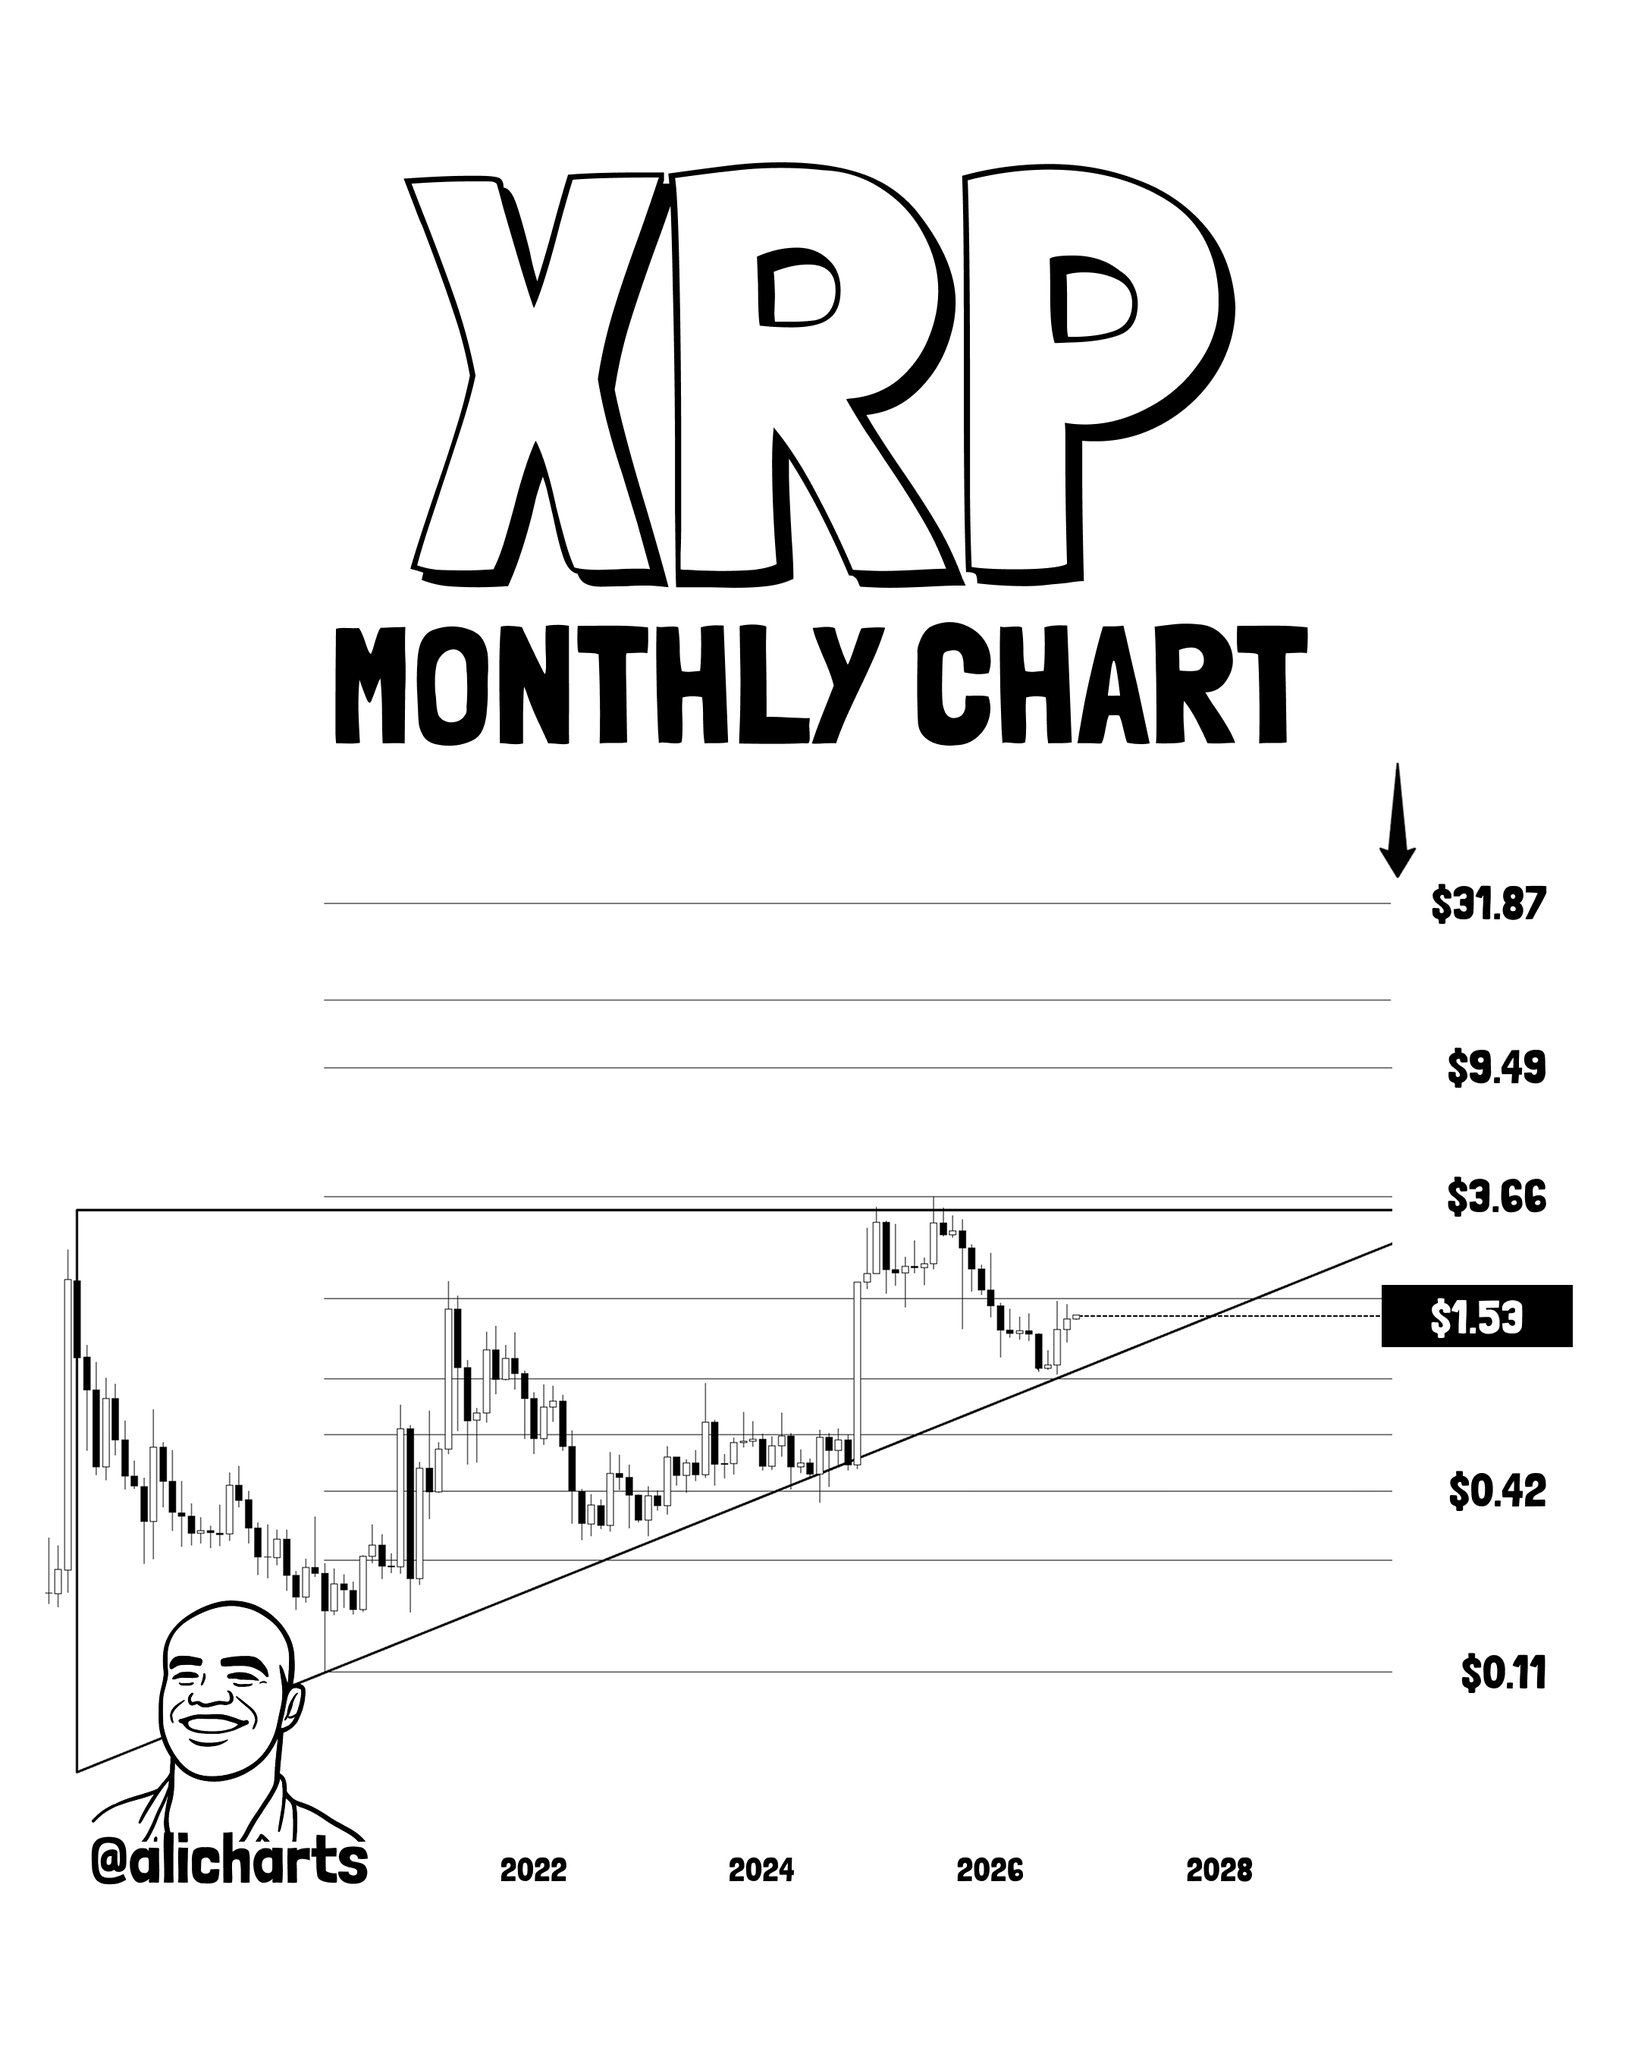
XRP’s monthly chart presents the most structurally defined setup of the four. @alicharts identifies a textbook ascending triangle — flat resistance at $3.66 with a rising trendline support from 2022 lows. XRP is currently consolidating near $1.53, below the triangle’s resistance ceiling.
The breakout trigger is a monthly close above $3.66. If confirmed, the pattern projects two targets: $9.49 and $31.87. From current $1.53, those represent moves of +520% and +1,983% respectively. The distance to the trigger itself — $3.66 — requires a +139% move from current price.
As covered in prior XRP analysis, the $3.66 monthly close is the key threshold — not an intraday touch, not a weekly close. A sustained monthly closing price above that level is what confirms the ascending triangle and puts the extended targets in play. The risk in any ascending triangle is that resistance holds and price breaks downward through the rising trendline. Support levels on this structure sit at $0.42 and $0.11.
Signal 4 — Solana: Cup and Handle, $295 Neckline Unbroken
The fourth chart in @alicharts’ thread is SOL’s monthly cup and handle. The cup bottom formed during 2023 bear market lows near $8, with the rim and neckline resistance sitting at $295. SOL is currently trading at $121.96 — below neckline, potentially forming the handle phase of the pattern.
The setup’s two-stage target structure is precise. A monthly close above $295 confirms the pattern and opens an intermediate target at $787, representing a +546% move from $121.96. The full measured move projects to $2,744 — a +2,150% move from current price on a timeline that @alicharts extends toward 2027. SOL has already printed a substantial recovery from its $8 bear market lows — approximately +1,425% to the current $121.96. The remaining move, if confirmed, would be the second and larger leg of the cup’s breakout.
Without a monthly close above $295, the handle phase continues — or fails. High-risk, long-timeframe setup. The neckline is everything.
The Common Thread Across All Four Charts
@alicharts’ thread maps a consistent structural logic across four assets with very different risk profiles. Each chart identifies one critical level — a gate that separates the current setup from the extended target. None of the extended targets are accessible without first clearing that gate.
| Asset | Price | Break level | Move to break | Cycle target | Move to target |
|---|---|---|---|---|---|
| BTC | $86,414 | $125,000 | +45% | $190,000 | +120% |
| ETH | $2,742 | $5,000 | +82% | $8,800 | +221% |
| XRP | $1.53 | $3.66 | +139% | $9.49 / $31.87 | +520% / +1,983% |
| SOL | $121.96 | $295 | +142% | $787 / $2,744 | +546% / +2,150% |
Source: @alicharts (X) — All targets are future projections, not completed moves. Monthly close confirmations required at each gate level.
None of these are completed moves. Every percentage in the target column is a potential future outcome contingent on a specific monthly closing confirmation. This matters: a chart target without a trigger condition is not a trade — it is a scenario. @alicharts frames each one with its specific trigger, which is what separates this thread from generic price speculation.
It is also worth flagging the on-chain demand context. Recent data shows Bitcoin demand has diverged from price — a 980K BTC divergence signal that has historically preceded consolidation or correction phases. A channel target at $190K and a demand divergence warning are not mutually exclusive — they define the risk parameters of the same setup.
Bullish Scenario
Bitcoin posts a decisive monthly close above $125,000, confirming channel continuation. ETH follows with a sustained monthly close above $5,000. XRP clears $3.66 on a monthly basis, triggering the ascending triangle. SOL reclaims $295 on a monthly close. In this sequence, all four cycle targets — $190K, $8,800, $9.49–$31.87, $787–$2,744 — move from scenario to probability framework. The gates are sequential: BTC’s $125K is the first and most important confirmation in the chain.
Bearish Scenario
Bitcoin fails to reclaim $125,000 and loses the rising channel’s trendline, risking a retest of the $60,000 major floor. ETH at $5,000 holds as rejection. XRP’s ascending triangle breaks downward toward $0.42 support. SOL’s handle extends or breaks, threatening a return toward the $32 support zone. In this scenario, none of the cycle targets are accessible and each channel structure requires reassessment.
The full thread from @alicharts frames a multi-cycle map that is data-anchored and trigger-specific. BTC’s $125,000 is the first gate — and the most consequential one. A monthly close above it does not just open $190,000 for Bitcoin. It validates the structural thesis across all four assets simultaneously. Watch BTC’s monthly close price above $125,000 as the single most important confirmation level in this macro setup.
Frequently Asked Questions
What is the $125,000 level and why does it matter for Bitcoin’s $190,000 target?
Does the ascending triangle on XRP guarantee a move to $31.87?
What is the Solana cup-and-handle neckline and when would the pattern confirm?
Are the ETH $8,800, XRP $31.87, and SOL $2,744 targets completed moves or future projections?
Source: Ali Charts · Published by CoinsProbe Markets Desk
The opinions and market insights shared on CoinsProbe represent the views of individual authors based on prevailing market conditions at the time of publication. Cryptocurrency investments carry significant risk and volatility. Readers are encouraged to conduct their own research and seek professional financial advice before making investment decisions. CoinsProbe and its contributors do not accept responsibility for financial losses or decisions made based on published content.
CoinsProbe may publish sponsored articles, affiliate links, or promotional collaborations. All sponsored material is clearly labeled to maintain transparency with our audience. Our editorial decisions remain fully independent, and advertising partnerships do not influence reviews, rankings, or published opinions.
Since 2023, CoinsProbe has delivered reliable insights on cryptocurrency, blockchain, and digital assets. Our content is created by experienced researchers and analysts who follow strict editorial standards focused on accuracy, transparency, and credibility. Every article is carefully reviewed and verified using trusted sources and current market data. We provide unbiased analysis and timely updates covering everything from emerging crypto projects to major industry developments.