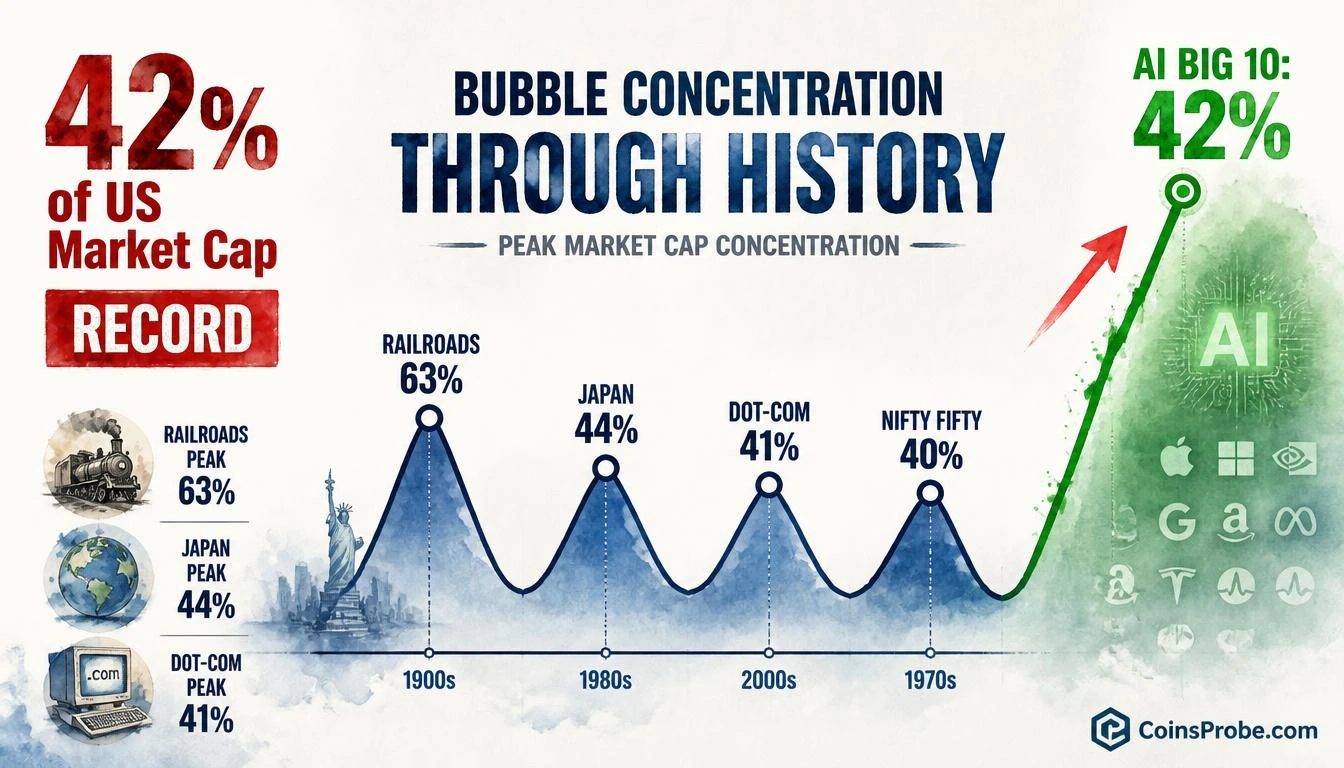

- AI Big 10 hits record 42% of US stock market cap — more than double the 2022 bear market low
- 42% exceeds Dot-Com bubble peak (41%), Nifty Fifty peak (40%), and Japan's MSCI ACWI peak (44%) — per The Kobeissi Letter
- Group includes Mag 7 plus Broadcom ($AVGO), AMD ($AMD), and Micron ($MU) — chart shows curve still ascending with no peak confirmed
The ten largest AI-linked stocks in the United States now account for a record 42% of total US stock market capitalization, according to The Kobeissi Letter — a concentration level that has now surpassed every major market bubble peak in modern financial history except the 1835 railroad mania.
The group — dubbed the “AI Big 10” — comprises the Magnificent 7 (Apple, Microsoft, Nvidia, Amazon, Alphabet, Meta, Tesla) plus Broadcom ($AVGO), AMD ($AMD), and Micron ($MU). Their combined share of US market cap has more than doubled since the 2022 bear market low.
How It Compares to Prior Bubbles
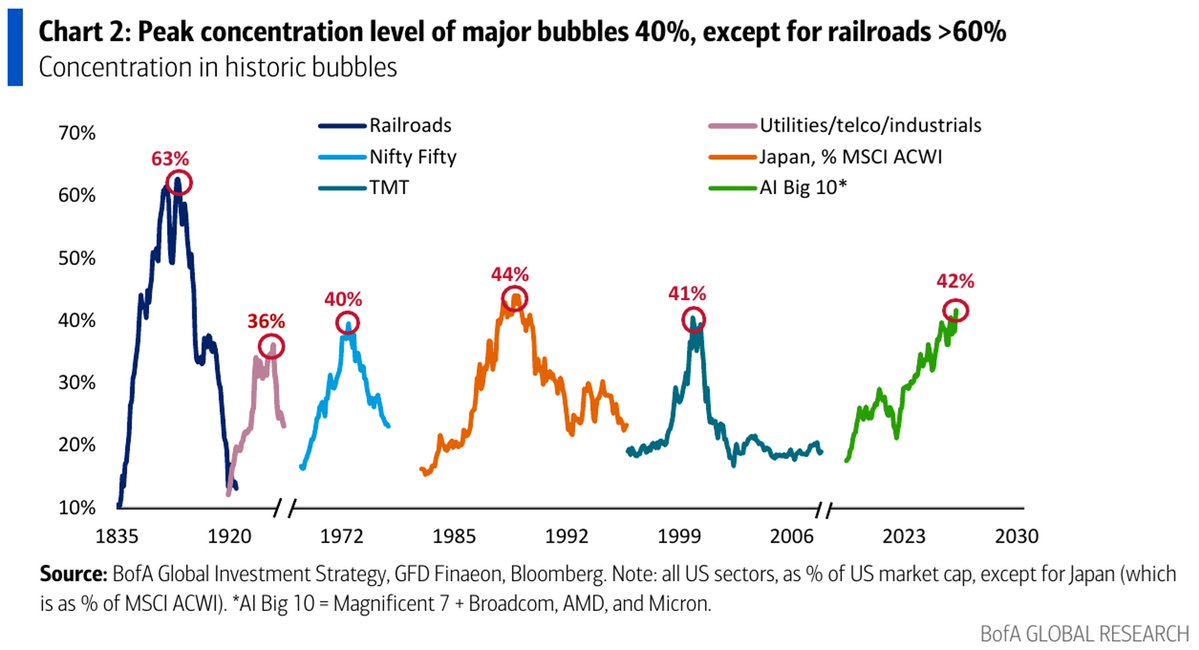
The Kobeissi Letter’s chart maps concentration levels across every major historical market bubble since 1835. The AI Big 10’s current 42% reading exceeds the TMT (Dot-Com) bubble peak of 41% in 1999–2000, the Nifty Fifty peak of 40% in 1972, and Japan’s peak share of MSCI ACWI at 44% in 1989. The only historical precedent with a higher reading is the 1835 railroad mania at 63%.
| Bubble | Peak Concentration | Year |
|---|---|---|
| Railroads | 63% | ~1835 |
| Japan / MSCI ACWI | 44% | ~1989 |
| TMT (Dot-Com) | 41% | ~1999 |
| Nifty Fifty | 40% | ~1972 |
| Utilities/Telco/Industrials | 36% | ~1920 |
| AI Big 10 (current) | 42% | 2024–present |
Source: The Kobeissi Letter / @KobeissiLetter (X)
Critically, the chart shows every prior bubble resolved with a sharp decline after peaking. The AI Big 10 curve is still ascending — no peak or reversal is yet visible on the chart.
What This Does and Doesn’t Mean
Concentration at this level is a structural condition, not a timing signal. Prior bubbles peaked at comparable concentration before significant drawdowns — but the lag between peak concentration and actual price breakdown varied by years, not weeks. The Dot-Com peak at 41% was followed by an eventual 78% Nasdaq decline, but the index continued higher for months after concentration peaked. What the data confirms: the AI Big 10 now represents a systemic risk concentration in US equities not seen since railroad dominance nearly two centuries ago.
For crypto markets, the macro implication is direct. A sudden repricing of large-cap US tech — which has historically correlated with Bitcoin during risk-off episodes — would represent one of the more significant exogenous shocks the digital asset market could face. Investors tracking broader risk-on/risk-off dynamics should note this reading. For context on how institutional capital is already rotating into alternative on-chain structures, see Solana Gets Its First Japanese Equity Strategy — SBI and DigiFT Launch JX On-Chain.
Frequently Asked Questions
Which stocks make up the AI Big 10?
How does the AI Big 10’s 42% concentration compare to the Dot-Com bubble?
Does record concentration mean an imminent crash?
Source: Kobeissiletter · Published by CoinsProbe Markets Desk
The opinions and market insights shared on CoinsProbe represent the views of individual authors based on prevailing market conditions at the time of publication. Cryptocurrency investments carry significant risk and volatility. Readers are encouraged to conduct their own research and seek professional financial advice before making investment decisions. CoinsProbe and its contributors do not accept responsibility for financial losses or decisions made based on published content.
CoinsProbe may publish sponsored articles, affiliate links, or promotional collaborations. All sponsored material is clearly labeled to maintain transparency with our audience. Our editorial decisions remain fully independent, and advertising partnerships do not influence reviews, rankings, or published opinions.
Since 2023, CoinsProbe has delivered reliable insights on cryptocurrency, blockchain, and digital assets. Our content is created by experienced researchers and analysts who follow strict editorial standards focused on accuracy, transparency, and credibility. Every article is carefully reviewed and verified using trusted sources and current market data. We provide unbiased analysis and timely updates covering everything from emerging crypto projects to major industry developments.