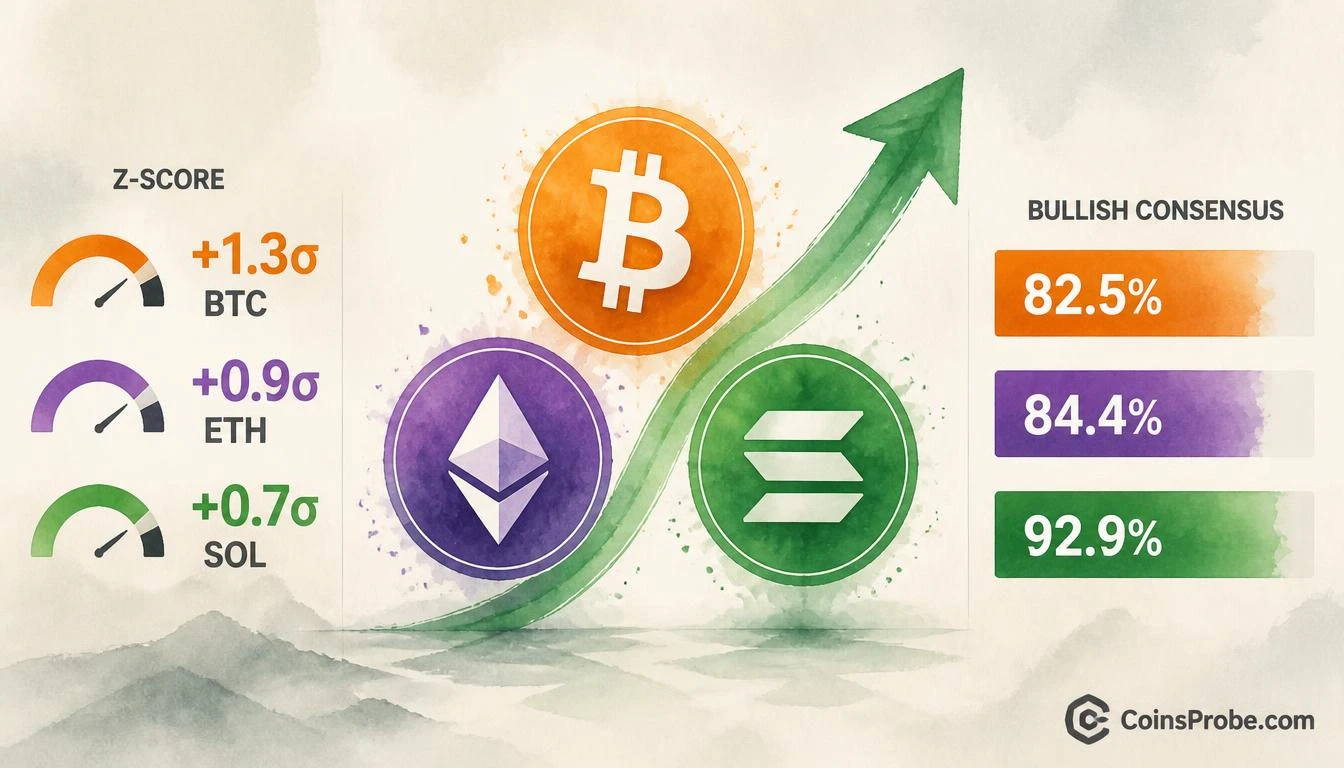

- CryptoQuant Analyst Consensus, now covering 1,708 assets, shows Solana at 92.9% bullish as of October 5, 2026
- Bitcoin registers 82.5% bullish at +1.3σ — highest Z-score of the three — driven by institutional inflows and monetary easing expectations
- Ethereum at 84.4% bullish (+0.9σ) with dominant narrative: settlement layer for institutional and private finance
- All three assets simultaneously above the +0.7σ statistically elevated threshold — cross-asset professional conviction reading
Solana is trading at $120.78 (+0.37% in the past 24 hours) with a market cap of $71.07 billion — and the broadest analyst consensus dataset in CryptoQuant’s history is pointing decisively bullish across all three major Layer 1 assets. As of October 5, 2026, CryptoQuant’s upgraded Analyst Consensus platform — now covering 1,708 assets — shows Bitcoin at 82.5% bullish, Ethereum at 84.4% bullish, and Solana at 92.9% bullish. That final number is the standout: nearly 93 in 100 analysts tracked by CryptoQuant are currently positioned bullishly on SOL.
The data comes directly from CryptoQuant (@cryptoquant_com), which announced the platform upgrade on October 6, 2026, stating: “CryptoQuant Analyst Consensus just got an upgrade. Now covering 1,708 assets.” The readings are expressed as monthly relative Z-score sentiment indices — measuring where current analyst positioning sits relative to its own historical distribution. A Z-score of +0.7σ or higher signals consensus has crossed into statistically meaningful bullish territory. All three assets are currently above that threshold.
Signal 1 — Bitcoin: 82.5% Bullish at +1.3σ
Bitcoin’s Analyst Consensus is registering a Z-score of +1.3σ bullish as of October 5, 2026 — the highest reading among the three assets in absolute Z-score terms. The monthly chart shows a price line that turned sharply green (bullish) after a red correction from the cycle peak near $120,000, with the sentiment index now reflecting what CryptoQuant’s analyst base characterizes as a macro and structural setup: “Institutional inflows and easier monetary policy ahead.” That framing directly contrasts the prior bearish phase, which was labeled on the chart as a period of “regulatory void and fading institutional/retail demand.”
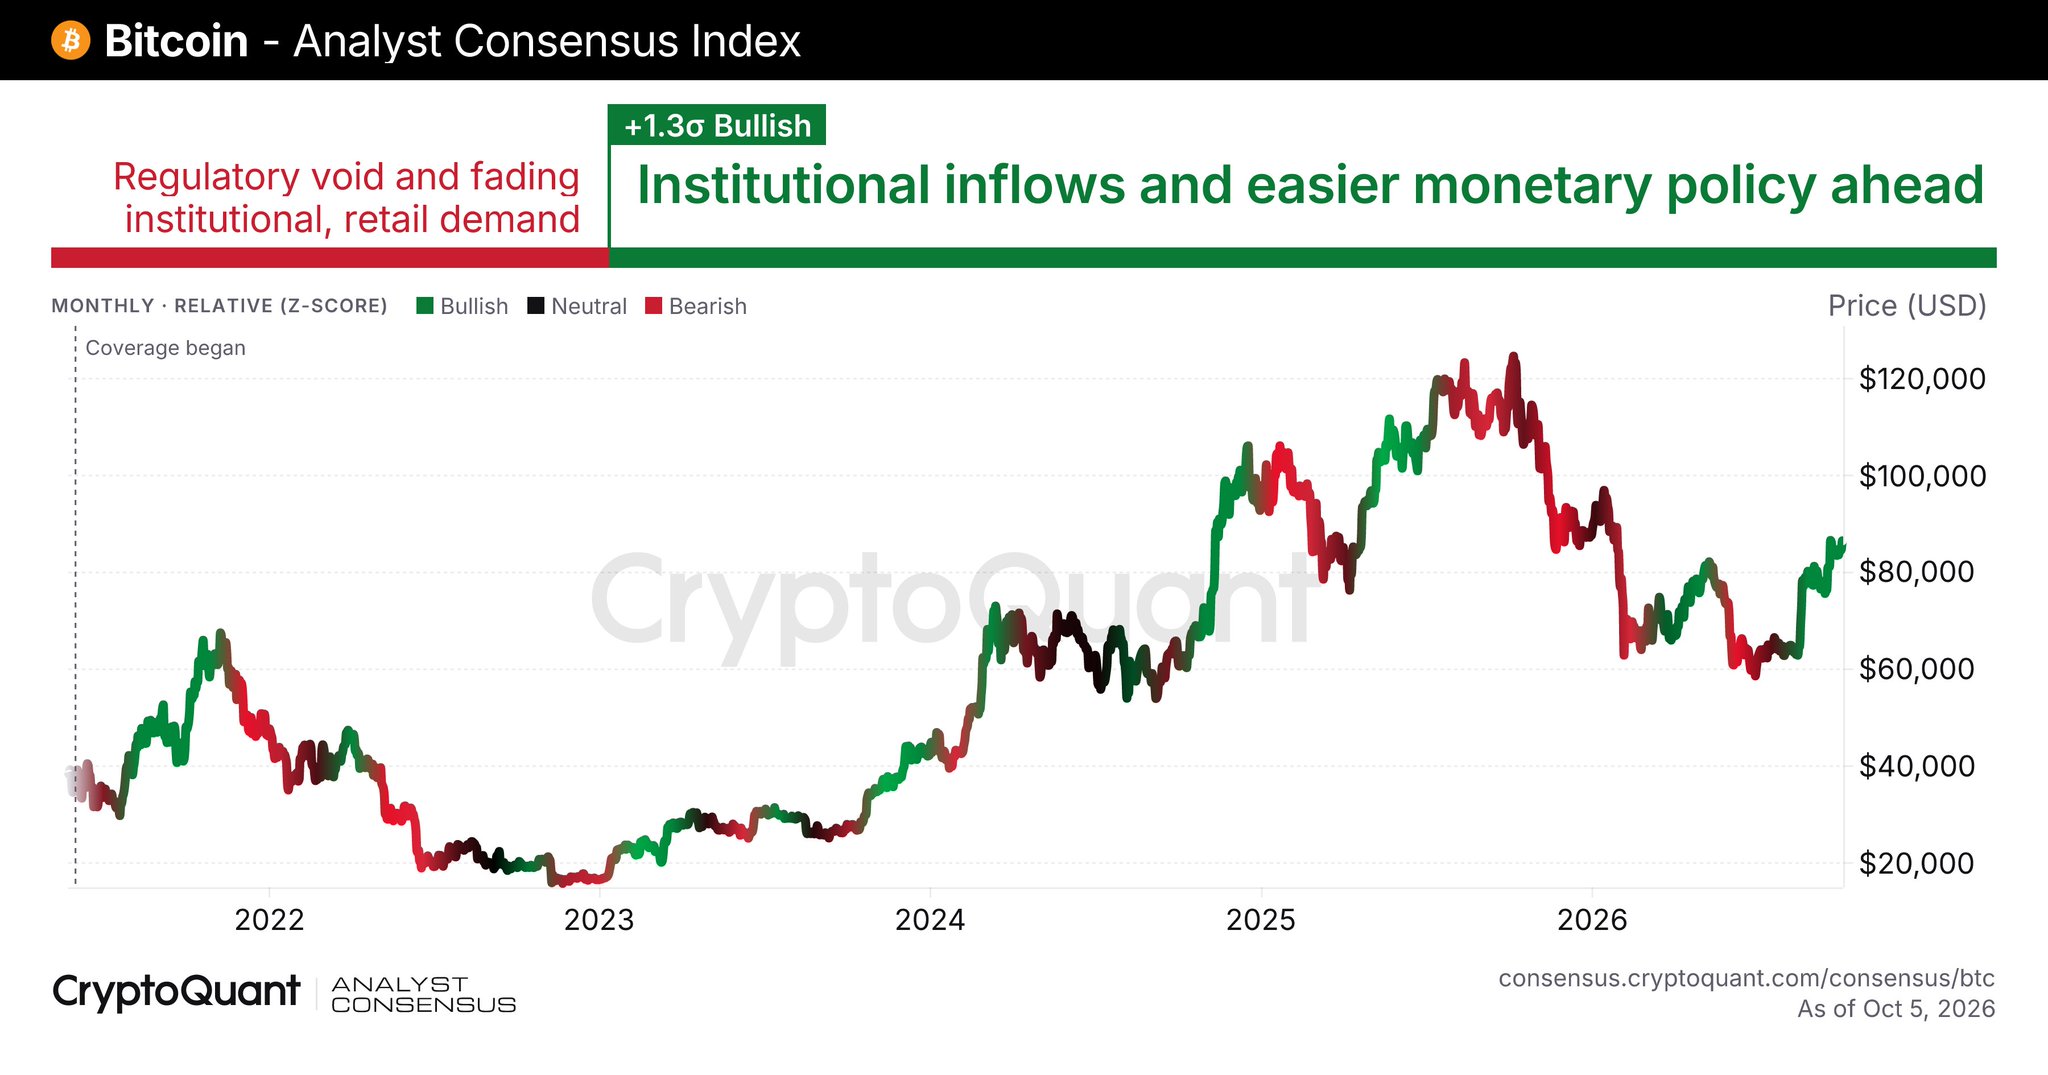
At +1.3σ, Bitcoin’s consensus reading indicates the current bullish positioning is 1.3 standard deviations above the historical mean — a statistically elevated reading, though not extreme. The price range displayed on the chart spans $20,000 through $120,000, with the most recent price action showing a renewed upturn toward the $80,000 area following the prior correction. The convergence of macro tailwinds (monetary easing expectations) and structural demand (institutional inflows) represents the explicit rationale cited by the analyst base driving the 82.5% bullish reading. For broader context on Bitcoin’s historical cycle structure, see Bitcoin’s track record across the last three midterm cycles.
Signal 2 — Ethereum: 84.4% Bullish at +0.9σ
Ethereum’s Analyst Consensus sits at +0.9σ bullish with 84.4% of tracked analysts positioned on the long side. The monthly Z-score chart for ETH spans a price range of $1,000 to $4,000, with the colored sentiment line showing a sharp upturn at the right edge following a bearish phase. The analyst base narrative driving Ethereum’s reading is explicitly labeled on the chart: “Ethereum becomes settlement layer for institutional, private finance.”
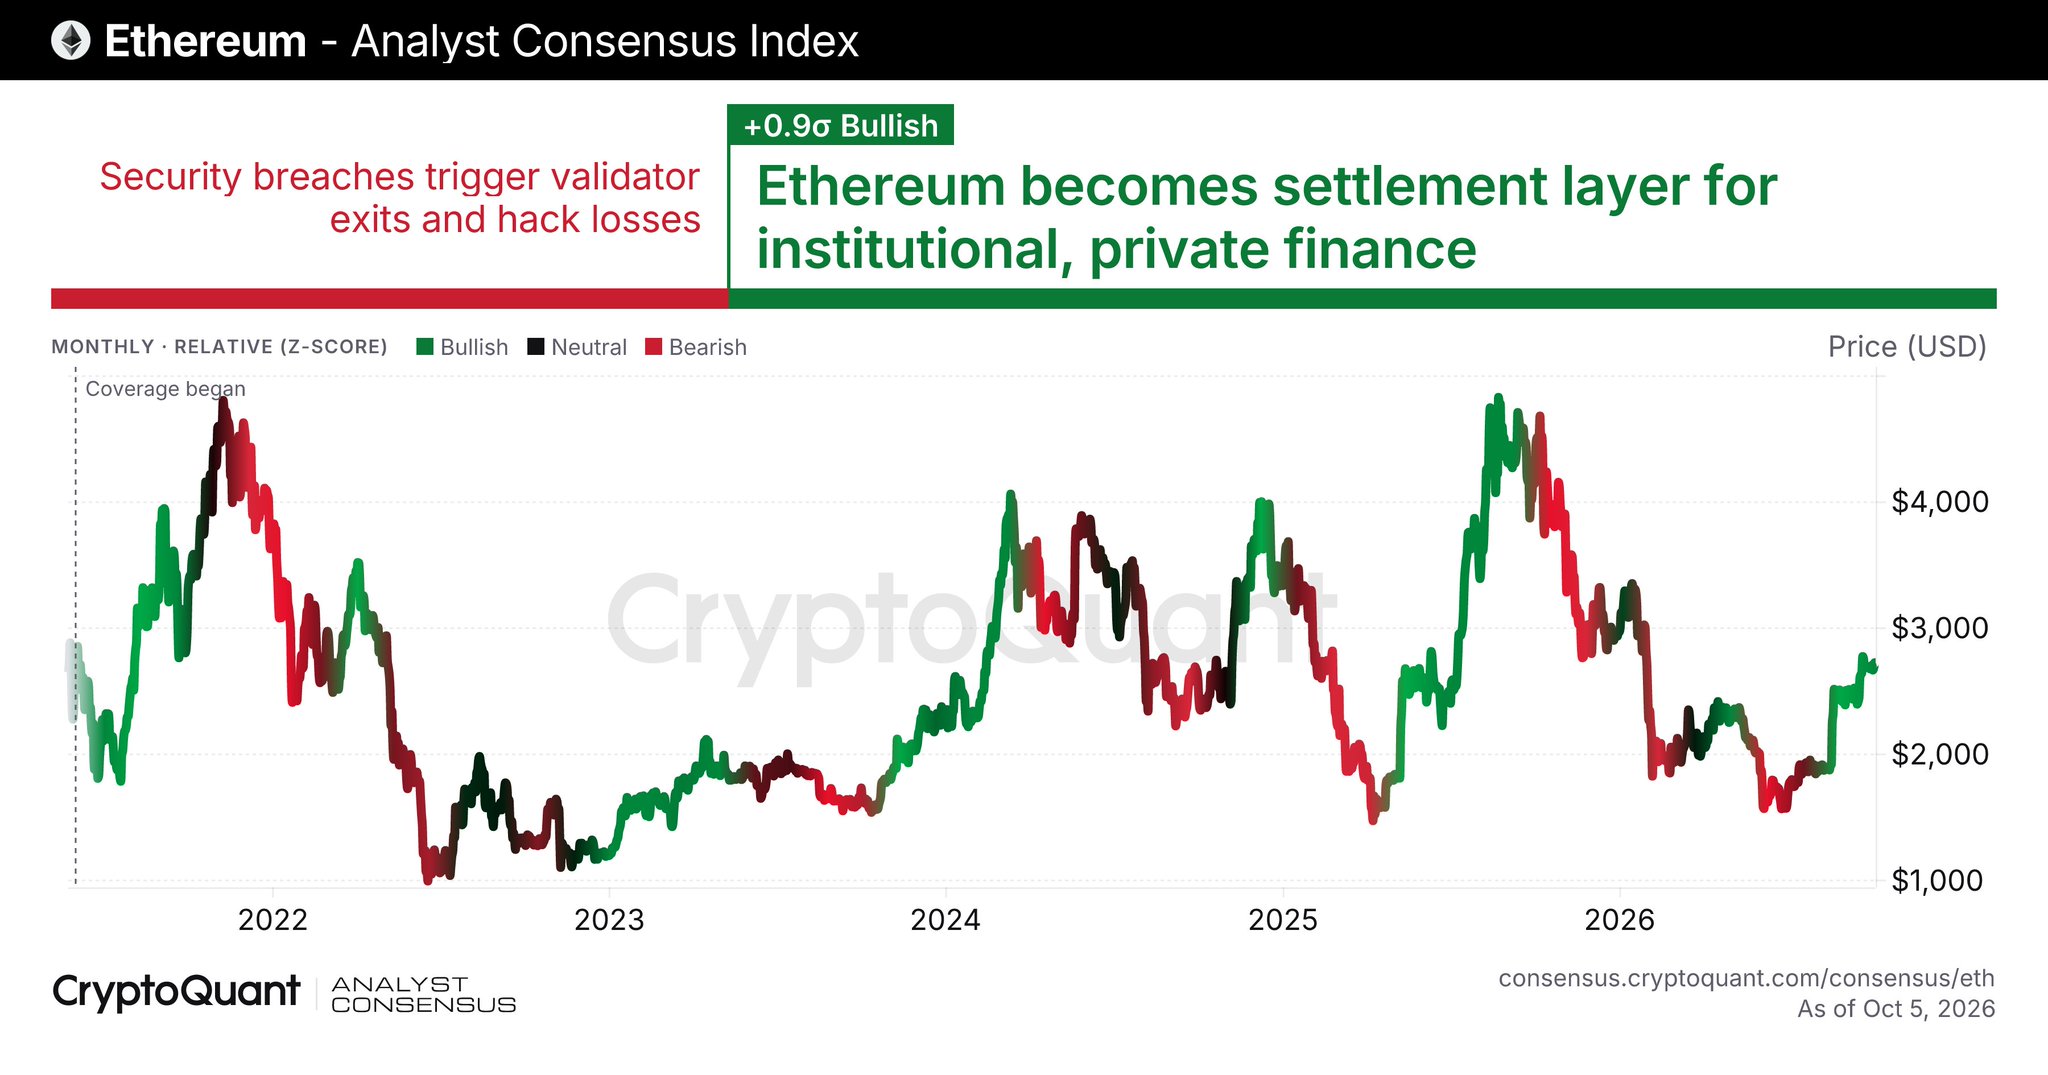
The prior bearish phase — labeled “Security breaches trigger validator exits and hack losses” — has given way to a renewed bullish consensus. At +0.9σ, Ethereum’s reading is the middle of the three assets in Z-score terms, below Bitcoin’s +1.3σ but still comfortably in statistically elevated bullish territory. The 84.4% raw bullish percentage is actually the highest of the three in absolute terms, though Solana’s Z-score and percentage combination tells a different story at the margin.
Signal 3 — Solana: 92.9% Bullish at +0.7σ
Solana’s reading is the headline number: 92.9% bullish with a Z-score of +0.7σ. The monthly chart shows price spanning $50 to $250, with a strong recovery rally peaking near $250 in 2024–2025, followed by a correction, and a renewed upturn in late 2026. The sentiment bar at the top of the chart has transitioned from red (bearish dominance) to green (bullish dominance), and the analyst base narrative driving the current reading is: “Institutional adoption and upgrades fuel SOL breakout.”
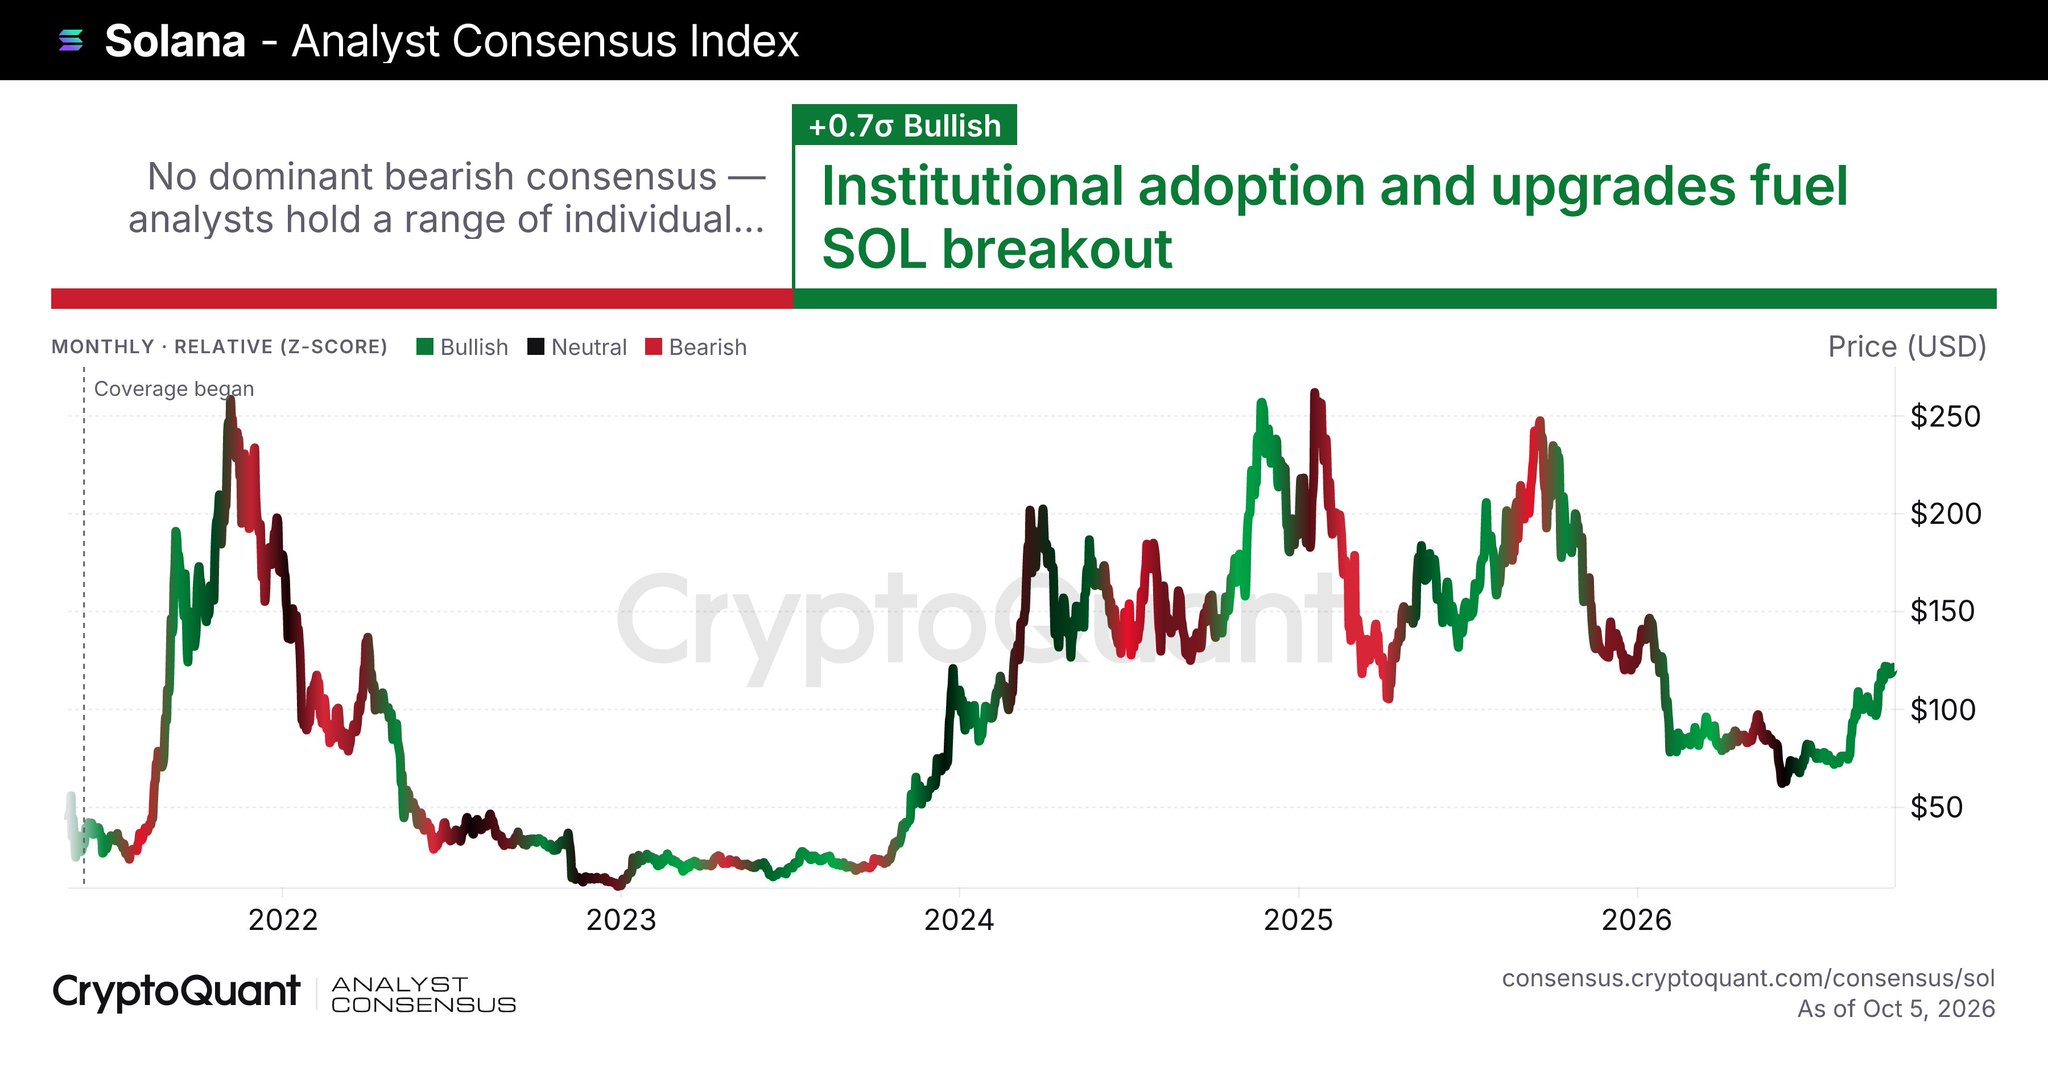
At +0.7σ, Solana’s Z-score is the lowest of the three in relative historical terms — meaning the 92.9% raw consensus, while extraordinary, is occurring at a less statistically extreme positioning level compared to BTC and ETH. This is worth noting: Solana’s analyst base was recently in a prolonged bearish phase, so the recovery to 92.9% bullish is a large absolute swing even if the Z-score hasn’t yet reached the extremes seen in BTC. At $120.78 and a $71 billion market cap, SOL is the smallest of the three by capitalization — and historically, conviction-heavy consensus readings at this Z-score level have preceded significant moves in smaller-cap L1s. For a parallel data point on how positioning extremes translate to market moves, the Bitcoin Puell Multiple’s current 11-month high adds context on miner-side supply dynamics.
What the Analyst Consensus Actually Measures
The CryptoQuant Analyst Consensus is not a price prediction tool and not a market sentiment survey of retail participants. It aggregates the positioning and analytical output of professional analysts tracked across CryptoQuant’s platform and expresses the result as a monthly relative Z-score — how far current bullish/bearish sentiment sits from its own historical average. A reading of 0.0 is neutral. A reading above +1.0σ indicates statistically elevated bullish consensus. A reading below −1.0σ indicates statistically elevated bearish consensus.
The upgrade to 1,708 assets significantly expands the dataset, meaning the current readings reflect a broader and more representative sample than prior versions of the tool. CryptoQuant’s platform also covers traditional markets, making this a cross-asset consensus signal — not a crypto-only echo chamber. The expansion to 1,708 assets is structurally important: a wider asset coverage base reduces the signal noise present in narrower consensus aggregators. This connects to the broader question of whether derivative market signals align with analyst consensus — and currently, the directional agreement is notable.
The Composite Picture — Three Assets, One Direction
| Asset | Bullish % | Z-Score | Dominant Analyst Narrative |
|---|---|---|---|
| Bitcoin (BTC) | 82.5% | +1.3σ | Institutional inflows + monetary easing |
| Ethereum (ETH) | 84.4% | +0.9σ | Settlement layer for institutional finance |
| Solana (SOL) | 92.9% | +0.7σ | Institutional adoption + protocol upgrades |
Source: CryptoQuant Analyst Consensus, as of October 5, 2026 | @cryptoquant_com (X)
The directional alignment across all three assets is the signal within the signal. When BTC, ETH, and SOL all register bullish consensus simultaneously — and all three are above the +0.7σ threshold — it indicates cross-asset professional conviction rather than single-asset speculation. Bitcoin’s +1.3σ reading is the highest in Z-score terms, suggesting its analyst base has the most historically extreme degree of bullishness. Solana’s 92.9% raw percentage is the highest in absolute terms, suggesting near-unanimous directional agreement even if the Z-score hasn’t reached historical extremes.
Bullish Scenario
If Bitcoin’s +1.3σ consensus translates to continued institutional inflows and monetary easing materializes as the analyst base anticipates, the structural setup supports a test of prior cycle highs near $120,000. For Solana at $120.78, a sustained bullish consensus at or above +0.7σ with protocol upgrade catalysts materializing would represent the conditions the 92.9% of analysts are pricing in.
Bearish Scenario
The Analyst Consensus is a lagging-to-coincident indicator — not a leading one. If macro conditions reverse (monetary tightening, institutional outflows, or a security/regulatory shock), the Z-score readings can rotate negative quickly. The prior ETH bearish phase, labeled “Security breaches trigger validator exits,” demonstrates how rapidly the consensus can invert. A breakdown in any of the three dominant narratives — institutional inflows for BTC, settlement layer adoption for ETH, or protocol upgrade execution for SOL — would be the first signal of deterioration.
The CryptoQuant Analyst Consensus, now tracking 1,708 assets, has delivered one of the most directionally unified readings of this cycle: Bitcoin at 82.5% bullish (+1.3σ), Ethereum at 84.4% bullish (+0.9σ), and Solana at 92.9% bullish (+0.7σ) — all three simultaneously above the statistically elevated threshold, all three with explicit institutional and macro narratives driving the consensus. The instrument is not a price target. It is a measurement of where professional analyst conviction sits relative to history. At these levels, across three of the largest assets in crypto simultaneously, the signal is not ambiguous. Watch whether the dominant narratives — institutional inflows for BTC, settlement layer adoption for ETH, and protocol upgrade execution for SOL — confirm or deteriorate in the sessions ahead. For Solana specifically, watch $120.78 as the baseline: sustained analyst consensus at 92.9% bullish without a corresponding price move would itself become a signal worth examining.
Frequently Asked Questions
What is the CryptoQuant Analyst Consensus and how is it calculated?
Why is Solana’s 92.9% bullish reading higher than Bitcoin’s and Ethereum’s in percentage terms despite having the lowest Z-score?
Does an 82.5%–92.9% bullish Analyst Consensus guarantee upside for BTC, ETH, and SOL?
What narratives are the analysts citing as the basis for their bullish consensus on each asset?
Source: CryptoQuant · Published by CoinsProbe Markets Desk
The opinions and market insights shared on CoinsProbe represent the views of individual authors based on prevailing market conditions at the time of publication. Cryptocurrency investments carry significant risk and volatility. Readers are encouraged to conduct their own research and seek professional financial advice before making investment decisions. CoinsProbe and its contributors do not accept responsibility for financial losses or decisions made based on published content.
CoinsProbe may publish sponsored articles, affiliate links, or promotional collaborations. All sponsored material is clearly labeled to maintain transparency with our audience. Our editorial decisions remain fully independent, and advertising partnerships do not influence reviews, rankings, or published opinions.
Since 2023, CoinsProbe has delivered reliable insights on cryptocurrency, blockchain, and digital assets. Our content is created by experienced researchers and analysts who follow strict editorial standards focused on accuracy, transparency, and credibility. Every article is carefully reviewed and verified using trusted sources and current market data. We provide unbiased analysis and timely updates covering everything from emerging crypto projects to major industry developments.