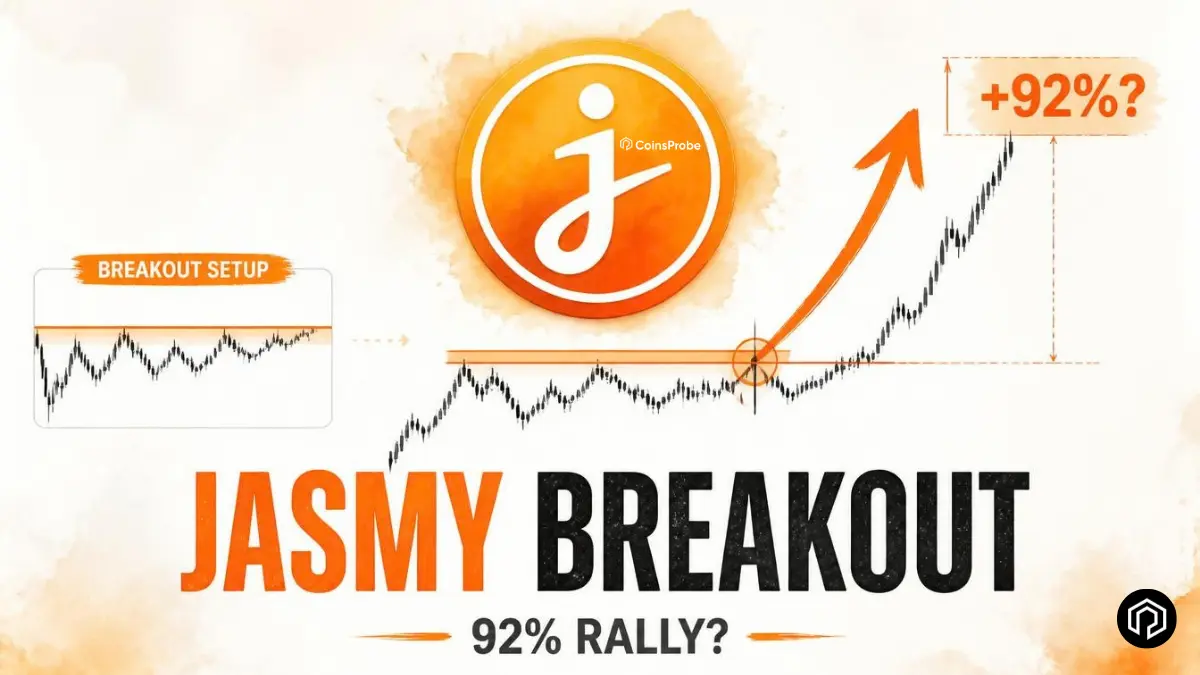

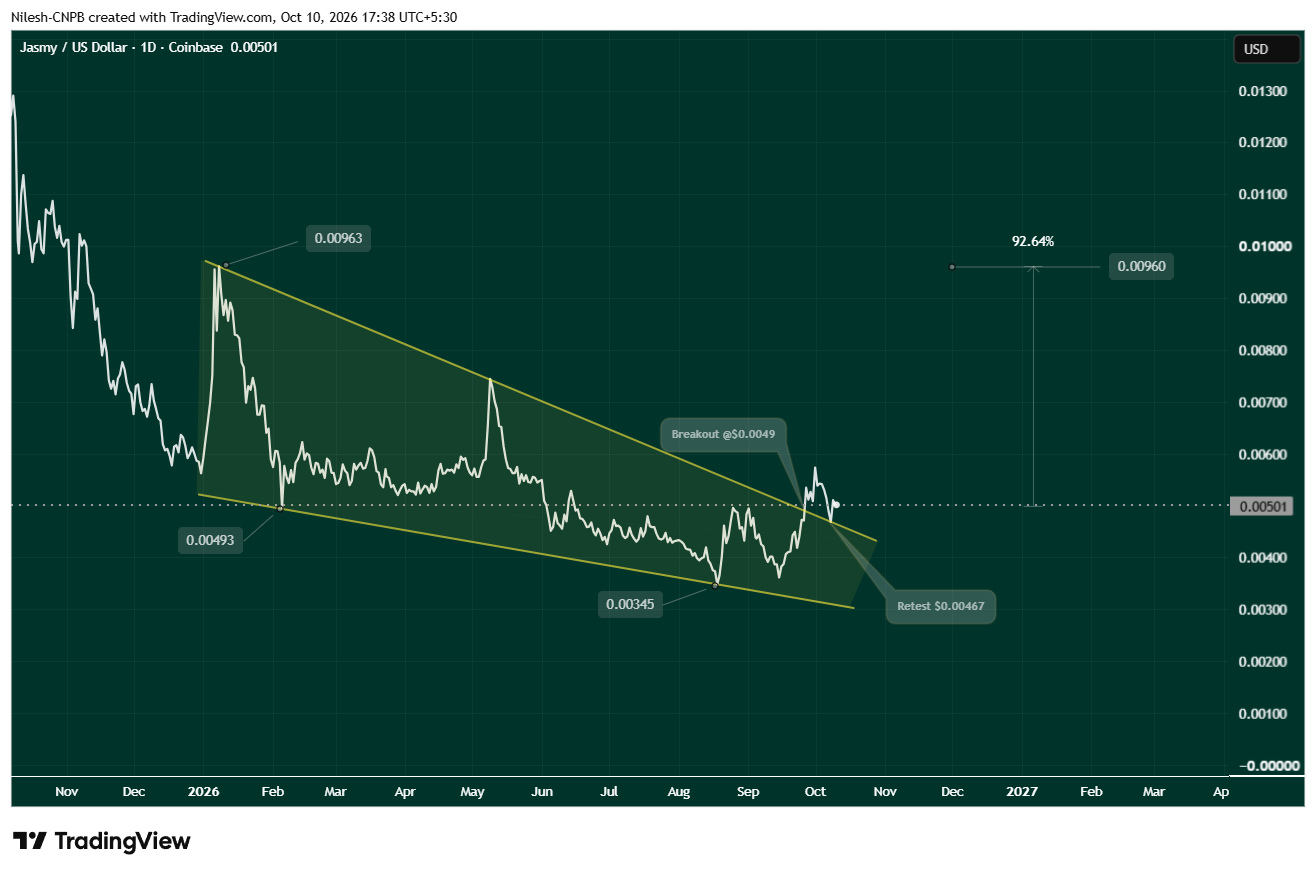
- $JASMY broke out of a multi-month falling wedge near $0.0049 and has since retested the breakout trendline around $0.00467.
- A move above the recent high near $0.00575 would confirm successful retest completion and strengthen the bullish case.
- Chart-measured target sits near $0.0096, still representing roughly +92% upside from the current $0.00501 area.
JasmyCoin is trading at $0.005014 — up 5.56% in the past 24 hours, down 3.43% over the past 7 days, and up 26.46% over the past 30 days — with a market capitalization of approximately $247.94 million.

The Setup — Falling Wedge Breakout and Retest
The daily chart shows $JASMY compressing inside a multi-month falling wedge that began after the early-2026 high near $0.00963. Price broke out of the upper boundary of that wedge near $0.0049. It has since pulled back to retest the same trendline around $0.00467, a classic post-breakout behavior that tests whether former resistance has flipped to support.
As of the latest close near $0.00501, the retest has held so far. The next confirmation level is a reclaim and close above the recent swing high around $0.00575. That move would signal the retest phase is complete and open the door to the measured target.
Why the Retest Matters
Falling wedge breakouts often fail when price cannot hold the upper trendline after the initial push. A successful retest near $0.00467 keeps the structure intact. Failure to hold that level would negate the breakout and return price to the prior downtrend channel.
The chart also labels a deeper historical low near $0.00345 from the August 2026 area, which remains well below the current retest zone. As long as the breakout trendline holds, the path of least resistance is higher.
Measured Target and Levels
The projected target from the wedge breakout measures near $0.0096. From the current price of approximately $0.00501, that represents roughly +92% upside. Intermediate resistance sits around the $0.00575 recent high; clearing it is the trigger that would confirm retest completion and improve the probability of the larger move.
Key levels:
- Support / invalidation: Breakout trendline near $0.00467 (sustained close below invalidates)
- Confirmation: Close above recent high ~$0.00575
- Target: ~$0.0096 (+92% from current levels)
Bullish Scenario
Price holds the $0.00467 retest zone, reclaims $0.00575, and extends toward the measured target near $0.0096. Volume expansion on the break above $0.00575 would further support the move.
Bearish Scenario
A daily close back below the breakout trendline support near $0.00467 invalidates the breakout. That would reopen downside toward the prior wedge lows and the August area near $0.00345.
Broader Context
$JASMY continues to function as the gas token on JasmyChain, the Ethereum-compatible Arbitrum Orbit Layer 2 that completed its mainnet migration earlier in 2026. Recent infrastructure updates included an RPC migration in late September. At the same time, Japanese exchanges BITPOINT and SBI VC Trade are scheduled to delist the token by 28 October as part of a broader service consolidation, creating near-term liquidity friction for holders on those platforms.
The technical setup stands independent of those developments. The chart’s message is binary: hold the retest and clear $0.00575 for the $0.0096 target, or lose the breakout trendline and the structure fails.
The level to watch is not a single intraday print. It is whether $JASMY can close above the recent high near $0.00575 while keeping the $0.00467 breakout trendline intact. Until that confirmation arrives, the retest remains in progress and the +92% measured target stays on the table.
Frequently Asked Questions
What is the falling wedge breakout level for JASMY?
The breakout occurred near $0.0049. Price has since retested the upper trendline of the wedge around $0.00467.
What confirms the retest is complete?
A move and close above the recent high near $0.00575. That would strengthen the case for continuation toward the measured target.
What is the upside target?
The chart-measured target is approximately $0.0096, which is still about 92% above the current price near $0.00501.
What invalidates the bullish setup?
A sustained close back below the breakout trendline support near $0.00467.
The opinions and market insights shared on CoinsProbe represent the views of individual authors based on prevailing market conditions at the time of publication. Cryptocurrency investments carry significant risk and volatility. Readers are encouraged to conduct their own research and seek professional financial advice before making investment decisions. CoinsProbe and its contributors do not accept responsibility for financial losses or decisions made based on published content.
CoinsProbe may publish sponsored articles, affiliate links, or promotional collaborations. All sponsored material is clearly labeled to maintain transparency with our audience. Our editorial decisions remain fully independent, and advertising partnerships do not influence reviews, rankings, or published opinions.
Since 2023, CoinsProbe has delivered reliable insights on cryptocurrency, blockchain, and digital assets. Our content is created by experienced researchers and analysts who follow strict editorial standards focused on accuracy, transparency, and credibility. Every article is carefully reviewed and verified using trusted sources and current market data. We provide unbiased analysis and timely updates covering everything from emerging crypto projects to major industry developments.