
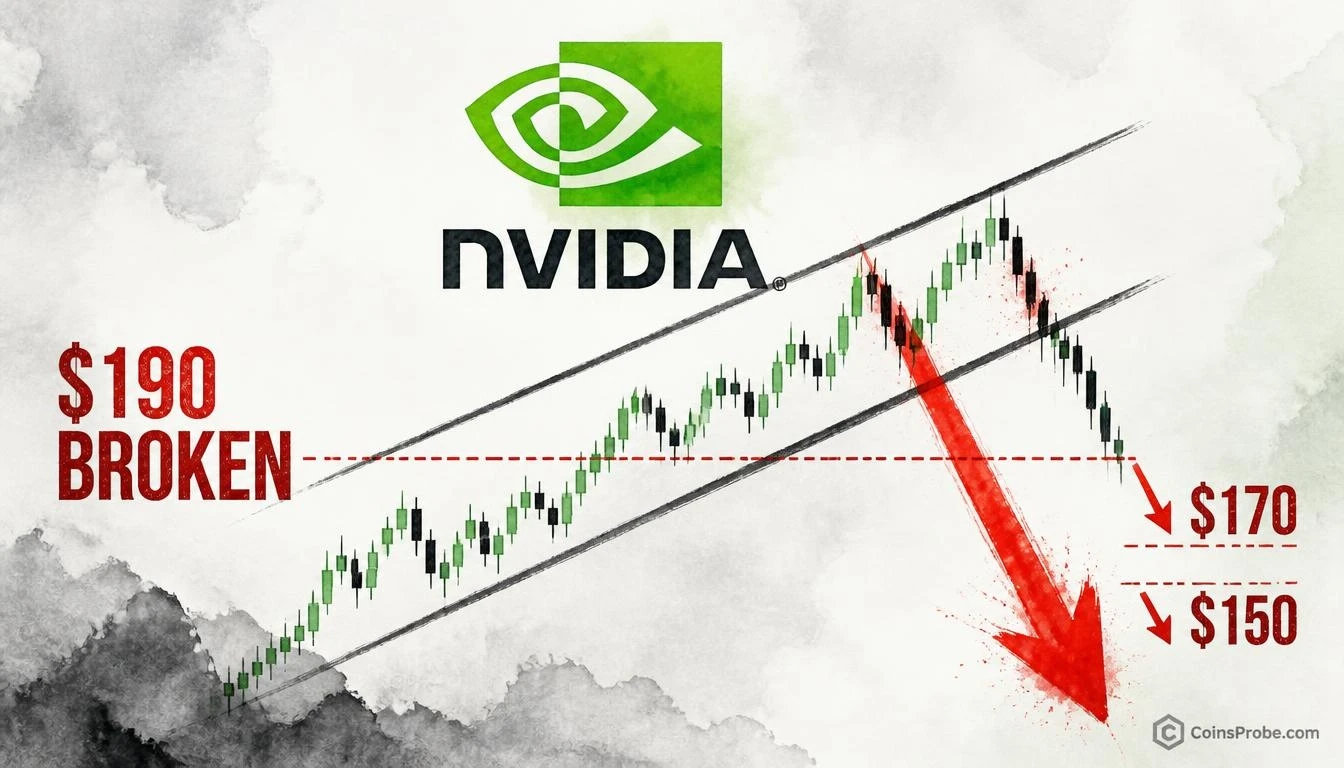
- NVDA breaks below $190 channel support — current price $183.88 confirms breakdown
- Analyst targets $170 first, then $150 if selling pressure continues
- 200-day SMA at $204.38 now acts as overhead resistance after breakdown
- All-time high of $243.37 on Oct 6 failed as upper channel breakout — decline followed
NVIDIA has broken below the lower boundary of its rising parallel channel near $190 — a level that had served as major support since April — and the breakdown is confirmed. At the time of writing, NVDA is trading at approximately $183.88, already well beneath the breached level, with the 200-day SMA at $204.38 now acting as overhead resistance rather than support.
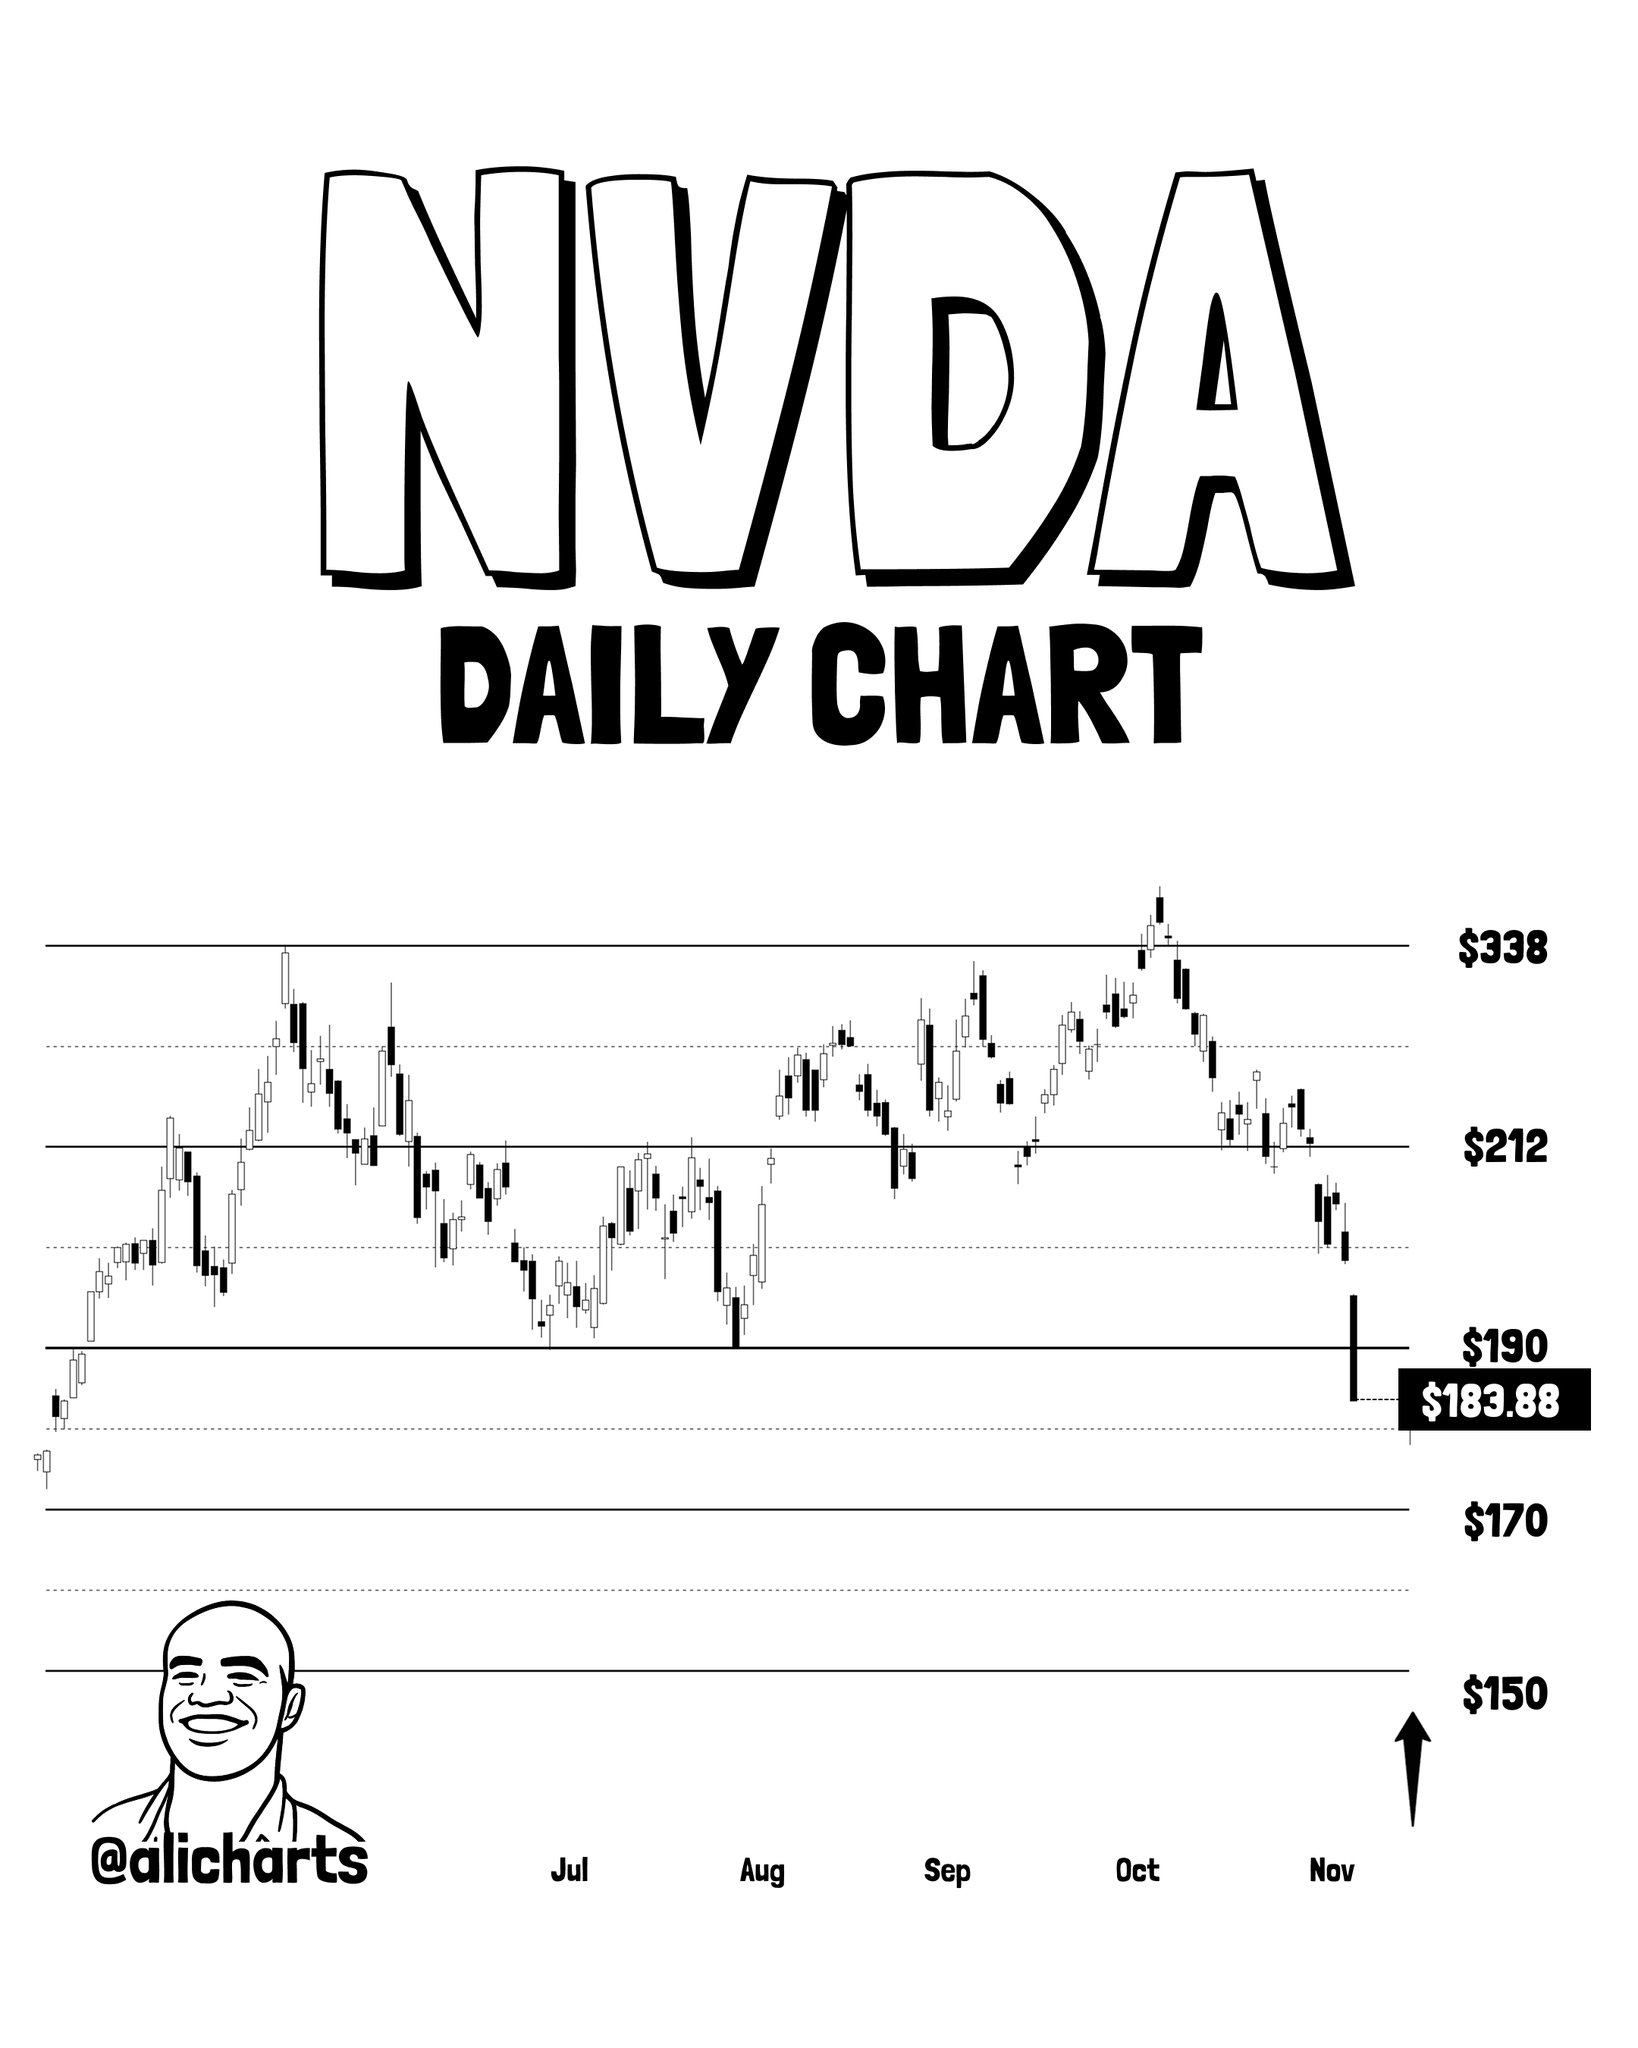
One analyst flagged this breakdown on November 5, 2026, with a blunt three-word declaration: “THE AI BUBBLE IS BURSTING.” The call is specific and level-based: NVDA broke below the lower boundary of its rising channel near $190, and if selling pressure continues, the analyst is watching $170 and $150 as the next downside targets. This is not a vague bearish note — it is a named breakdown with named targets at a named level.
The Setup — A Rising Channel That Failed at Its Peak
The structure behind this breakdown matters. NVDA had been forming a rising parallel channel from April 2026, with price oscillating between a defined lower support boundary and an upper resistance zone. On October 6, 2026, price briefly pushed above the upper boundary to print an all-time high of $243.37 — but the breakout failed. What followed was a steady decline through October that brought price back toward the lower boundary near $190.
That lower boundary was the last structural defense within the channel. It had held as major support for months, and the analyst had flagged it explicitly in a prior post on November 3, 2026, noting that a failure of $190 would open downside toward $170 or $155. The 200-day SMA at $204.38 was also being tested at that point. As of November 5, $190 has given way — with NVDA’s last printed price at $183.88, the breakdown is not a warning. It has already occurred. For further context on the significance of NVIDIA’s 200-day SMA and the $190 level, see NVIDIA’s 200-Day SMA Breaks — $190 Is the Line That Matters Now.
Downside Targets — $170 First, Then $150
With $190 breached and the 200-day SMA now above price, the analyst’s stated downside targets are $170 and $150. These are sequential, not simultaneous — $170 represents the first zone of potential price discovery below the channel, and $150 is the deeper target if selling pressure accelerates. From the current $183.88 print, that implies a further decline of approximately 7.6% to reach $170, and roughly 18.4% to reach $150.
The $150 level has additional significance: it sits beneath the $155 level that the analyst cited in the November 3 post as the outer downside scenario. The convergence of $150 and $155 as referenced targets suggests a broader support zone in that area, though the analyst’s most recent stated watch levels are $170 and $150 specifically.
The “AI Bubble” Thesis — What This Call Is Really Saying
The phrasing matters. Calling this an AI bubble bursting is not just a price observation — it is a structural thesis. NVIDIA’s stock price has been the most direct proxy for AI infrastructure spending expectations. When NVDA broke above its channel in October and immediately reversed from $243.37, the failed breakout signaled that the most aggressive growth expectations were already priced in. The subsequent decline through $212, through the 200-day SMA at $204.38, and now through channel support at $190 is a sequential erosion of technical defenses.
Each broken level removes a layer of structural support. The $190 breakdown is the most significant yet because it represents the channel itself — not just a moving average or a round number, but the geometric structure that had defined NVDA’s uptrend since April. Breaking it confirms that the trend has changed character. This context is also relevant to the broader crypto market, where AI-adjacent narratives have driven significant capital allocation. As analyzed in TOTAL2 Wave 2 Correction Ending — Analyst Eyes $3.15T Cycle Top, risk appetite across tech and crypto markets is closely linked.
Key Levels to Watch
| Level | Role | % from $183.88 |
|---|---|---|
| $204.38 | 200-Day SMA (now resistance) | +11.2% |
| $190.00 | Broken channel support (now resistance) | +3.3% |
| $183.88 | Current price (at breakdown) | — |
| $170.00 | First downside target (analyst stated) | −7.6% |
| $150.00 | Second downside target (analyst stated) | −18.4% |
Key levels from channel breakdown | Source: @alicharts (X)
Bearish Scenario — Selling Pressure Continues
If NVDA fails to reclaim $190 and volume confirms the breakdown, the analyst’s next watch levels are $170 and then $150. The $150 zone, approximately 18.4% below the current $183.88 print, represents the analyst’s stated deeper target if momentum continues to deteriorate. The broken 200-day SMA at $204.38 becomes the ceiling that bulls must reclaim to invalidate the breakdown thesis.
Bullish Scenario — Reclaim of $190
A sustained close back above $190 — the broken channel boundary — would signal a failed breakdown and shift the structure back toward neutral. Recovery above the 200-day SMA at $204.38 would be needed to fully negate the analyst’s bearish call. Neither has occurred as of the November 5 print.
The channel support at $190 broke. The 200-day SMA at $204.38 is now overhead resistance. The analyst’s stated targets are $170 and $150, in that order. Reclaiming $190 on a sustained close is the minimum condition needed to invalidate the breakdown. Watch $170 — if that level gives way with volume, $150 becomes the live target.
Source: x.comFrequently Asked Questions
What does NVIDIA breaking $190 mean for the stock?
What is the first downside target for NVDA after the $190 breakdown?
What would invalidate the bearish breakdown thesis for NVIDIA?
Why did NVIDIA’s October all-time high of $243.37 fail to hold?
Source: Ali Charts · Published by CoinsProbe Markets Desk
The opinions and market insights shared on CoinsProbe represent the views of individual authors based on prevailing market conditions at the time of publication. Cryptocurrency investments carry significant risk and volatility. Readers are encouraged to conduct their own research and seek professional financial advice before making investment decisions. CoinsProbe and its contributors do not accept responsibility for financial losses or decisions made based on published content.
CoinsProbe may publish sponsored articles, affiliate links, or promotional collaborations. All sponsored material is clearly labeled to maintain transparency with our audience. Our editorial decisions remain fully independent, and advertising partnerships do not influence reviews, rankings, or published opinions.
Since 2023, CoinsProbe has delivered reliable insights on cryptocurrency, blockchain, and digital assets. Our content is created by experienced researchers and analysts who follow strict editorial standards focused on accuracy, transparency, and credibility. Every article is carefully reviewed and verified using trusted sources and current market data. We provide unbiased analysis and timely updates covering everything from emerging crypto projects to major industry developments.