
- XRP trades at $1.24 — down 5.54% in 24 hours — with $78.4B market cap and $1.89B in daily volume
- Analyst @CryptoBullet1 identifies potential Wave 2 completion at the C low near the 0 Fibonacci level, flagging the start of Wave 3
- Confirmation trigger: a sustained breakout above the 350-day MA required — price is currently below it
- XRP spot ETF net flows near zero — $7.4M net across 5 days with 4 outflow sessions per SoSoValue
XRP is trading at $1.24 — down 5.54% over the past 24 hours — with a market cap of $78.4 billion and $1.89 billion in daily volume. That pullback, however, is precisely the kind of price zone one analyst is treating as an opportunity rather than a warning sign.
An analyst who goes by the handle @CryptoBullet1 on X flagged XRP’s current price position with a direct assessment: “I like $XRP here. Wave 2 correction may have ended, and we could be at the very beginning of Wave 3. I need to see a breakout above the 350-Day MA in the coming weeks.” The setup he is tracking is an Elliott Wave structure — a disciplined framework for identifying where impulsive and corrective phases begin and end.
Signal — Elliott Wave 2 Completion and the Case for Wave 3
The Elliott Wave principle divides price action into five impulsive waves and three corrective waves. After a full five-wave move down — labeled Wave (1) through Wave (5) on the chart — price typically enters an ABC zigzag correction before resuming in the dominant direction. That corrective structure is what the analyst identifies as Wave (2), and the chart shared by @CryptoBullet1 shows the C leg of that correction completing near the 0 Fibonacci extension level — currently where XRP is trading, around $1.24–$1.32 on the daily chart.
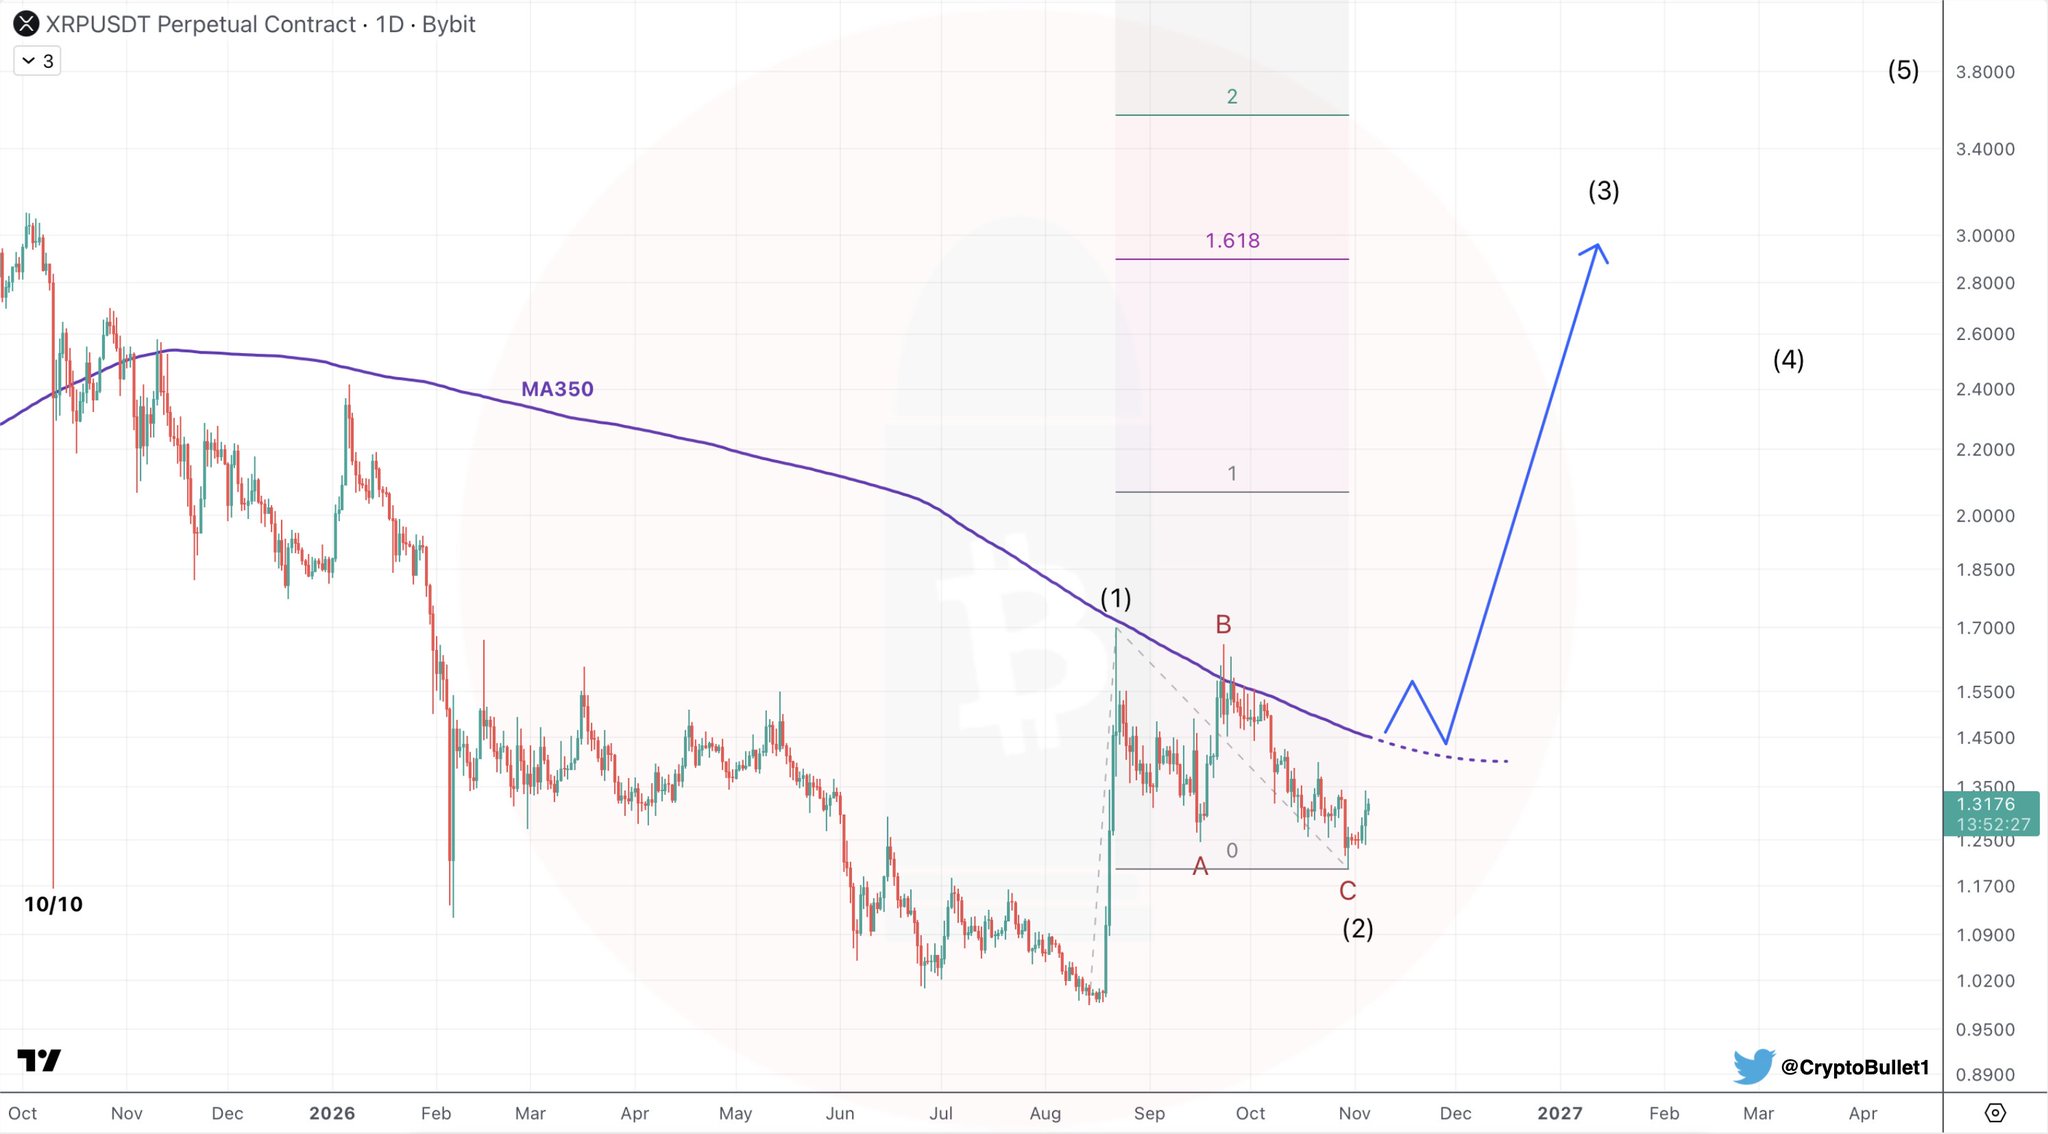
The chart, plotted on Bybit’s XRP/USDT perpetual contract daily timeframe, overlays a Fibonacci extension grid with labeled levels at 0, 1, 1.618, and 2. The wave labels — (1), (2), (3), (4), (5), A, B, C — are explicitly annotated, with Wave (2) completing at the C low near the 0 Fibonacci level. The projected trajectory drawn upward from that low represents a potential Wave (3) impulse, historically the strongest and most extended wave in an Elliott sequence. The chart also displays the MA350 — the 350-day moving average — sitting above the current price. As of the chart, XRP is trading below the MA350, and the analyst has explicitly stated that a breakout above it is the required confirmation.
The 350-Day MA — The One Level That Changes the Picture
The 350-day moving average is a long-horizon trend filter. On Bitcoin, it has historically separated bear market consolidation from bull market continuation. For XRP, the analyst’s framing is conditional but clear: Wave 3 is the thesis, and the 350-day MA breakout is the trigger. Without that breakout — on a sustained basis, not an intraday spike — the corrective structure cannot be confirmed as complete.
The chart’s current price label shows XRP at approximately $1.3176 on the Bybit perpetual, while the live spot price at time of writing is $1.24. The analyst’s stated trigger is a breakout above the MA350 “in the coming weeks” — a timeframe, not an immediate call. That distinction matters. The setup is developing, not confirmed. The analyst is positioning for the entry zone, not announcing the breakout has occurred.
What the signal says: Wave (2) corrective structure appears complete at the C low near the 0 Fibonacci level, and XRP is at or near the beginning of a potential Wave (3) impulse.
What it does not say: The breakout has occurred, the MA350 has been reclaimed, or Wave 3 is already in motion.
What to watch for confirmation: A sustained daily close above the 350-day MA — not an intraday breach — in the coming weeks.
ETF Context — Spot Flows Remain Thin
XRP spot ETF data via SoSoValue shows total net assets of $1.49 billion with cumulative inflows since launch reaching $1.81 billion. However, the past five trading days show a net of only $7.4 million across predominantly outflow sessions — four of the last five days saw outflows, with zero net flow on the most recent trading date of November 4. Daily trading volume in the XRP spot ETF stands at $23.1 million. These figures suggest institutional ETF demand is not currently providing a tailwind for XRP price, making the technical setup — and particularly the MA350 breakout — the primary driver to monitor.
Macro events this week add an additional layer of context. Nonfarm Payrolls on November 6 and CPI on November 10 are both risk events capable of moving broader crypto sentiment in either direction. For XRP specifically — which has shown sensitivity to both risk-on flows and regulatory developments — these releases could either compress or accelerate the timeframe the analyst is watching. For comparison, other assets in the ecosystem are also navigating structural crossroads: the broader altcoin market is absorbing supply pressures, as seen in recent token unlock events like the MON supply shock, while ETF-driven institutional momentum is creating selective rallies as evidenced by the INJ ETF listing on Nasdaq.
Bullish and Bearish Scenarios
Bullish Scenario — Breakout Above the MA350
If XRP closes convincingly above the 350-day moving average on the daily timeframe in the coming weeks, the analyst’s Elliott Wave thesis gains structural confirmation. A Wave (3) impulse — if the count is correct — would typically extend to the 1.618 Fibonacci level at minimum, as annotated on the chart. That level sits at a significantly higher price than current, though the analyst has not stated an explicit dollar target. The Fibonacci grid on the chart extends to the 2.0 level, suggesting the analyst’s framework accommodates a substantial measured move above the MA350.
Bearish Scenario — Failure to Reclaim MA350
If XRP fails to break above the MA350 in the coming weeks and price begins deteriorating below the C low — the 0 Fibonacci level near $1.24 — the Wave (2) completion thesis is invalidated. That would suggest the corrective structure is still in progress, potentially extending to lower levels before any Wave (3) can begin. The analyst did not state an explicit invalidation price, but the chart’s C wave low near the current zone is the structural anchor of the entire setup.
XRP’s Elliott Wave structure — a completed ABC correction landing at the 0 Fibonacci level — presents one of the cleaner setups the daily chart has offered in recent sessions. The thesis is conditional: the analyst is watching for the 350-day MA breakout as the trigger that confirms Wave 3 is underway. With XRP currently below that average, the setup is live but unconfirmed. Watch the 350-day MA on the daily close — that is the line the analyst has drawn between corrective and impulsive.
Source: x.comFrequently Asked Questions
What is the 350-day MA and why does it matter for XRP right now?
What would invalidate the Elliott Wave 2 completion thesis for XRP?
How large could a Wave 3 move be if the breakout confirms?
What is the current state of XRP spot ETF flows?
Source: Cryptobullet1 · Published by CoinsProbe Markets Desk
The opinions and market insights shared on CoinsProbe represent the views of individual authors based on prevailing market conditions at the time of publication. Cryptocurrency investments carry significant risk and volatility. Readers are encouraged to conduct their own research and seek professional financial advice before making investment decisions. CoinsProbe and its contributors do not accept responsibility for financial losses or decisions made based on published content.
CoinsProbe may publish sponsored articles, affiliate links, or promotional collaborations. All sponsored material is clearly labeled to maintain transparency with our audience. Our editorial decisions remain fully independent, and advertising partnerships do not influence reviews, rankings, or published opinions.
Since 2023, CoinsProbe has delivered reliable insights on cryptocurrency, blockchain, and digital assets. Our content is created by experienced researchers and analysts who follow strict editorial standards focused on accuracy, transparency, and credibility. Every article is carefully reviewed and verified using trusted sources and current market data. We provide unbiased analysis and timely updates covering everything from emerging crypto projects to major industry developments.