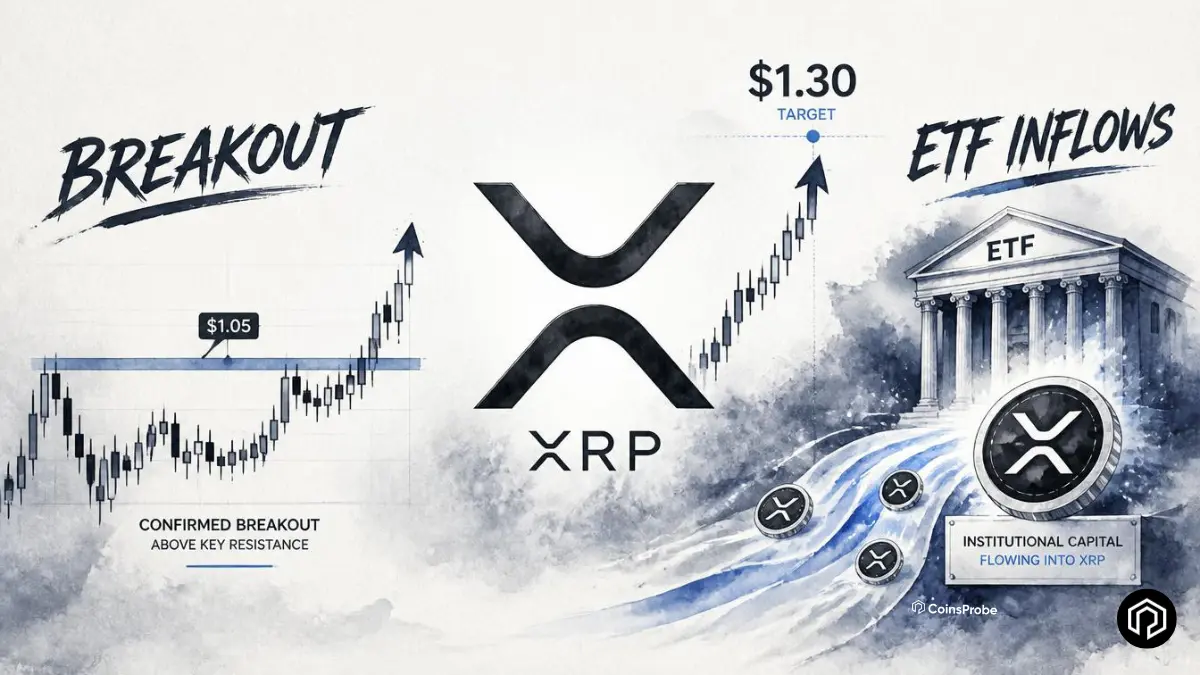
- XRP is trading at $1.14, up 4% in 24 hours, after breaking out of a converging triangle on the 1-hour chart.
- Analyst @ali_charts has confirmed the breakout, targeting $1.30 while identifying $1.1070 as key support.
- Spot XRP ETFs have attracted $1.49 billion in cumulative net inflows, highlighting continued institutional demand.
- If $1.1070 holds, the next upside targets are $1.22 and $1.30.
XRP has just produced the technical confirmation that traders have been waiting for since the token spent most of June and July building a tightening triangle structure. The breakout is live, the analyst confirmation is in, and the institutional ETF data provides a fundamental backdrop that gives the technical move more credibility than a purely chart-driven signal alone.
As of July 21, 2026, XRP is trading at $1.14 — up +4.00% in 24 hours — with a market cap of approximately $71.42 billion.

Signal 1 — Breakout Confirmed on the 1-Hour Chart
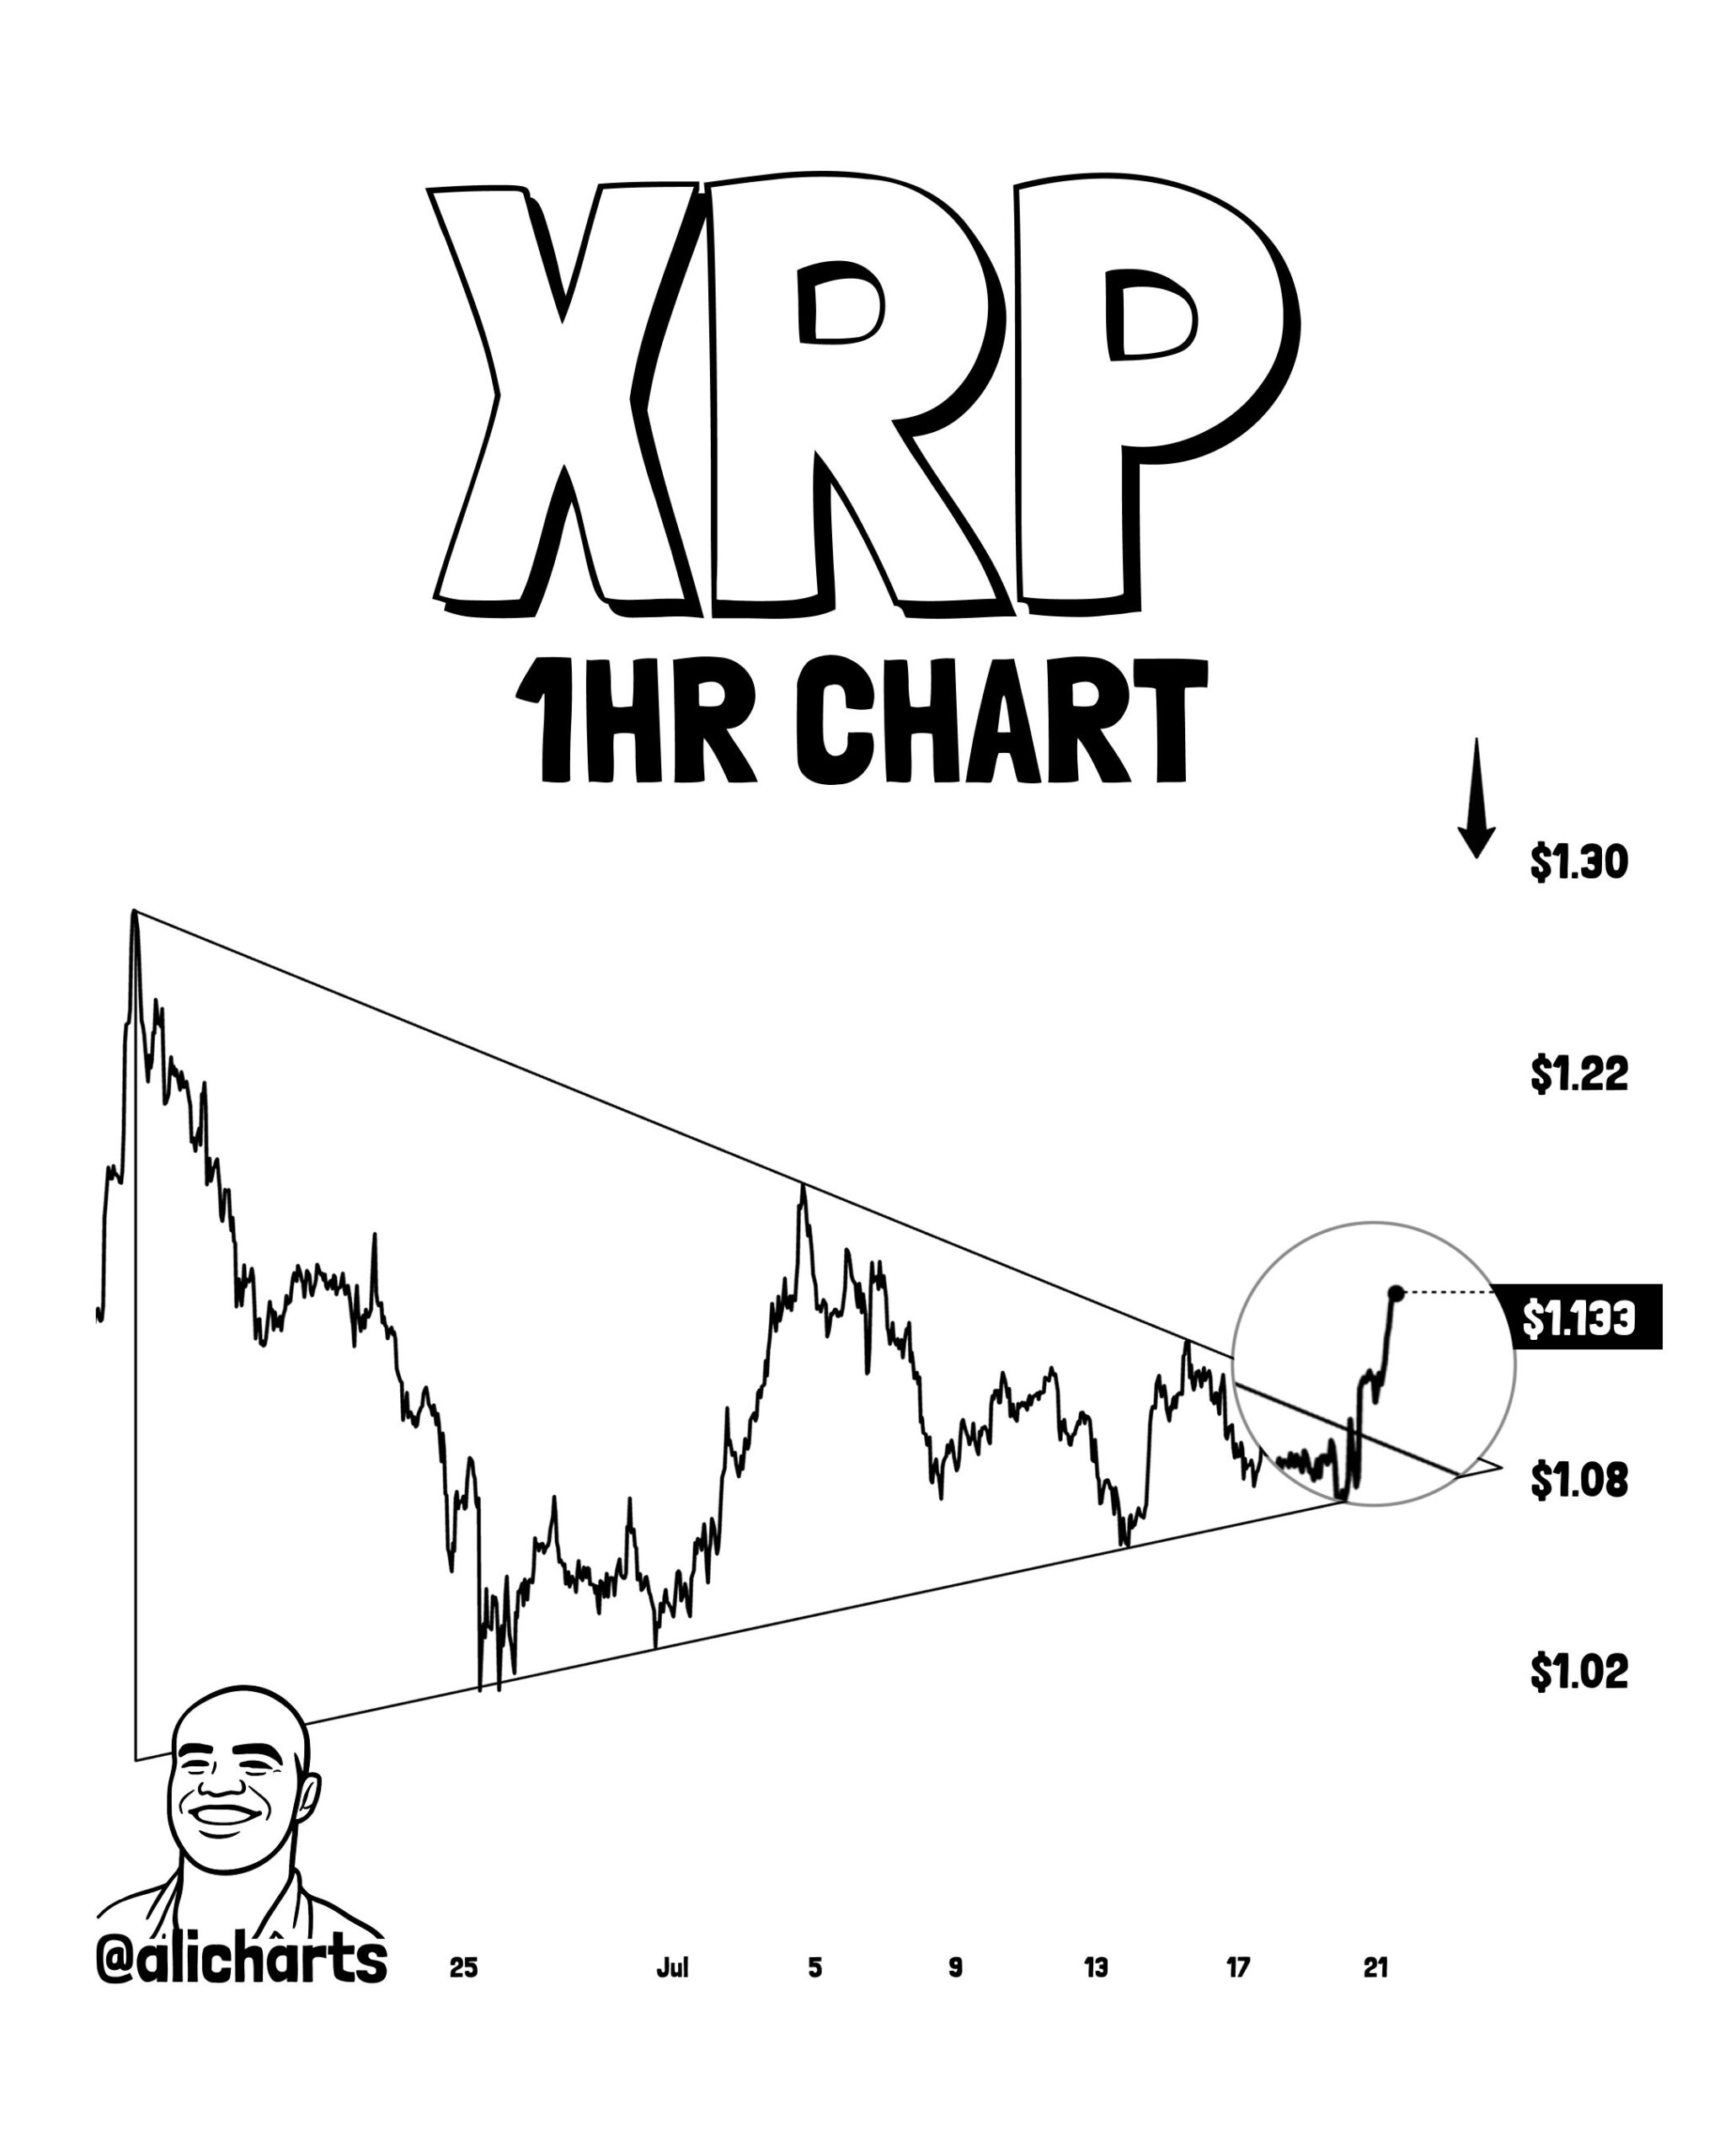
The 1-hour chart shared by analyst @alicharts tells the breakout story clearly. From late June through July 21, XRP has been forming a descending triangle with a converging upper trendline and a rising lower support — a coiling structure that has been compressing price action toward a decisive resolution.
The breakout:
XRP has cleared the upper descending trendline — the resistance that has been capping every rally attempt since late June. @alicharts confirmed the move directly:
“BREAKOUT CONFIRMED! $XRP has cleared resistance, putting the next major target at $1.30.”
The circled area on the chart shows exactly where the breakout occurred — a clean push above the converging trendline at approximately $1.133, with price now testing and holding above the $1.1070 support.
From the current price of $1.14, reaching the $1.30 target represents approximately +14% additional upside — a measured move consistent with the triangle’s dimensions and the standard projection for a breakout of this pattern type.
Signal 2 — XRP Spot ETF Inflows: Consistent Institutional Demand
The technical breakout is occurring against a backdrop of institutional demand that has been one of the most consistent and underappreciated stories in the XRP market throughout 2026.
Monthly XRP Spot ETF data:
What this data shows:
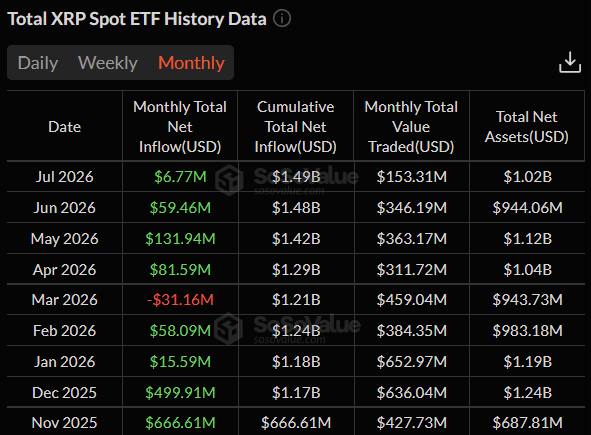
Cumulative net inflows have reached $1.49 billion — building consistently since the XRP ETF launch in November 2025 with only a single month of outflows (March 2026 at -$31.16M) across nine months of tracked data.
Five consecutive months of positive inflows — from February through July 2026 — confirm that institutional interest in XRP through the regulated ETF wrapper has been sustained and consistent rather than concentrated in the initial launch enthusiasm.
Total net assets at $1.02 billion — meaning XRP ETFs collectively hold over $1 billion in assets under management, a level that reflects genuine, durable institutional participation rather than speculative or short-term flows.
The consistency of the inflow data is particularly meaningful in the context of today’s breakout. When a technical breakout occurs in an asset with $1.49B in cumulative institutional ETF inflows — with those inflows being added to consistently month after month — the buying pressure behind the breakout has a structural foundation beyond pure chart pattern dynamics.
Connecting the Signals — Why Both Matter Together
As we covered in our XRP URPD on-chain support levels article — XRP has been building a base above the $1.00 psychological level for several weeks, with the URPD data showing significant volume concentration at key support levels. Today’s breakout from the converging triangle represents the technical expression of that base-building completing and resolving to the upside.
The ETF inflow data adds the institutional demand dimension — a breakout on the chart that is simultaneously supported by consistent institutional buying through the ETF wrapper is structurally more reliable than a technical pattern alone. The two signals reinforce each other: the chart shows where the supply-demand balance has shifted, and the ETF data shows who is on the demand side of that shift.
Key Levels — Full Picture
The $1.1070 support is the most important near-term level for maintaining the breakout’s validity. @alicharts specifically identified this as the support level for the breakout — meaning a sustained close below $1.1070 would suggest the breakout has failed and the triangle’s resolution is being reconsidered by the market.
The $1.30 target — visible on the chart as the upper boundary and confirmed by @alicharts — is the primary destination if the breakout sustains. From $1.14, reaching $1.30 requires a +14% continuation move.
Bottom Line
XRP’s confirmed breakout from its 1-hour triangle — with analyst @alicharts providing immediate confirmation of the pattern resolution — arrives alongside one of the most consistent institutional ETF inflow records among all crypto assets in 2026. Cumulative XRP Spot ETF inflows at $1.49 billion across nine months of data, with five consecutive positive months, confirm that the demand side of today’s breakout has institutional depth behind it.
Watch $1.1070 as the support that must hold to keep the breakout valid. Watch $1.22 as the intermediate check-point on the way to the $1.30 primary target that @alicharts has confirmed as the next major destination.
Frequently Asked Questions
What technical pattern did XRP break out from?
A descending triangle on the 1-hour chart — with a converging upper trendline and rising lower support — that had been building since late June 2026. The breakout occurred at approximately $1.133.
What do the XRP Spot ETF inflows show?
Cumulative net inflows have reached $1.49 billion across nine months — with five consecutive months of positive inflows from February through July 2026, and total net assets at $1.02 billion.
The opinions and market insights shared on CoinsProbe represent the views of individual authors based on prevailing market conditions at the time of publication. Cryptocurrency investments carry significant risk and volatility. Readers are encouraged to conduct their own research and seek professional financial advice before making investment decisions. CoinsProbe and its contributors do not accept responsibility for financial losses or decisions made based on published content.
CoinsProbe may publish sponsored articles, affiliate links, or promotional collaborations. All sponsored material is clearly labeled to maintain transparency with our audience. Our editorial decisions remain fully independent, and advertising partnerships do not influence reviews, rankings, or published opinions.
Since 2023, CoinsProbe has delivered reliable insights on cryptocurrency, blockchain, and digital assets. Our content is created by experienced researchers and analysts who follow strict editorial standards focused on accuracy, transparency, and credibility. Every article is carefully reviewed and verified using trusted sources and current market data. We provide unbiased analysis and timely updates covering everything from emerging crypto projects to major industry developments.