
- CRWV trades 39.56% below its 200-day SMA at $55 vs. $91 — deepest breakdown in the AI basket
- NVDA sits at exactly 0.00% deviation from its 200-day SMA at $204 — the single most pivotal swing level
- ORCL is 17.20% below its 200-day SMA while PLTR and MSFT remain +19.48% and +19.18% above respectively
A structural fracture is opening inside the AI trade — and the 200-day simple moving average is where it is showing up first. An analyst’s comparative scan of five leading AI-related stocks reveals a market that is no longer moving as one: two names have broken below their long-term trend lines, one is balanced exactly on the edge, and two remain comfortably above. That split, when it appears across a thematic basket, is one of the earliest signals that a narrative-driven rally is beginning to differentiate — and in some cases, unwind.
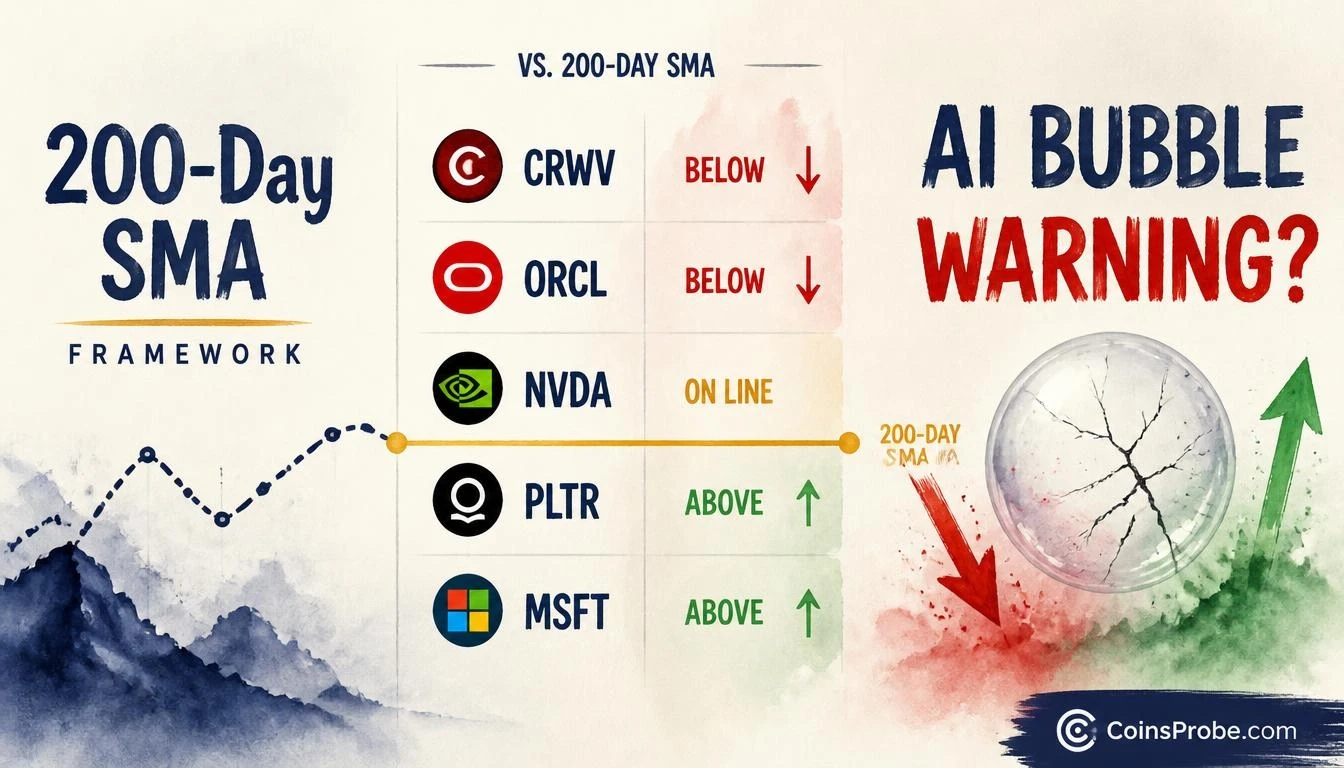
One analyst flagged the divergence on November 2, 2026, asking directly: “IS THE AI BUBBLE ABOUT TO BURST?” The accompanying chart compares each stock’s current price against its 200-day SMA, quantifying exactly how far each name sits above or below its long-term trend line. The data produces a picture that is more nuanced — and more concerning — than a simple bull-or-bear verdict.
The 200-Day SMA — What It Actually Measures
The 200-day simple moving average is not a momentum oscillator. It does not react to weekly noise. It averages the prior 200 daily closing prices, creating a slow-moving baseline that reflects long-term investor expectations rather than short-term sentiment. When a stock breaks below it — and stays below it — the signal is that the community of long-term holders has repriced their expectations downward. When the same break occurs across multiple names in a thematic basket simultaneously, it raises a harder question: is this stock-specific, or is the theme itself being repriced?
The analyst’s framework is precise: it is not a single close below the 200-day SMA that constitutes a warning. It is repeated failures to hold above it. That repetition is what “may signal a change in expectations” — not a one-day anomaly, but a pattern of rejection at the long-term trend line.
The Five-Stock Breakdown — Where Each AI Name Stands
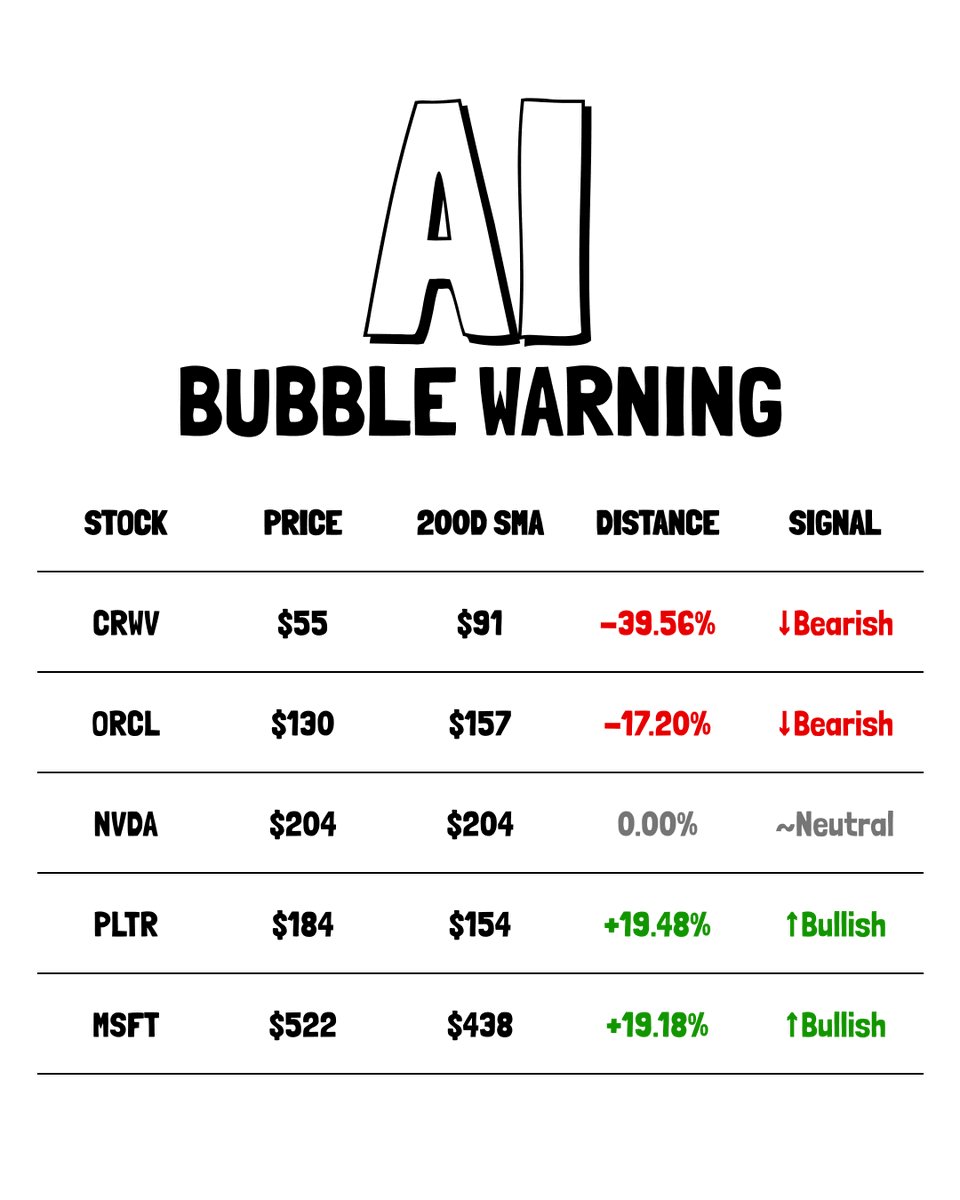
The chart the analyst shared quantifies the 200-day SMA deviation for each name explicitly. The numbers are not estimates — they are printed directly on the chart:
| Stock | Current Price | 200-Day SMA | Deviation | Signal |
|---|---|---|---|---|
| CRWV | $55 | $91 | −39.56% | ↓ Bearish — Below 200D SMA |
| ORCL | $130 | $157 | −17.20% | ↓ Bearish — Below 200D SMA |
| NVDA | $204 | $204 | 0.00% | ~ Neutral — At 200D SMA |
| PLTR | $184 | $154 | +19.48% | ↑ Bullish — Above 200D SMA |
| MSFT | $522 | $438 | +19.18% | ↑ Bullish — Above 200D SMA |
AI Stocks vs. 200-Day SMA | Source: @alicharts (X)
The split is clean. CoreWeave (CRWV) is 39.56% below its 200-day SMA — the deepest breakdown in the group by a significant margin. Oracle (ORCL) is 17.20% below. These are not borderline cases. A stock sitting 39% below its 200-day trend line has not simply had a bad week — it has experienced a sustained repricing that long-term holders have not reversed.
Nvidia (NVDA) sits at exactly $204 against a 200-day SMA of $204 — a 0.00% deviation, which places it at the single most pivotal position in the basket. It is neither confirmed bearish nor confirmed bullish. It is the swing vote. Whether Nvidia breaks below its 200-day SMA or reclaims it decisively may be the single most important near-term read on the AI theme’s structural health.
Palantir (PLTR) and Microsoft (MSFT) both trade approximately 19% above their respective 200-day SMAs — readings that indicate their long-term trend lines remain intact and rising. They are not participating in the breakdown.
Infrastructure vs. Beneficiaries — The Hidden Fault Line
The divergence is not random. It maps almost precisely onto the distinction between AI infrastructure builders and AI software beneficiaries. CRWV and ORCL are, in meaningful ways, picks-and-shovels names — companies whose valuations were priced for a specific level of AI infrastructure spending to materialize at a specific pace. PLTR and MSFT are software and platform names whose AI revenue streams are embedded within broader enterprise businesses.
When the infrastructure side breaks down while the software side holds, the market is making a specific judgment: that near-term AI capex expectations were too aggressive, but that AI adoption at the application layer remains intact. This is a meaningful distinction. It is not a wholesale AI bubble burst — it is a capital rotation that punishes the most valuation-sensitive, capex-exposed names while preserving those with diversified revenue.
The question the analyst’s chart poses is whether that rotation stabilizes here, or whether the breakdown in CRWV and ORCL eventually pulls Nvidia — and by extension, PLTR and MSFT — into a broader correction. Nvidia, balanced exactly at its 200-day SMA, is where that answer will first appear. The South Korean equity market has already shown how quickly sentiment can cascade when institutional confidence breaks — a pattern explored in detail in South Korea’s KOSPI Crashes 15% in 5 Days as Nasdaq Futures Fall 1%. The AI basket’s current fracture carries a structurally similar warning.
What “Repeated Falls Below the 200-Day SMA” Actually Means
The analyst’s specific language — “repeatedly fall below” — carries analytical weight. A single close below the 200-day SMA can be noise: a data release, an earnings miss, a broader market flush. The indicator becomes a genuine signal of changing expectations when a stock tests the 200-day SMA from below, fails to reclaim it, and then retests from below again. Each failed recovery attempt is the market collectively re-evaluating whether the prior growth assumptions embedded in the price were justified.
For CRWV at −39.56%, that question has been answered with force. At nearly 40% below its 200-day trend, the stock is not retesting — it is in sustained breakdown, reflecting a fundamental repricing of AI infrastructure spending expectations. For ORCL at −17.20%, the gap is narrower but still material. Neither name is close to a 200-day SMA reclaim that would neutralize the bearish signal.
Nvidia’s zero-deviation reading is what makes the next sessions consequential. A sustained break below $204 would shift Nvidia from neutral to bearish on this framework — taking the basket from 2-of-5 broken to 3-of-5, a majority. That would materially strengthen the case for a broader AI thematic correction rather than a sub-sector rotation.
The Broader Macro Context
The timing of this divergence matters. The analyst posted this analysis on November 2, 2026 — a moment when risk assets across multiple categories are navigating a more complex macro environment. Institutional positioning in AI-adjacent equities has been a defining feature of this market cycle, and the 200-day SMA framework the analyst applies here is one that institutional portfolio managers actively monitor. When infrastructure names break their long-term trend lines, the rebalancing pressure from passive and rules-based strategies compounds the initial move. For context on how macro election cycles can amplify or dampen such thematic rotations, see Bitcoin vs US Midterm Elections — Three Cycles, One Pattern.
The analyst’s question — whether the AI bubble is about to burst — is not answered by this single data point. But the 200-day SMA comparison does answer a narrower question: is the AI trade still unified? It is not. Two names are broken, one is on the edge, and two are holding. That fragmentation, when it appears in a thematic basket, historically precedes either a full-basket correction or a durable bifurcation between winners and losers within the theme.
Watch Nvidia at $204. It is the exact midpoint between the bulls and the bears in this basket. A decisive close below it would shift the weight of the 200-day SMA evidence from mixed to predominantly bearish across the AI infrastructure complex.
Source: x.comFrequently Asked Questions
What does it mean when a stock falls below its 200-day SMA?
Why is Nvidia’s position at its 200-day SMA so significant for the broader AI trade?
Are Palantir and Microsoft safe from an AI bubble correction given they’re above their 200-day SMAs?
What distinguishes an AI infrastructure breakdown from a full AI bubble burst?
Source: Ali Charts · Published by CoinsProbe Markets Desk
The opinions and market insights shared on CoinsProbe represent the views of individual authors based on prevailing market conditions at the time of publication. Cryptocurrency investments carry significant risk and volatility. Readers are encouraged to conduct their own research and seek professional financial advice before making investment decisions. CoinsProbe and its contributors do not accept responsibility for financial losses or decisions made based on published content.
CoinsProbe may publish sponsored articles, affiliate links, or promotional collaborations. All sponsored material is clearly labeled to maintain transparency with our audience. Our editorial decisions remain fully independent, and advertising partnerships do not influence reviews, rankings, or published opinions.
Since 2023, CoinsProbe has delivered reliable insights on cryptocurrency, blockchain, and digital assets. Our content is created by experienced researchers and analysts who follow strict editorial standards focused on accuracy, transparency, and credibility. Every article is carefully reviewed and verified using trusted sources and current market data. We provide unbiased analysis and timely updates covering everything from emerging crypto projects to major industry developments.