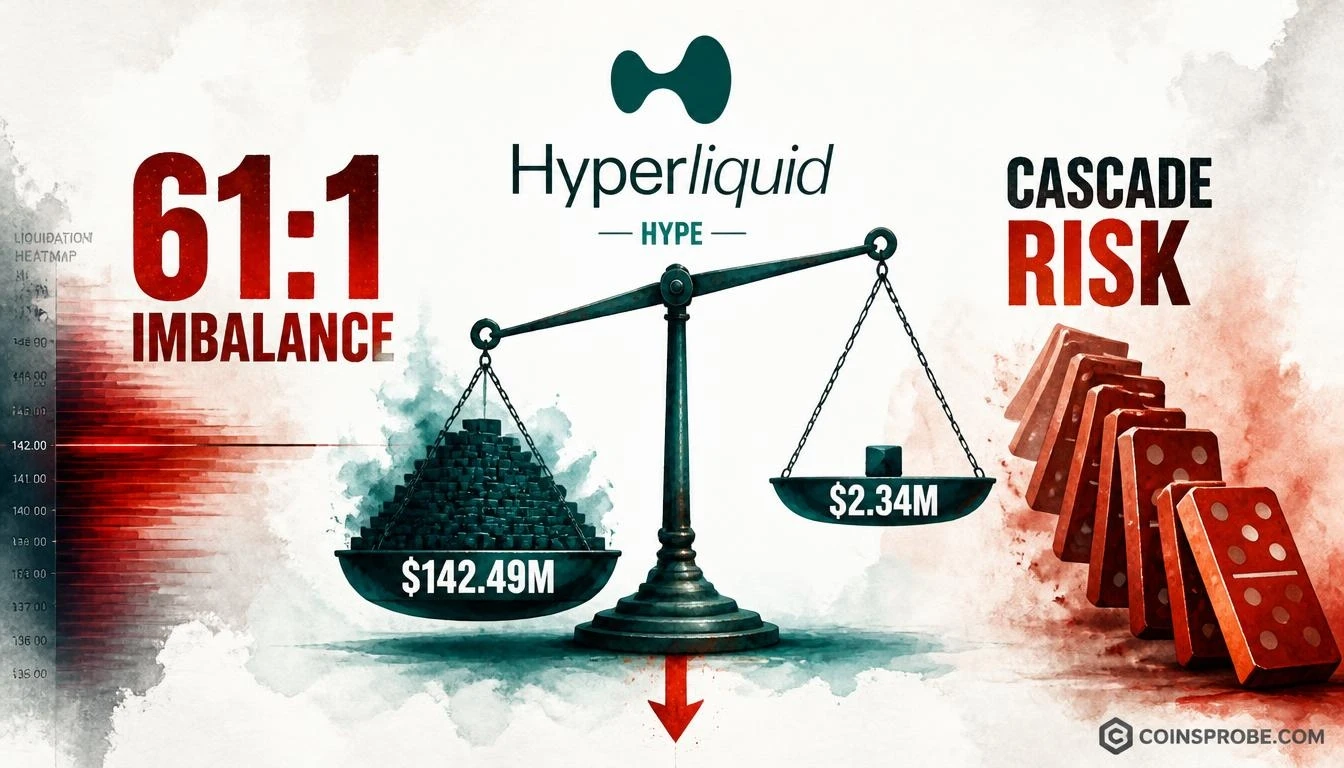

- $142.49M in HYPE long liquidations triggered by a 10% drop vs only $2.34M short exposure on a 10% rise
- 61:1 long-to-short liquidation imbalance flagged by on-chain analyst @joao_wedson via Alphractal as a cascade risk
- No sustained rally expected until liquidation ratio normalizes — excessive long leverage creates fragile market structure
- Alphractal Terminal launching for real-time on-chain liquidation monitoring — data sourced from Hyperliquid's transparent on-chain book
Hyperliquid’s derivatives market is sitting on a structural pressure point. With $142.49M in long liquidations triggered by a 10% price drop against just $2.34M in short liquidations if price rises 10%, the platform’s positioning data tells a lopsided story — one that on-chain analyst @joao_wedson, quoted in an Alphractal update, characterizes as a vulnerable structure capable of cascade selling.
The 61:1 long-to-short liquidation imbalance is not a market sentiment reading. It is a structural fact derived from on-chain liquidation level mapping. When a market is this skewed in one direction, a moderate adverse move does not produce moderate liquidations — it produces a chain reaction, as each forced close pushes price lower, triggering the next band of liquidations below it.
What the 61:1 Ratio Actually Means
The liquidation exposure figures cited by @joao_wedson are drawn from Hyperliquid’s on-chain data — every leveraged position on the platform is transparent and auditable in real time. The numbers as of the analysis snapshot: a 10% drop in HYPE would trigger $142.49M in long liquidations. A 10% rise would trigger only $2.34M in short liquidations. That is a ratio of 61:1.
To put that in context: for every dollar of short exposure that gets wiped out in a 10% rally, there are 61 dollars of long exposure that get wiped out in an equivalent decline. This is not a market in equilibrium. It is a market where participants have collectively built a heavily one-sided book, and the risk is concentrated entirely on the downside.
The mechanism matters here. On Hyperliquid, liquidations happen on-chain and transparently, which is precisely why this data is actionable. When a large band of longs gets liquidated, those positions are force-sold into the market. That selling pressure moves price lower, which then hits the next liquidation band. The cascade effect is not theoretical — it is the structural consequence of this kind of positioning imbalance. This dynamic is relevant context given the broader altcoin leverage picture discussed in Bitcoin’s $1.1B Leverage Flush — Why the Pain May Set Up the Next Move.
The Analyst’s Call — No Sustained Rally Until Metrics Improve
@joao_wedson’s conclusion, as aggregated by Alphractal, is explicit: the current metric profile does not support a sustained rally. The excessive long leverage creates a structure that is vulnerable to downside — not because of any external catalyst, but because the internal positioning is fragile. Any selling pressure, however small in origin, can amplify through the liquidation cascade into a materially larger price move.
The watch condition is equally clear: until the long-to-short liquidation ratio normalizes — meaning longs are either closed, liquidated down to manageable levels, or offset by genuine short interest building on the other side — the structural risk remains. A 61:1 ratio returning toward, say, 5:1 or 10:1 would indicate that the leverage overhang has been absorbed. That condition has not been met at time of writing.
It is also worth noting that Alphractal flagged this data in the context of their upcoming Terminal product — described as offering real-time monitoring of exactly this type of on-chain liquidation level data starting the following week. The implication is that this kind of positioning snapshot, previously requiring manual extraction, will be continuously trackable.
Why Leverage Imbalances Are Dangerous at This Magnitude
Leverage imbalances at the 61:1 scale are not common. For reference, a typical healthy market might show long and short liquidation exposure within a factor of 2–3x of each other, reflecting genuine two-way conviction. A 61:1 reading indicates that the market is overwhelmingly positioned for continued upside — and that the downside scenario is under-hedged by an extreme margin.
The risk is not simply that longs get liquidated. The risk is sequencing: if HYPE drops 5% and triggers a portion of that $142.49M long stack, the resulting sell pressure from forced closures can push the asset another 3–4% lower without any new sellers entering the market. The market sells itself down through its own liquidation queue. This pattern, known in derivatives markets as a liquidation cascade, has been the mechanism behind some of crypto’s sharpest intraday corrections. The TOTAL2 breakdown pattern earlier in this cycle illustrated how leverage-heavy altcoin markets can reprice sharply when structural support fails.
What Would Change the Picture
Three developments would materially reduce the structural risk flagged by this data:
1. Organic deleveraging: Longs voluntarily close or reduce leverage, bringing the $142.49M exposure down without a price shock. This would show up as declining open interest on the long side without a corresponding price drop.
2. Short interest builds: The $2.34M short liquidation exposure increases substantially, meaning more participants are hedging or positioning short — this naturally rebalances the ratio and provides a cushion if price drops.
3. Price absorbs the liquidation bands: A moderate price correction triggers and clears a portion of the long stack, resetting positioning to a healthier baseline. This is the most uncomfortable path to normalization, but structurally it resolves the imbalance.
Until one of these three occurs, the analysis from @joao_wedson holds: the structure is vulnerable, sustained upside is unlikely, and the risk is asymmetrically to the downside. The Alphractal Terminal’s real-time monitoring — set to launch shortly after this analysis was published — will make tracking these shifts significantly more accessible.
For broader context on how leverage events have reset positioning in this market cycle, see Bitcoin TD Sequential Prints 3-Day Buy Signal.
Frequently Asked Questions
What does a 61:1 long/short liquidation imbalance mean for HYPE?
What is a liquidation cascade and how does it apply to Hyperliquid?
What conditions would need to be met before HYPE could sustain a rally?
Is the $142.49M liquidation exposure a real-time figure or a projection?
Source: Alphractal · Published by CoinsProbe Markets Desk
The opinions and market insights shared on CoinsProbe represent the views of individual authors based on prevailing market conditions at the time of publication. Cryptocurrency investments carry significant risk and volatility. Readers are encouraged to conduct their own research and seek professional financial advice before making investment decisions. CoinsProbe and its contributors do not accept responsibility for financial losses or decisions made based on published content.
CoinsProbe may publish sponsored articles, affiliate links, or promotional collaborations. All sponsored material is clearly labeled to maintain transparency with our audience. Our editorial decisions remain fully independent, and advertising partnerships do not influence reviews, rankings, or published opinions.
Since 2023, CoinsProbe has delivered reliable insights on cryptocurrency, blockchain, and digital assets. Our content is created by experienced researchers and analysts who follow strict editorial standards focused on accuracy, transparency, and credibility. Every article is carefully reviewed and verified using trusted sources and current market data. We provide unbiased analysis and timely updates covering everything from emerging crypto projects to major industry developments.