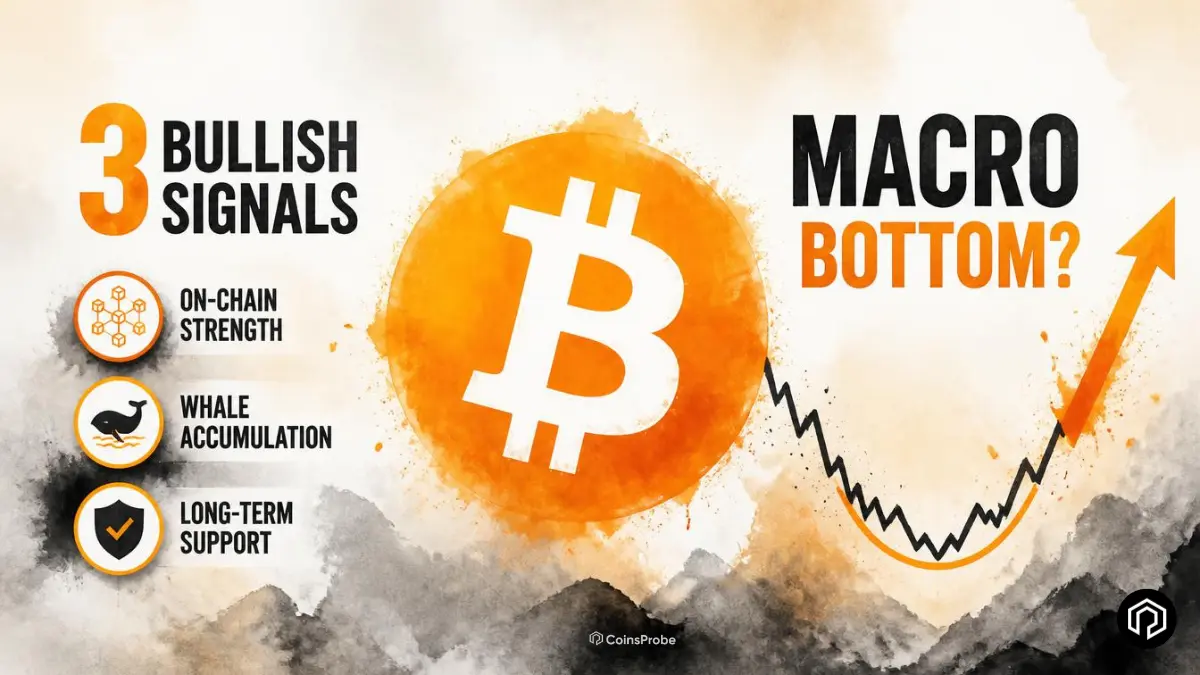

- Bitcoin is up 5.35% over the past 30 days, as @alicharts suggests the macro bottom may already be in.
- The monthly TD Sequential has flashed a buy signal, the same indicator that marked Bitcoin's 2022 market bottom.
- Bitcoin is holding near the 50-month SMA, a level that has supported every major market bottom since 2014.
- The Chande Momentum Oscillator (CMO) has dropped to -71, matching historically oversold levels seen at previous cycle bottoms.
Three separate monthly chart signals — each with a documented track record of appearing at Bitcoin’s major cycle bottoms — are all firing simultaneously in the current environment. @alicharts has presented each one separately and the combined picture is the most comprehensive monthly bottom signal case Bitcoin has shown since the 2022 lows.
Bitcoin is trading at approximately $65,177 — up +1.59% in 24 hours and +5.35% over 30 days — with a market cap of approximately $1.3 trillion. Despite remaining -26% year-to-date from the $126,000 all-time high, three monthly timeframe signals are converging on the same conclusion that each prior instance of this alignment has produced: a durable macro bottom.

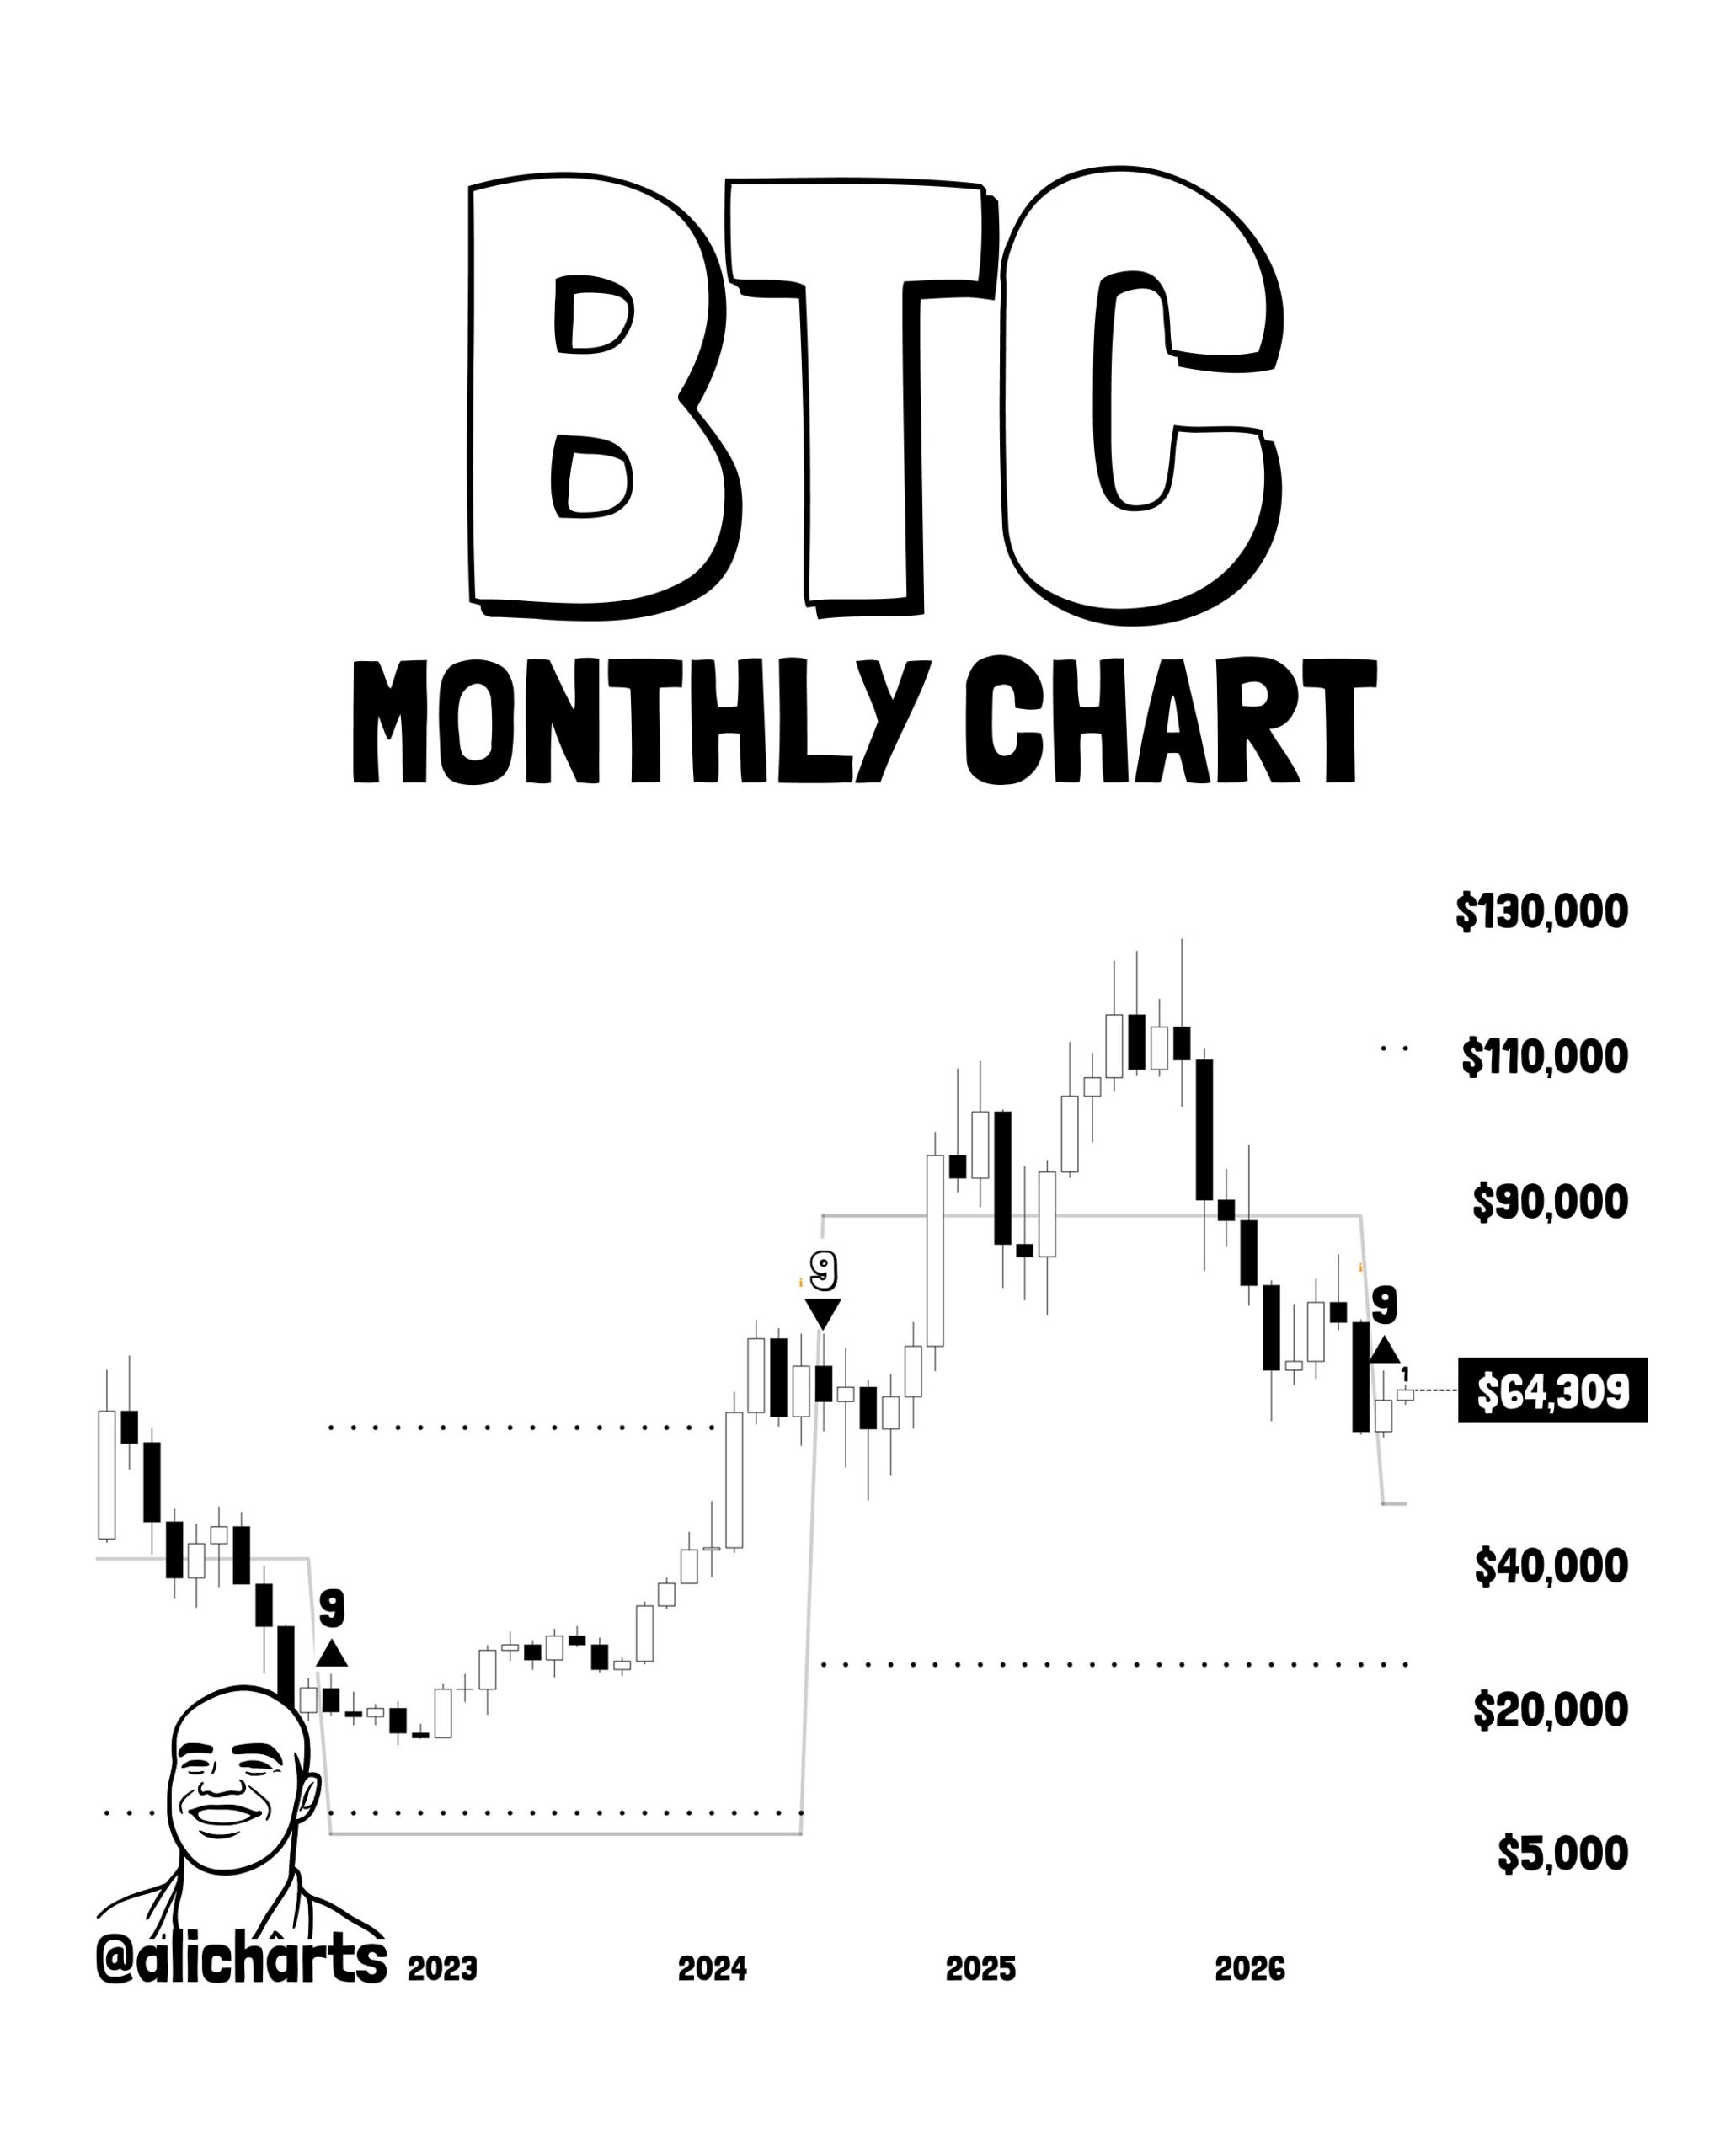
Chart 1 — Monthly TD Sequential Buy Signal
The monthly TD Sequential has printed a buy signal “9” on Bitcoin’s current monthly chart — visible on the right side of the chart at the $64,309 current price level.
Reading the chart:
The @alicharts monthly chart shows two prior TD Sequential signals on the same timeframe:
- First “9” sell signal (visible at approximately 2024–2025) — appeared near Bitcoin’s peak before the current corrective phase
- Second “9” buy signal — appearing now at $64,309 — the signal that historically marks the transition from corrective phase to recovery
The 2022 precedent:
The most directly comparable prior instance on this chart is the 2022 monthly TD Sequential buy signal — which appeared at Bitcoin’s cycle low near $15,500–$16,000 and successfully identified what turned out to be the bottom of the 2022 bear market. What followed was the recovery that eventually took Bitcoin to its $126,000 all-time high.
The prior cycle returns documented on the chart:
The chart annotates the rallies that followed each prior comparable setup:
| Cycle | Rally from Bottom |
|---|---|
| Early cycle (2011–2012) | +28,737.21% |
| 2015 cycle | +8,294.24% |
| 2019 cycle | +1,967.94% |
| 2022–2023 cycle | +675.66% |
| Current (2026) | Signal printing now at $64,309 |
Each successive cycle has produced a smaller percentage gain as Bitcoin’s market cap grows — but each has still produced extraordinary returns from the signal level. The current signal appearing at $64,309 does not predict the magnitude of the next move — it identifies the potential transition point, consistent with every prior instance.
Chart 2 — 50-Month SMA: Every Major Bottom Since 2014
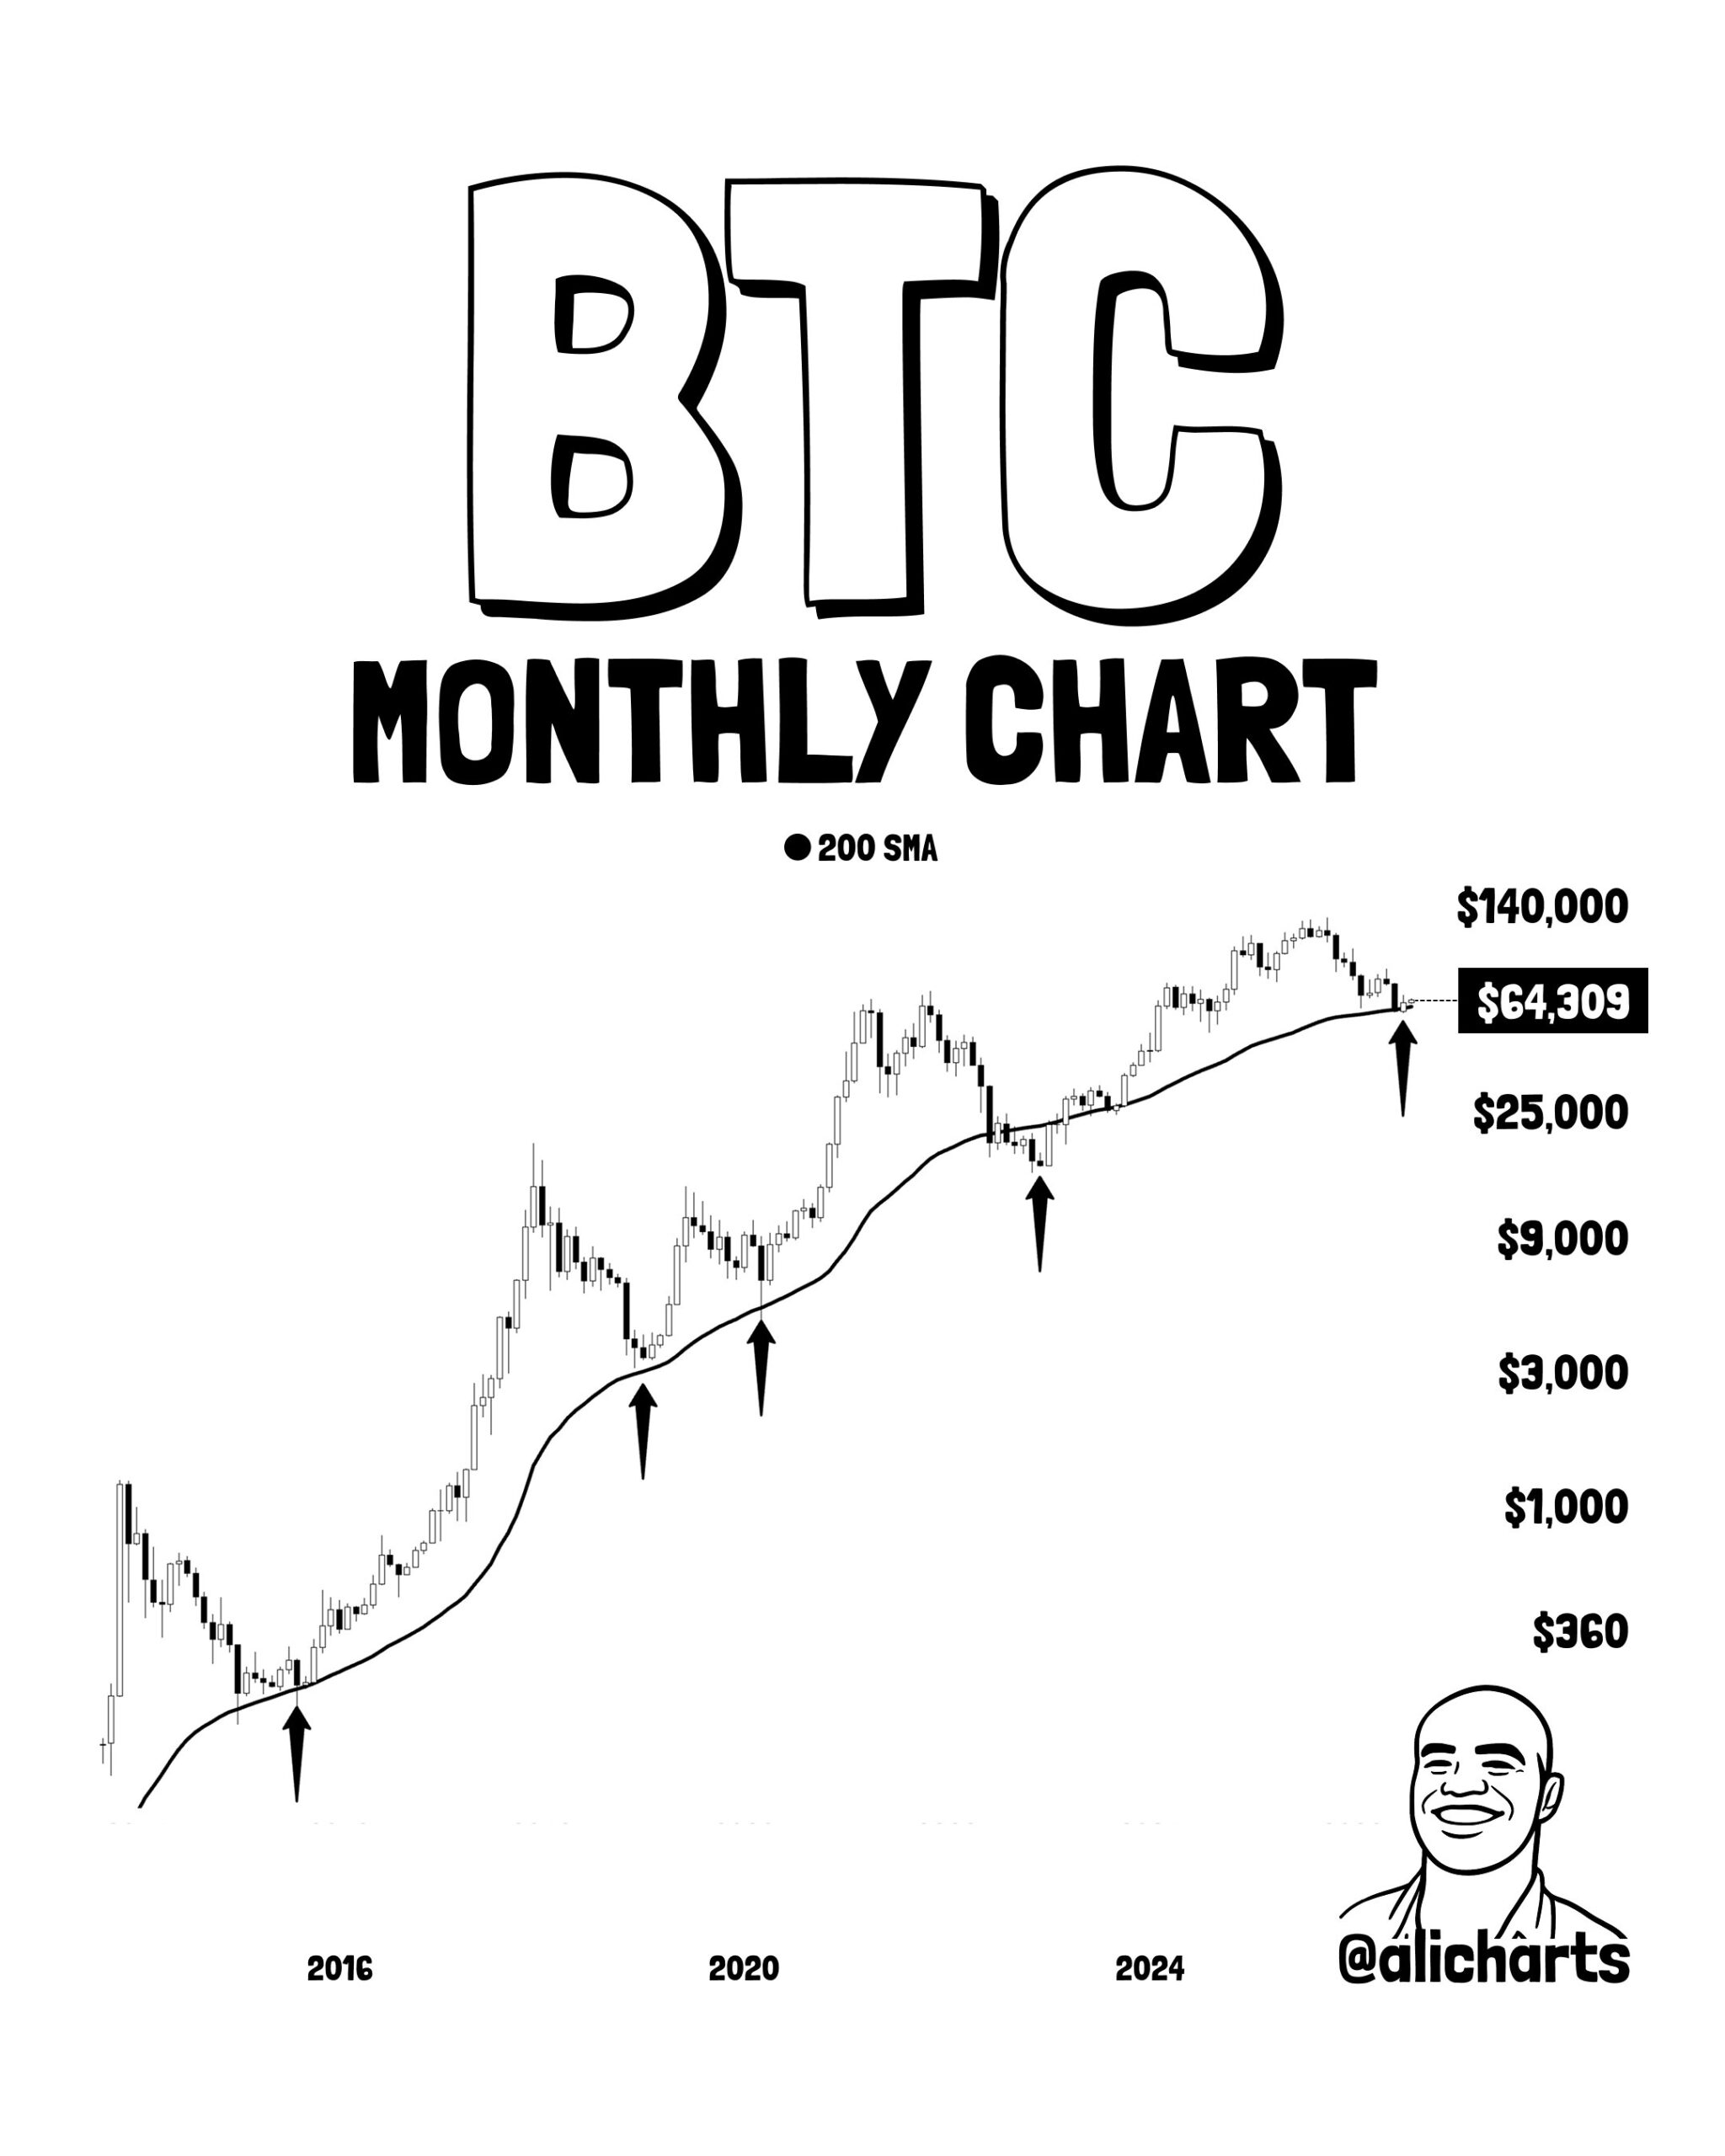
The second chart from @alicharts focuses on a different monthly signal — Bitcoin’s relationship to its 50-month simple moving average (labelled as 200 SMA on the chart).
Reading the chart:
The chart spans from 2016 to 2026, showing the 50-month SMA as a rising curved line beneath Bitcoin’s price. Black arrows mark each prior instance where Bitcoin’s price touched or tested this moving average — each of which represented a major buying opportunity:
| Year | Bitcoin Price at 50-Month SMA Touch | What Followed |
|---|---|---|
| ~2015 | ~$200–$300 | 2017 bull market |
| ~2019 | ~$3,000–$4,000 | 2020–2021 bull market |
| ~2020 | ~$5,000–$7,000 (COVID crash) | Immediate recovery and ATH |
| ~2022 | ~$17,000–$20,000 | 2023–2026 bull market |
| 2026 (Current) | ~$64,309 | Arrow marks current position |
Bitcoin is currently trading near — and testing — the 50-month SMA for the first time since the 2022 cycle low. The current price of $64,309 sits approximately at this long-term moving average, with the chart’s most recent arrow pointing directly to the current position.
The significance:
Every prior touch of the 50-month SMA has preceded a sustained multi-year bull market — not a brief bounce, but a structural trend change that lasted months to years. The current test of this level in 2026 adds the longest-term moving average in Bitcoin’s analytical toolkit to the list of signals pointing toward the same conclusion.
Chart 3 — Chande Momentum Oscillator Resets to -71
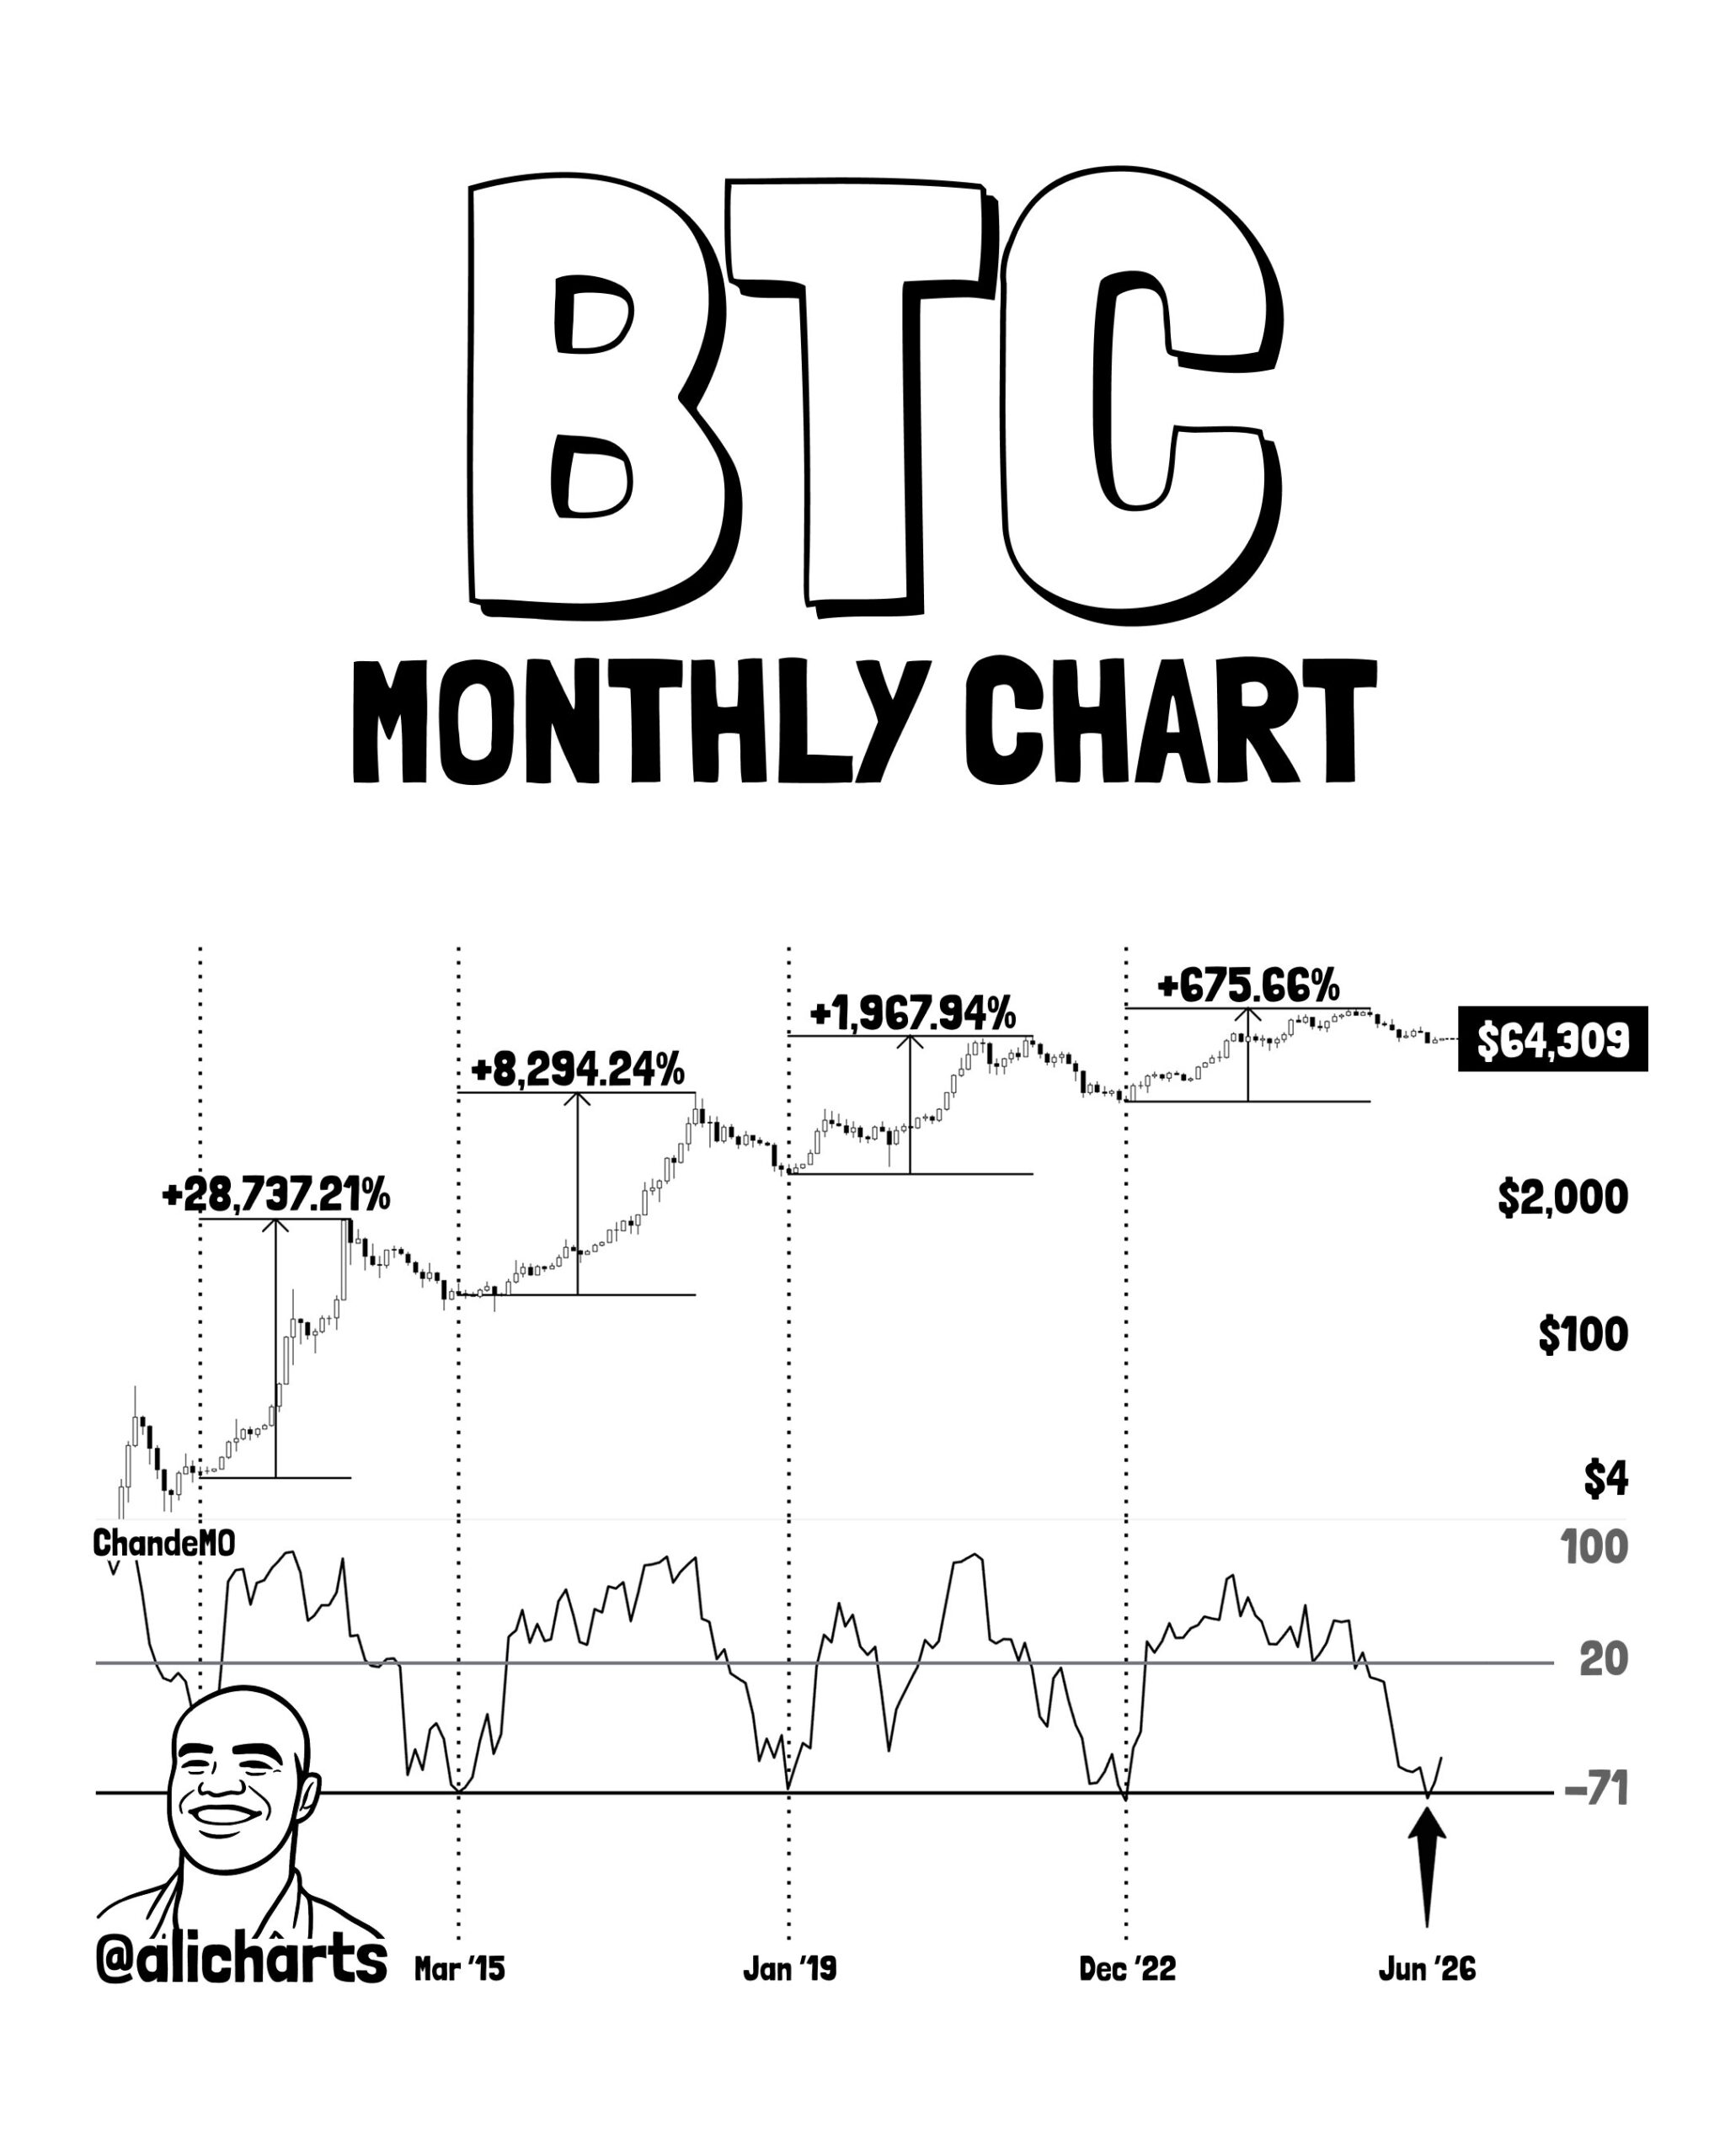
The third signal identified by @alicharts is the Chande Momentum Oscillator (CMO) resetting to -71 on the monthly chart — the most extreme oversold reading visible on the current chart.
Reading the chart:
The @alicharts monthly chart shows the ChandeMO (lower panel) oscillating between approximately +100 (extremely overbought) and -71 (extremely oversold) across Bitcoin’s full cycle history. The current reading at -71 — marked by the arrow at Jun ’26 — is the deepest oversold reading shown on the chart.
The four prior extreme lows:
Each prior time the ChandeMO reached comparable extreme readings (marked by the dotted lines on the chart), it coincided with major Bitcoin cycle bottoms:
| Period | ChandeMO Reading | Bitcoin Bottom |
|---|---|---|
| Mar 2015 | Extreme low | 2015 cycle bottom |
| Jan 2019 | Extreme low | 2018–2019 cycle bottom |
| Dec 2022 | Extreme low | 2022 cycle bottom |
| Jun 2026 | -71 | Current — deepest reading shown |
The current -71 reading is visually the most extreme on the chart — even deeper than the prior instances — suggesting the current momentum exhaustion on the monthly timeframe is historically unprecedented in its severity.
Why extreme CMO readings matter:
The Chande Momentum Oscillator measures the sum of recent gains minus recent losses relative to total movement — when it reaches extreme negative levels, it signals that bearish momentum has been so dominant and sustained that it has historically exhausted itself and preceded a reversal. At -71 on the monthly timeframe, the indicator is saying that twelve months of momentum data shows overwhelming selling — the same reading that has appeared before every major Bitcoin recovery.
Three Signals — One Conclusion
@alicharts’ analysis presents three independent monthly signals — each measured differently, each with its own historical track record — all firing simultaneously:
| Signal | Reading | Historical Precedent |
|---|---|---|
| Monthly TD Sequential | Buy “9” at $64,309 | Identified 2022 bottom |
| 50-Month SMA | Price testing the level | Every major bottom since 2014 |
| ChandeMO | -71 (extreme low) | 2015, 2019, 2022 bottoms |
The consolidation range @alicharts identifies for the near term: $60,000–$67,000 — acknowledging that even with these signals present, Bitcoin may continue to consolidate within this range before the next directional move becomes clear.
The Broader Signal Convergence
These three monthly signals from @alicharts add to the growing body of convergent bottom signals we have been tracking throughout July and August 2026 — including the MVRV at the 5th percentile, the Realized Profit vs Loss crossover approaching, the 147-day weekly bullish divergence, Bitcoin August Price Prediction, and the whale vs retail divergence with Santiment confirming accumulation.
Every independent analytical framework applied to Bitcoin’s current situation is arriving at the same conclusion — the current price zone has historically been where macro bottoms form.
Bottom Line
Three separate monthly signals — a TD Sequential buy, a 50-month SMA test, and a ChandeMO at -71 — are all firing simultaneously on Bitcoin’s highest timeframe chart. Each signal has a documented track record of appearing at Bitcoin’s major cycle bottoms: 2015, 2019, and 2022. Their simultaneous appearance in June–August 2026 at approximately $64,000 creates the most concentrated monthly signal convergence Bitcoin has shown since the 2022 lows.
The near-term consolidation range of $60,000–$67,000 remains the battleground. Whether the macro bottom is already in — or whether one final move lower completes the bottom structure — these three monthly signals will be the framework analysts reference when the next major directional move confirms.
Frequently Asked Questions
Which signals are indicating a Bitcoin bottom or recovery?
Three key monthly signals are currently aligning: the TD Sequential buy signal, Bitcoin trading near its 50-month simple moving average, and the Chande Momentum Oscillator resetting to extreme oversold levels near -71.
What is the TD Sequential signal on Bitcoin?
The TD Sequential recently flashed a buy signal on the monthly chart. This rare indicator previously marked the 2022 market bottom and is now appearing again.
Why is the 50-month moving average important for Bitcoin?
Since 2014, the 50-month SMA has repeatedly acted as major multi-year support and has aligned with significant market bottoms.
What does the Chande Momentum Oscillator show for BTC?
The CMO has dropped to -71, a level that historically coincides with major bottoms. The last time it reached this reading was when Bitcoin fell toward $57,000 in June.
Will Bitcoin recover in the rest of 2026?
While no outcome is guaranteed, the combination of these monthly technical signals in August 2026 suggests a macro bottom may already be forming, which could support a recovery phase through the remainder of 2026 if the signals hold.
The opinions and market insights shared on CoinsProbe represent the views of individual authors based on prevailing market conditions at the time of publication. Cryptocurrency investments carry significant risk and volatility. Readers are encouraged to conduct their own research and seek professional financial advice before making investment decisions. CoinsProbe and its contributors do not accept responsibility for financial losses or decisions made based on published content.
CoinsProbe may publish sponsored articles, affiliate links, or promotional collaborations. All sponsored material is clearly labeled to maintain transparency with our audience. Our editorial decisions remain fully independent, and advertising partnerships do not influence reviews, rankings, or published opinions.
Since 2023, CoinsProbe has delivered reliable insights on cryptocurrency, blockchain, and digital assets. Our content is created by experienced researchers and analysts who follow strict editorial standards focused on accuracy, transparency, and credibility. Every article is carefully reviewed and verified using trusted sources and current market data. We provide unbiased analysis and timely updates covering everything from emerging crypto projects to major industry developments.