
- Bitcoin trades at $82,365 (-0.37% 24h) with a $1.655T market cap amid a pullback from 2025 highs
- CryptoQuant CEO Ki Young Ju: "Bitcoin is still in the early bull phase" — backed by 13-indicator on-chain heatmap
- Key indicators still green: Bull/Bear Indicator, NUPL, Adjusted SOPR, and Analyst Consensus Index
- Regime flip risk: heatmap turning red majority across all 13 indicators is the invalidation signal — not a price level
Bitcoin is trading at $82,365 — down just 0.37% in the past 24 hours — with a market capitalization of $1.655 trillion. The pullback from 2025 highs has triggered bear market calls across social media. CryptoQuant’s founder is not among them.
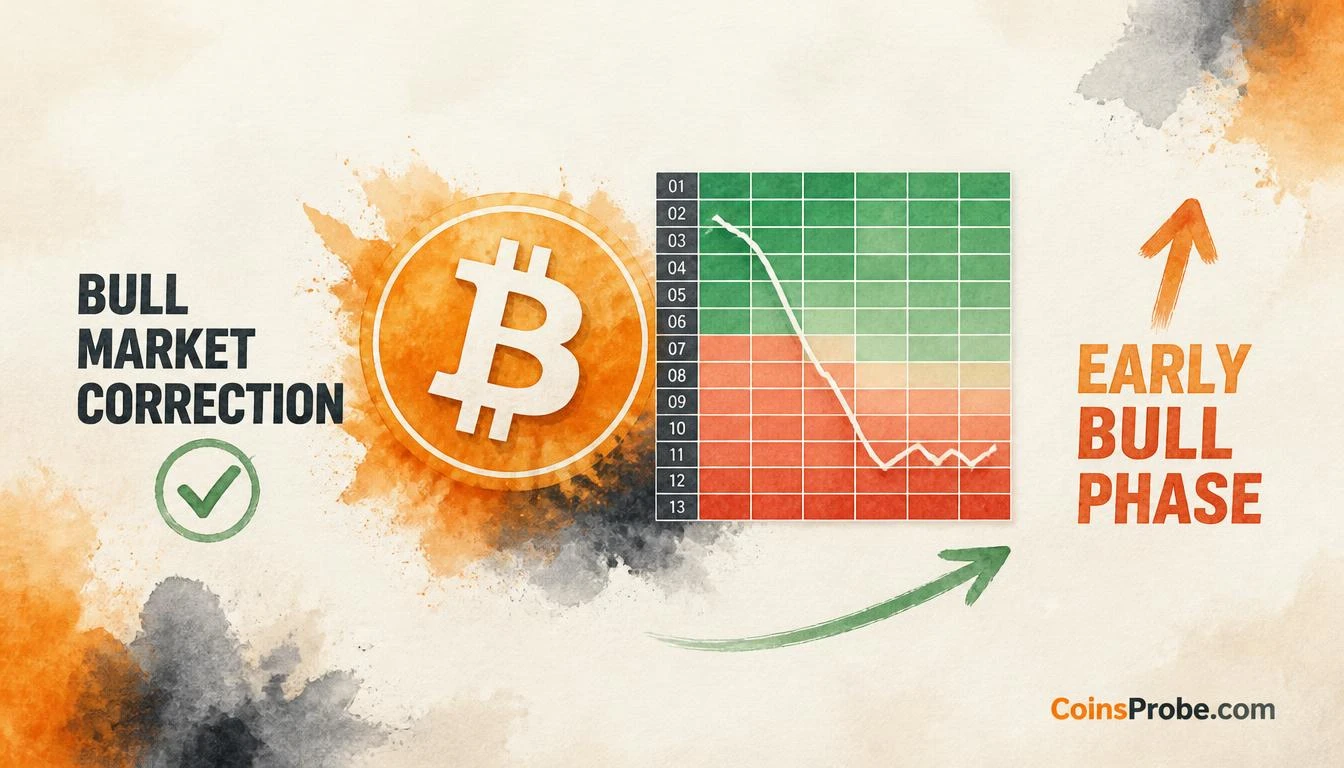
Ki Young Ju (@ki_young_ju), founder and CEO of on-chain analytics platform CryptoQuant, issued a direct call on October 9, 2026: “Don’t confuse a bull market correction with a bear market. Bitcoin is still in the early bull phase. BTFD.” The declaration is not a price target. It is a regime call — backed by a thirteen-indicator on-chain heatmap that Ju publishes as CryptoQuant’s composite market cycle signal.
The Heatmap — Thirteen Indicators, One Regime Verdict
The Bull/Bear Heatmap that anchors Ju’s thesis aggregates thirteen independent on-chain signals into a single color-coded matrix. Each row is a separate metric. Each column is a time period. Green means the indicator is reading bull-market conditions. Red means bear-market conditions. The framework spans Bitcoin’s full 2020–2026 price history, allowing a direct visual comparison of current readings against confirmed prior bear markets — specifically the 2022 collapse from $69,000 to $15,500.
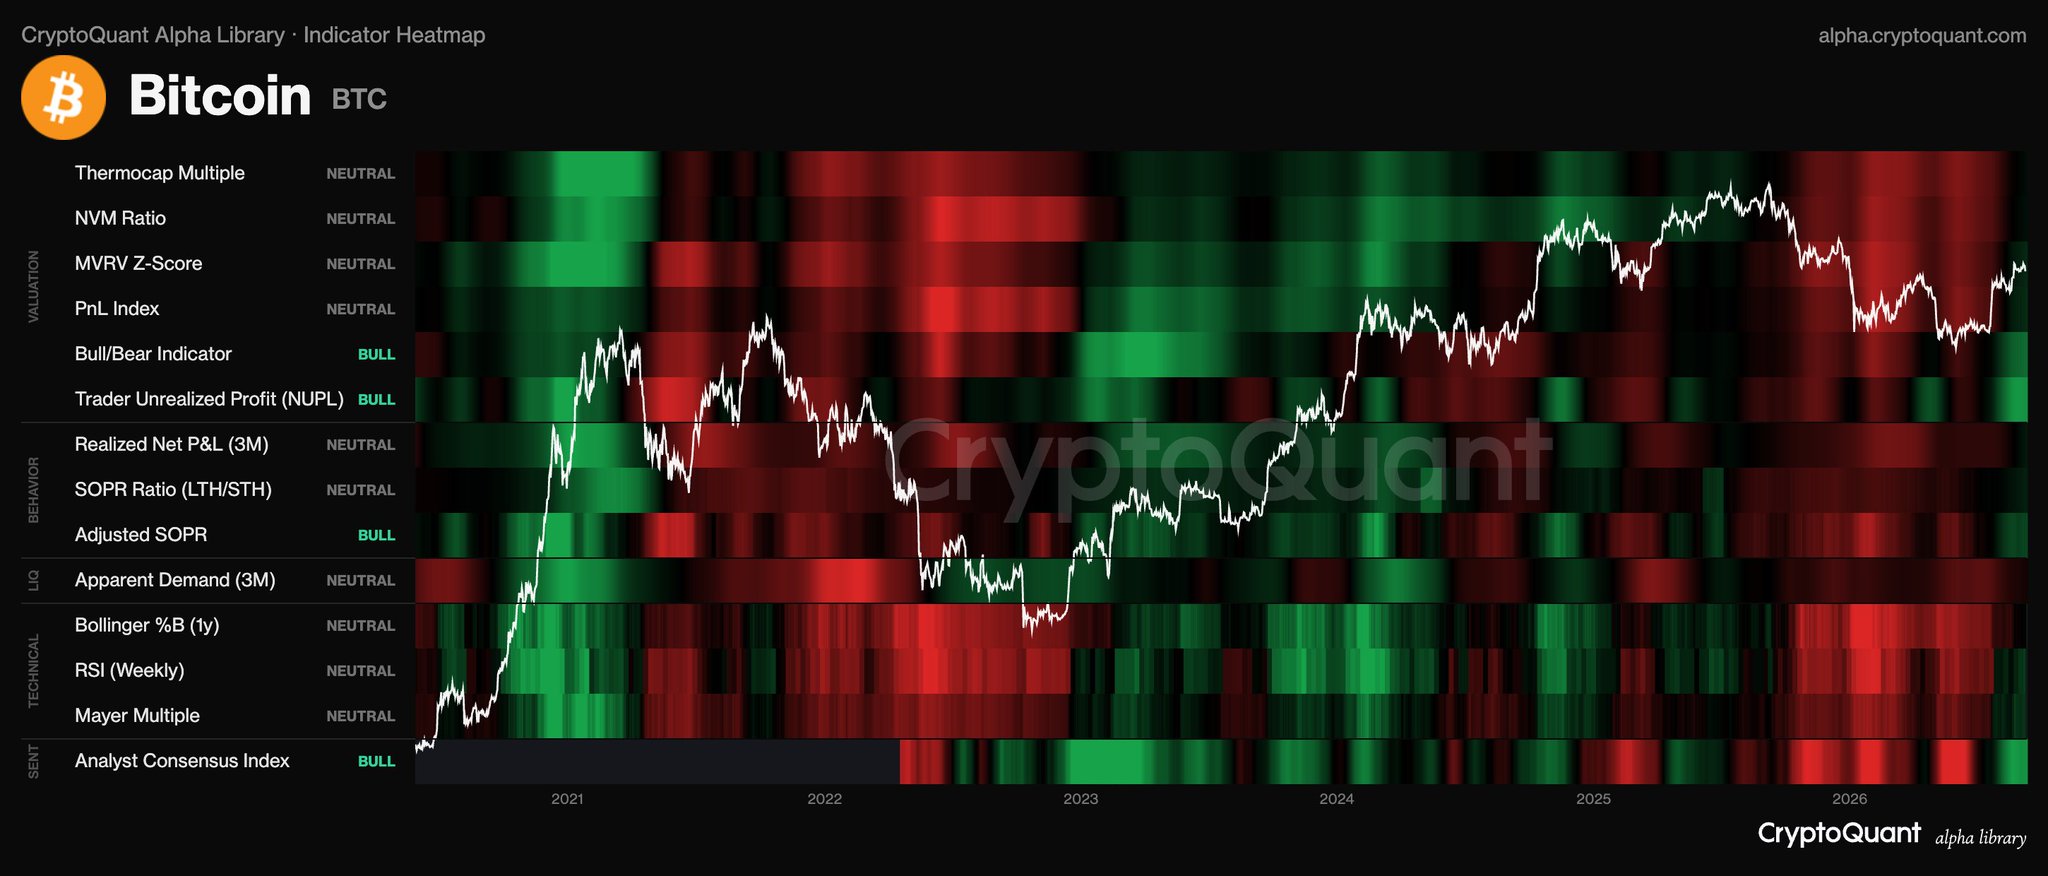
As of the October 9 reading, the rightmost columns of the heatmap — representing current conditions — show a mixed but predominantly green profile. Multiple indicators remain in confirmed bull territory: the Bull/Bear Indicator, Trader Unrealized Profit (NUPL), Adjusted SOPR, and the Analyst Consensus Index are all flagged green. The 2022 bear market, by contrast, produced a near-uniform red sweep across all thirteen rows. That structural difference is the analytical foundation for Ju’s regime call.
This is a critical distinction. In a genuine bear market, on-chain behavior shifts broadly and simultaneously: unrealized losses dominate, spent outputs register at losses (SOPR below 1), and the Bull/Bear composite flips to red across the majority of its components. None of those conditions are present in the current reading. What is present — a price decline from a prior peak with several indicators still registering bullish readings — is consistent with every major bull market correction Bitcoin has produced since 2013, including the 2021 corrections of 53% and 29% that preceded new all-time highs.
Why This Correction Is Not a Bear Market — The On-Chain Case
The white price line in Ju’s chart traces Bitcoin’s full cycle from 2020 through mid-2026. The deep trough visible in the 2022–2023 period — the confirmed bear market — coincided with the heatmap’s broadest and most sustained red reading across all thirteen indicators. The current pullback from the 2025 peak shows a partial decline in the price line, but the heatmap beneath it has not reproduced that uniform red pattern. Several rows that turned red in 2022 remain green today.
This is the mechanism behind Ju’s argument: if this were a structural bear market, the on-chain data would be confirming it across the majority of his thirteen metrics. It is not. The indicators that specifically measure whether holders are in profit (NUPL), whether coins are being spent at a loss (SOPR), and whether the broader analyst community has shifted bearish (Analyst Consensus Index) are still reading bull-phase conditions. A price decline while these metrics remain green is the textbook definition of a correction within an ongoing trend — not a trend reversal.
For context on the broader market environment, the recent leverage flush that affected multiple assets — detailed in this CoinsProbe analysis of the leverage washout across major assets — is consistent with a healthy correction dynamic rather than structural capitulation. Forced liquidations clearing leveraged positions while spot holders remain in profit is a pattern that has appeared repeatedly during bull market consolidations.
“BTFD” — What the Call Actually Requires
Ju’s instruction to “Buy The F***ing Dip” is a regime-conditional call. It is valid only if the heatmap’s green majority holds. The risk scenario is specific: if the indicators that are currently mixed — the rows showing partial red — deteriorate further and the heatmap flips to a red majority, the regime characterization changes. Ju has not specified a price level at which that flip would occur, and no price level should be inferred from the heatmap alone. The signal is composite and on-chain, not price-chart derived.
What Ju is not saying is also important: he is not calling a bottom. He is not providing a price target. He is making a market phase identification — that the current environment is a bull market correction phase, which historically has been the higher-probability buying zone rather than the exit zone. The word “early” in “early bull phase” carries analytical weight: it implies the cycle has not reached the distribution phase where on-chain metrics would begin to broadly deteriorate.
Bullish Scenario
If the heatmap’s green indicators hold and the mixed indicators stabilize, Bitcoin’s current price action at $82,365 represents the correction phase within an ongoing bull cycle. Prior confirmed bull market corrections of this character — where multiple on-chain indicators remained green during the price pullback — have resolved to new cycle highs. The 2021 corrections that produced 53% and 29% drawdowns while NUPL remained in the “belief” zone both preceded subsequent all-time highs.
Bearish Scenario
If the currently mixed indicators in the heatmap deteriorate further — specifically if NUPL, Adjusted SOPR, and the Bull/Bear Indicator flip to red — the regime characterization changes. A broad red sweep across the majority of the thirteen indicators would be the on-chain signal that Ju’s bull market thesis is invalidated. That is the condition to monitor, not a specific price level.
Separately, traders watching the altcoin space alongside Bitcoin’s cycle position may find the SUI monthly close analysis relevant — that signal offers a complementary view on where the broader crypto cycle stands from a price-structure perspective.
Ki Young Ju’s verdict is unambiguous: thirteen on-chain indicators, several still reading bull-phase conditions, during a price pullback from 2025 highs does not constitute a bear market. It constitutes a correction. The heatmap’s color distribution — green majority with a mixed fringe — is the exact configuration that has historically appeared during bull market drawdowns, not during structural reversals. At $82,365, the regime call is intact. The level to watch is not a price on a chart — it is the moment the heatmap’s green majority flips. Until it does, Ju’s framework says the dip is the opportunity, not the warning.
Frequently Asked Questions
What is the CryptoQuant Bull/Bear Heatmap and how does it work?
Which specific indicators are still reading bullish for Bitcoin right now?
What would invalidate Ki Young Ju’s ‘early bull phase’ call?
How does a bull market correction differ from a bear market according to on-chain data?
Source: Ki Young Ju · Published by CoinsProbe Markets Desk
The opinions and market insights shared on CoinsProbe represent the views of individual authors based on prevailing market conditions at the time of publication. Cryptocurrency investments carry significant risk and volatility. Readers are encouraged to conduct their own research and seek professional financial advice before making investment decisions. CoinsProbe and its contributors do not accept responsibility for financial losses or decisions made based on published content.
CoinsProbe may publish sponsored articles, affiliate links, or promotional collaborations. All sponsored material is clearly labeled to maintain transparency with our audience. Our editorial decisions remain fully independent, and advertising partnerships do not influence reviews, rankings, or published opinions.
Since 2023, CoinsProbe has delivered reliable insights on cryptocurrency, blockchain, and digital assets. Our content is created by experienced researchers and analysts who follow strict editorial standards focused on accuracy, transparency, and credibility. Every article is carefully reviewed and verified using trusted sources and current market data. We provide unbiased analysis and timely updates covering everything from emerging crypto projects to major industry developments.