- GOOGL consolidating in symmetrical triangle since May — analyst watching close above $360 to confirm breakout toward $400 target (~11%)
- PLTR at year-long channel ceiling ($210 on chart) — sustained close above analyst's $207 trigger could signal new all-time high
- NFLX double bottom at $67 support with current price at $70.80 — $83–$84 resistance zone is the breakout confirmation level
Three major U.S. equities are approaching critical technical inflection points simultaneously — and technical analyst Ali Martinez (@alicharts) has mapped out exactly what confirmation looks like for each. In a five-part Friday thread, Martinez identified Alphabet (GOOGL), Palantir Technologies (PLTR), and Netflix (NFLX) as the setups he is actively watching for directional resolution, with specific close-above triggers for each.
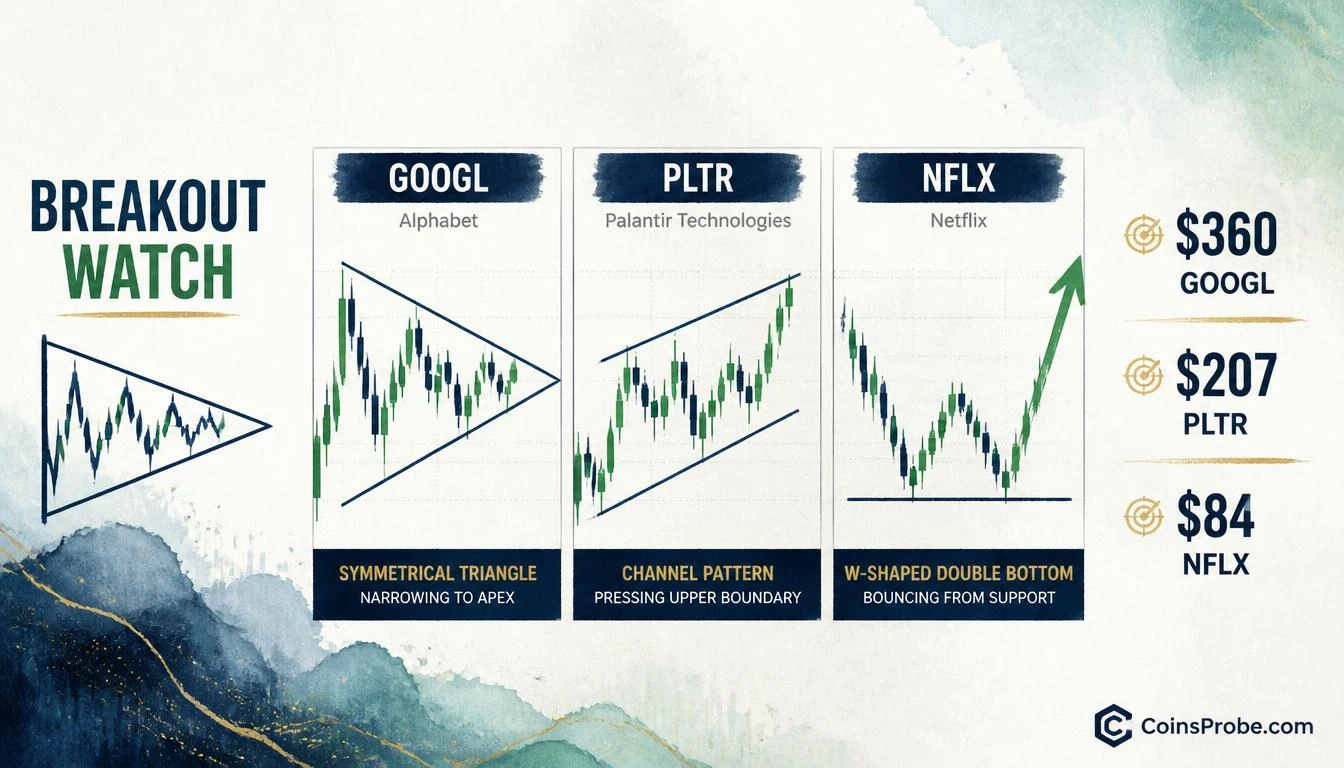
The thread is not a purchase order. It is a condition-based framework: each setup requires a confirmed close above a defined level before the thesis activates. Those levels — $360 for GOOGL, $207 for PLTR, and $84 for NFLX — are the exact figures Martinez cited. Until those closes are registered, all three remain in compression, not breakout.
Signal 1 — GOOGL: Symmetrical Triangle Apex, $360 Is the Trigger
Alphabet has been consolidating inside a symmetrical triangle since May, according to Martinez. The 4-hour chart shows converging trendlines — a descending upper resistance and an ascending lower support — narrowing toward an apex near current price ($353.42 per the chart label). Price compression of this type typically precedes a sharp directional move, but the direction is not predetermined by the pattern alone.
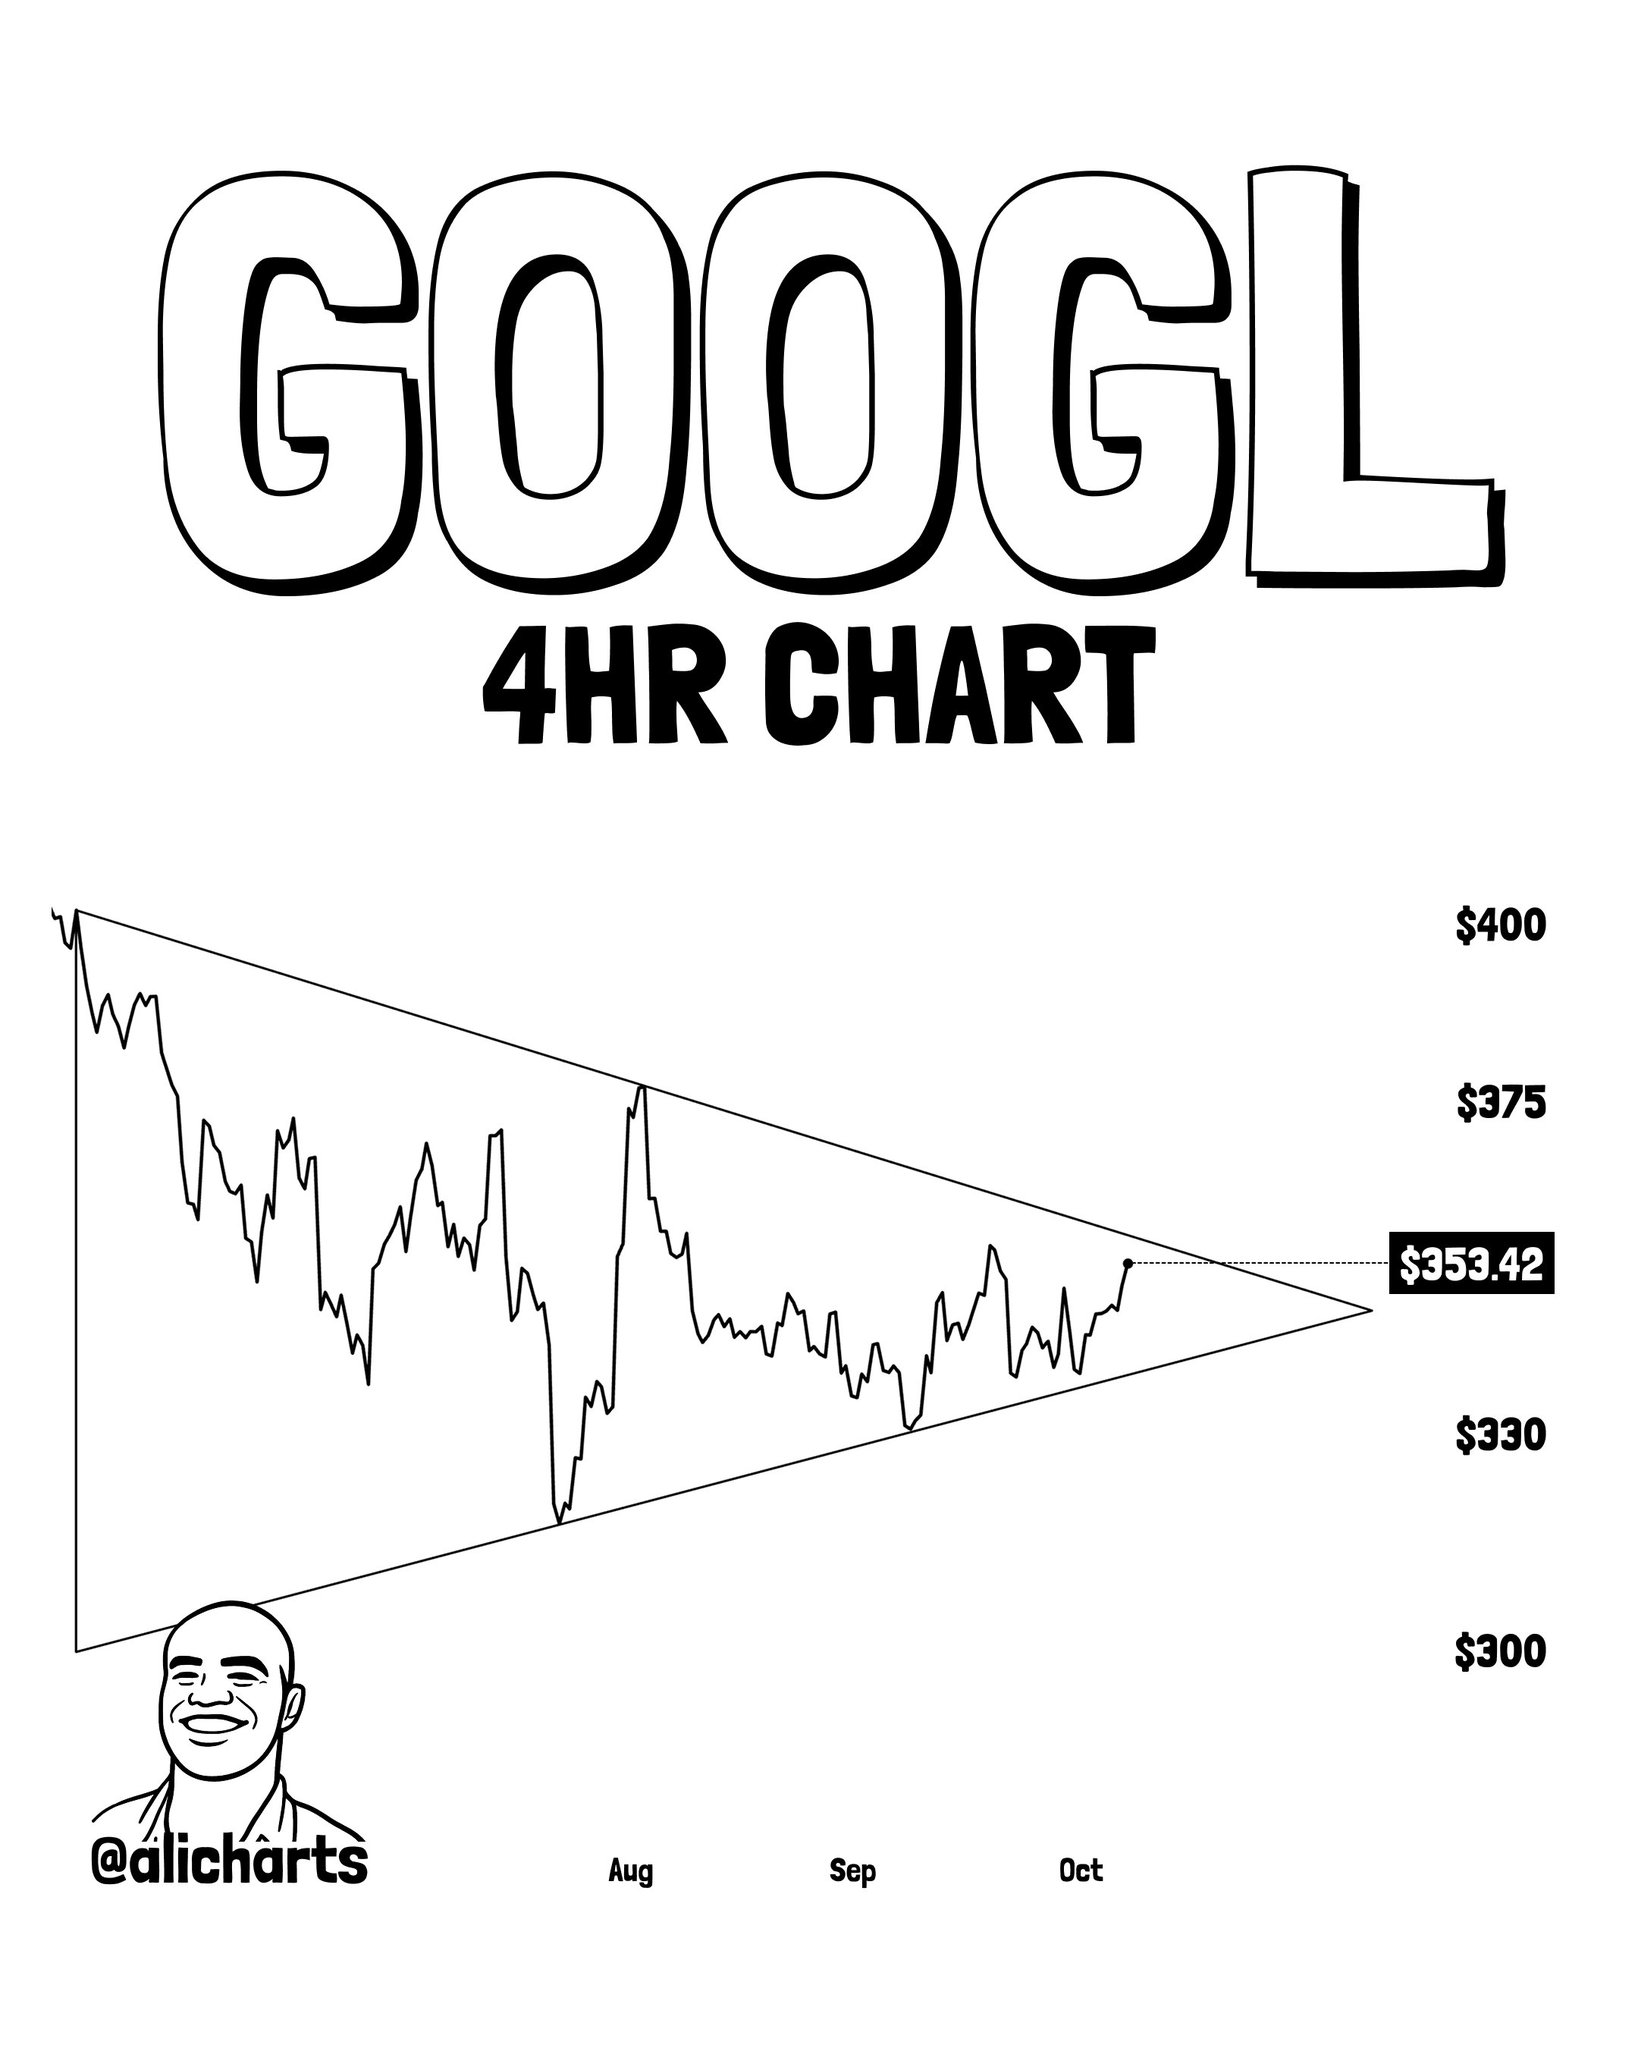
Martinez is watching for a close above $360 to confirm an upside breakout. That level does not appear as a printed label on the chart — it is the analyst’s stated trigger, cited explicitly in the tweet text. If that close registers, his stated target is $400, approximately 11% above the $360 breakout trigger. The chart’s printed axis runs to $400 at the upper boundary, consistent with that target. Without the close above $360, the triangle resolution remains unconfirmed — a downside break from the same formation would invalidate the bullish read entirely.
Signal 2 — PLTR: Year-Long Channel Ceiling at $207–$210
Palantir’s daily chart tells a different structural story. After a sharp rally from lower levels, PLTR has spent the better part of a year consolidating within a broad channel — lower highs and higher lows forming a defined range. The chart shows current price at $200.69, pressing against the upper boundary of that channel, which the chart prints at $210.
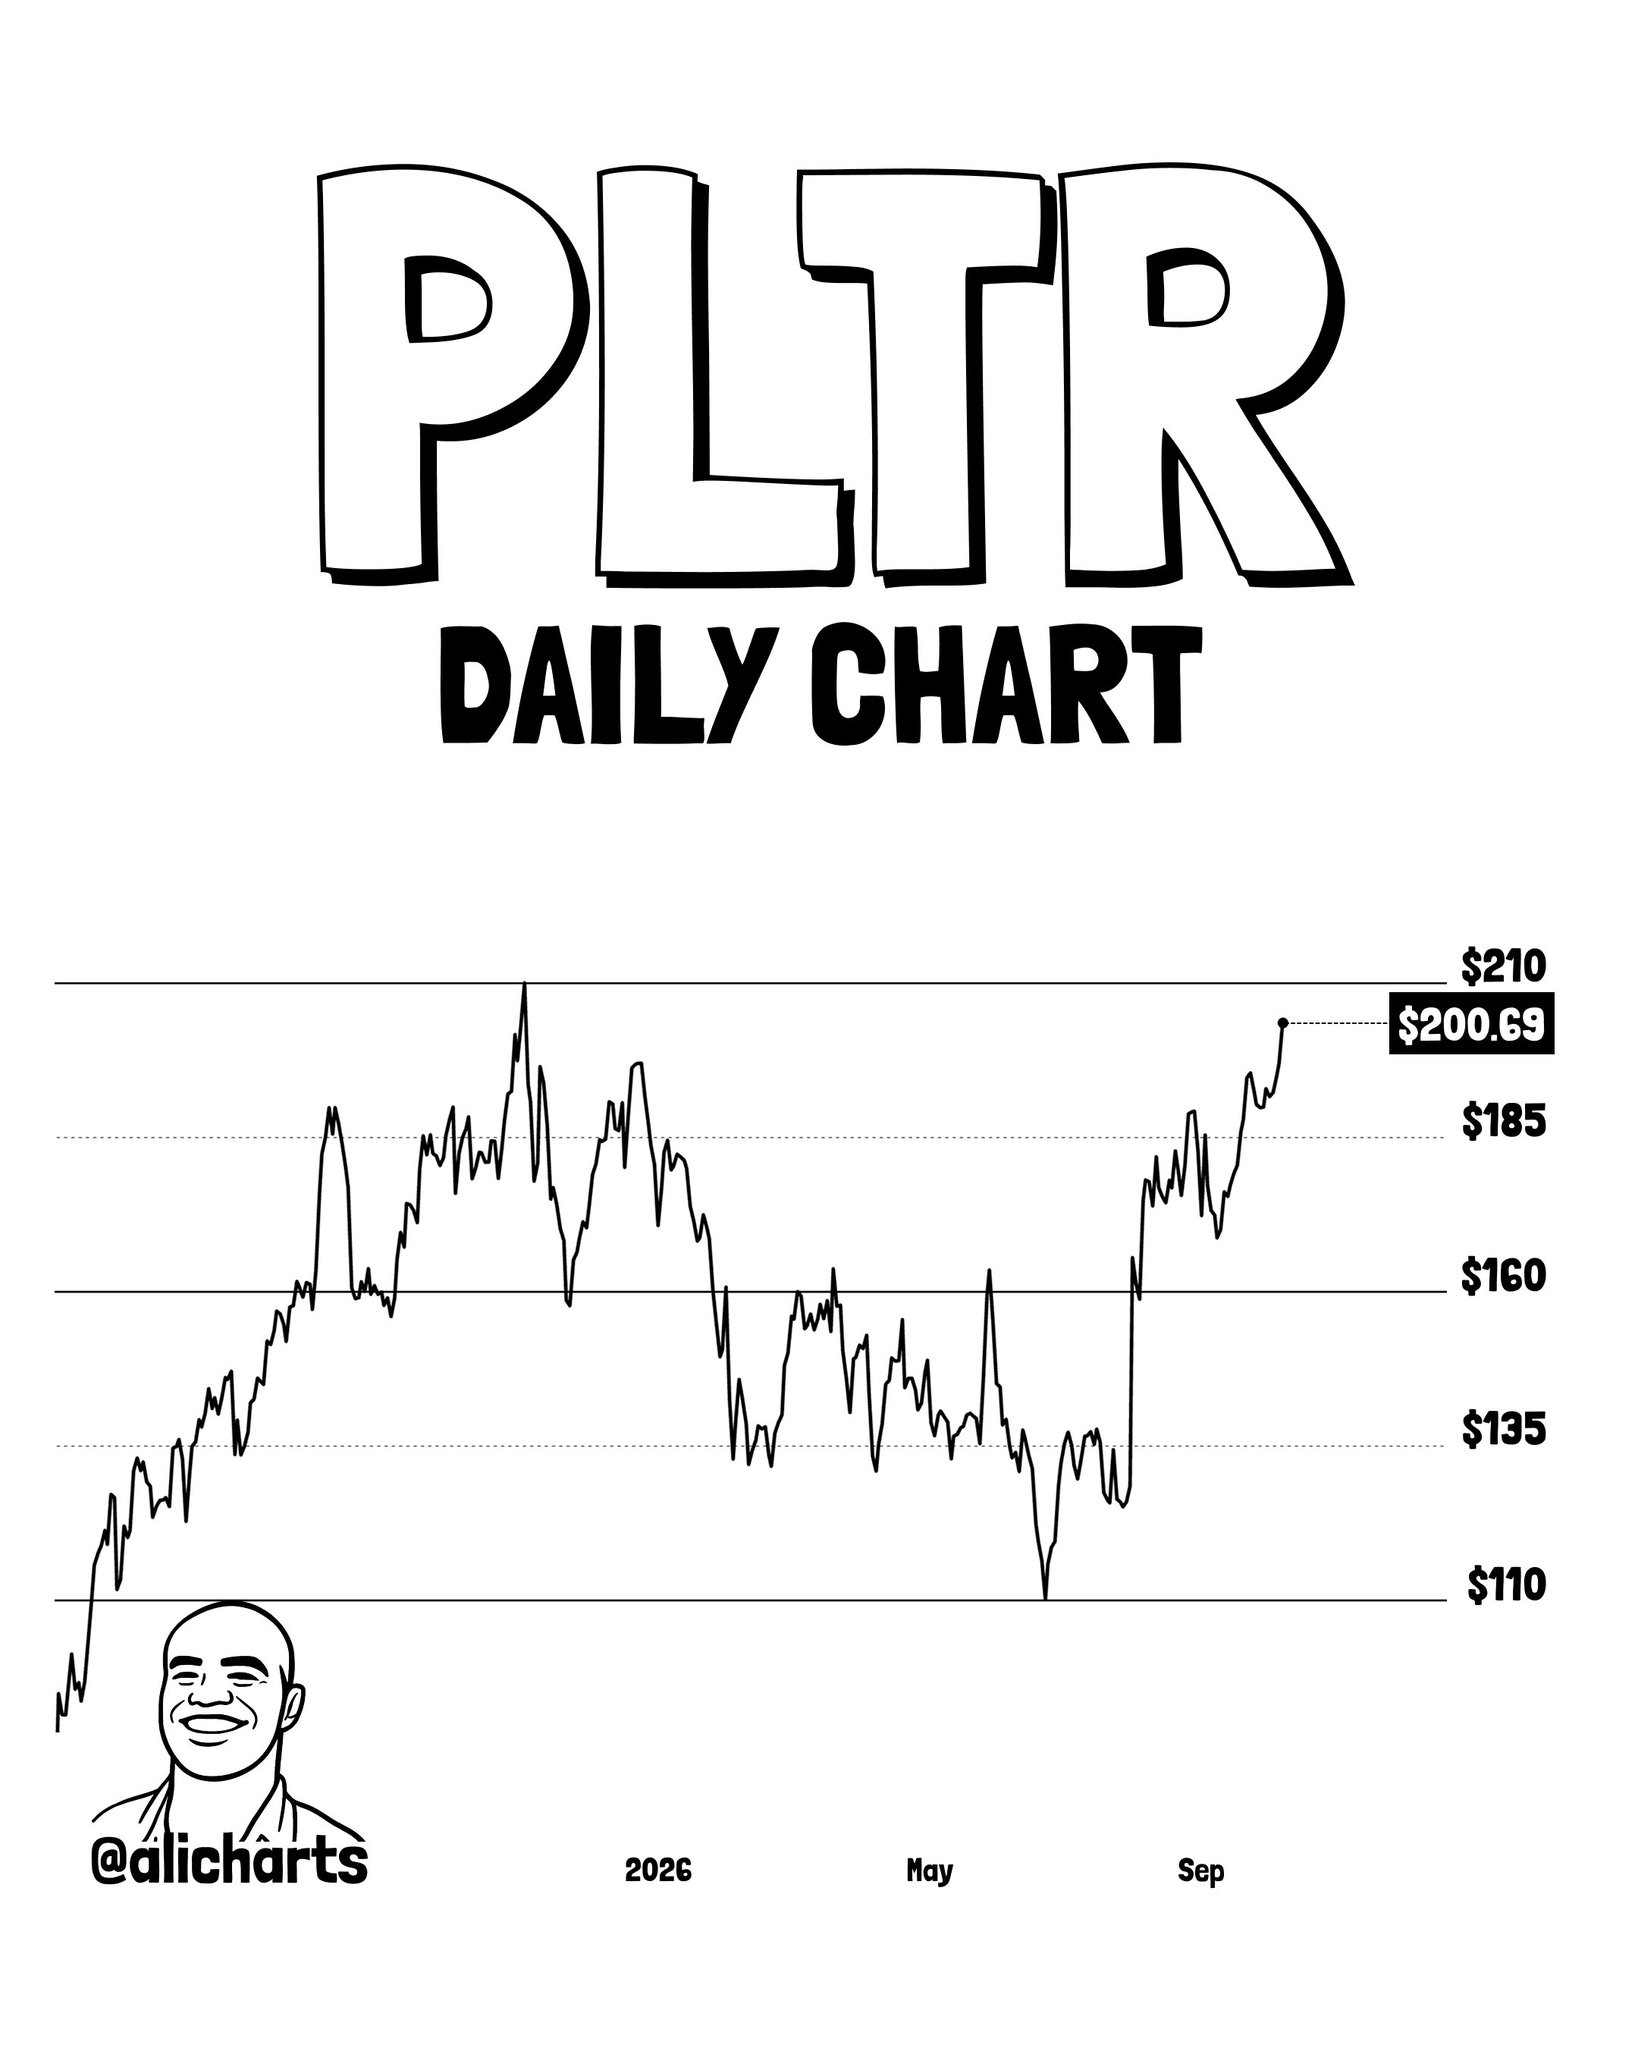
Martinez’s stated breakout trigger is a sustained close above $207 — a level that appears in the tweet text but is not printed on the chart image itself. A close above that level, he argues, could signal a breakout toward a new all-time high. The distinction between $207 (analyst’s trigger) and $210 (chart’s upper boundary label) is material: the analyst is defining the confirmation threshold below the chart ceiling, not at it. Compression within the channel has continued for roughly a year, and the current push toward the ceiling at $210 represents the most acute test of that resistance in that period. Traders following this setup are watching whether $200.69 can extend to a confirmed close above $207.
Signal 3 — NFLX: Double Bottom at $67, Target Zone at $83–$84
Netflix presents the most visually distinct pattern of the three. The 4-hour chart shows a W-shaped double bottom structure: a first low, a partial recovery through September, then a second sharp selloff in October back to the lower boundary near $67. Current price is $70.80 per the chart label, reflecting a bounce from that lower support zone.
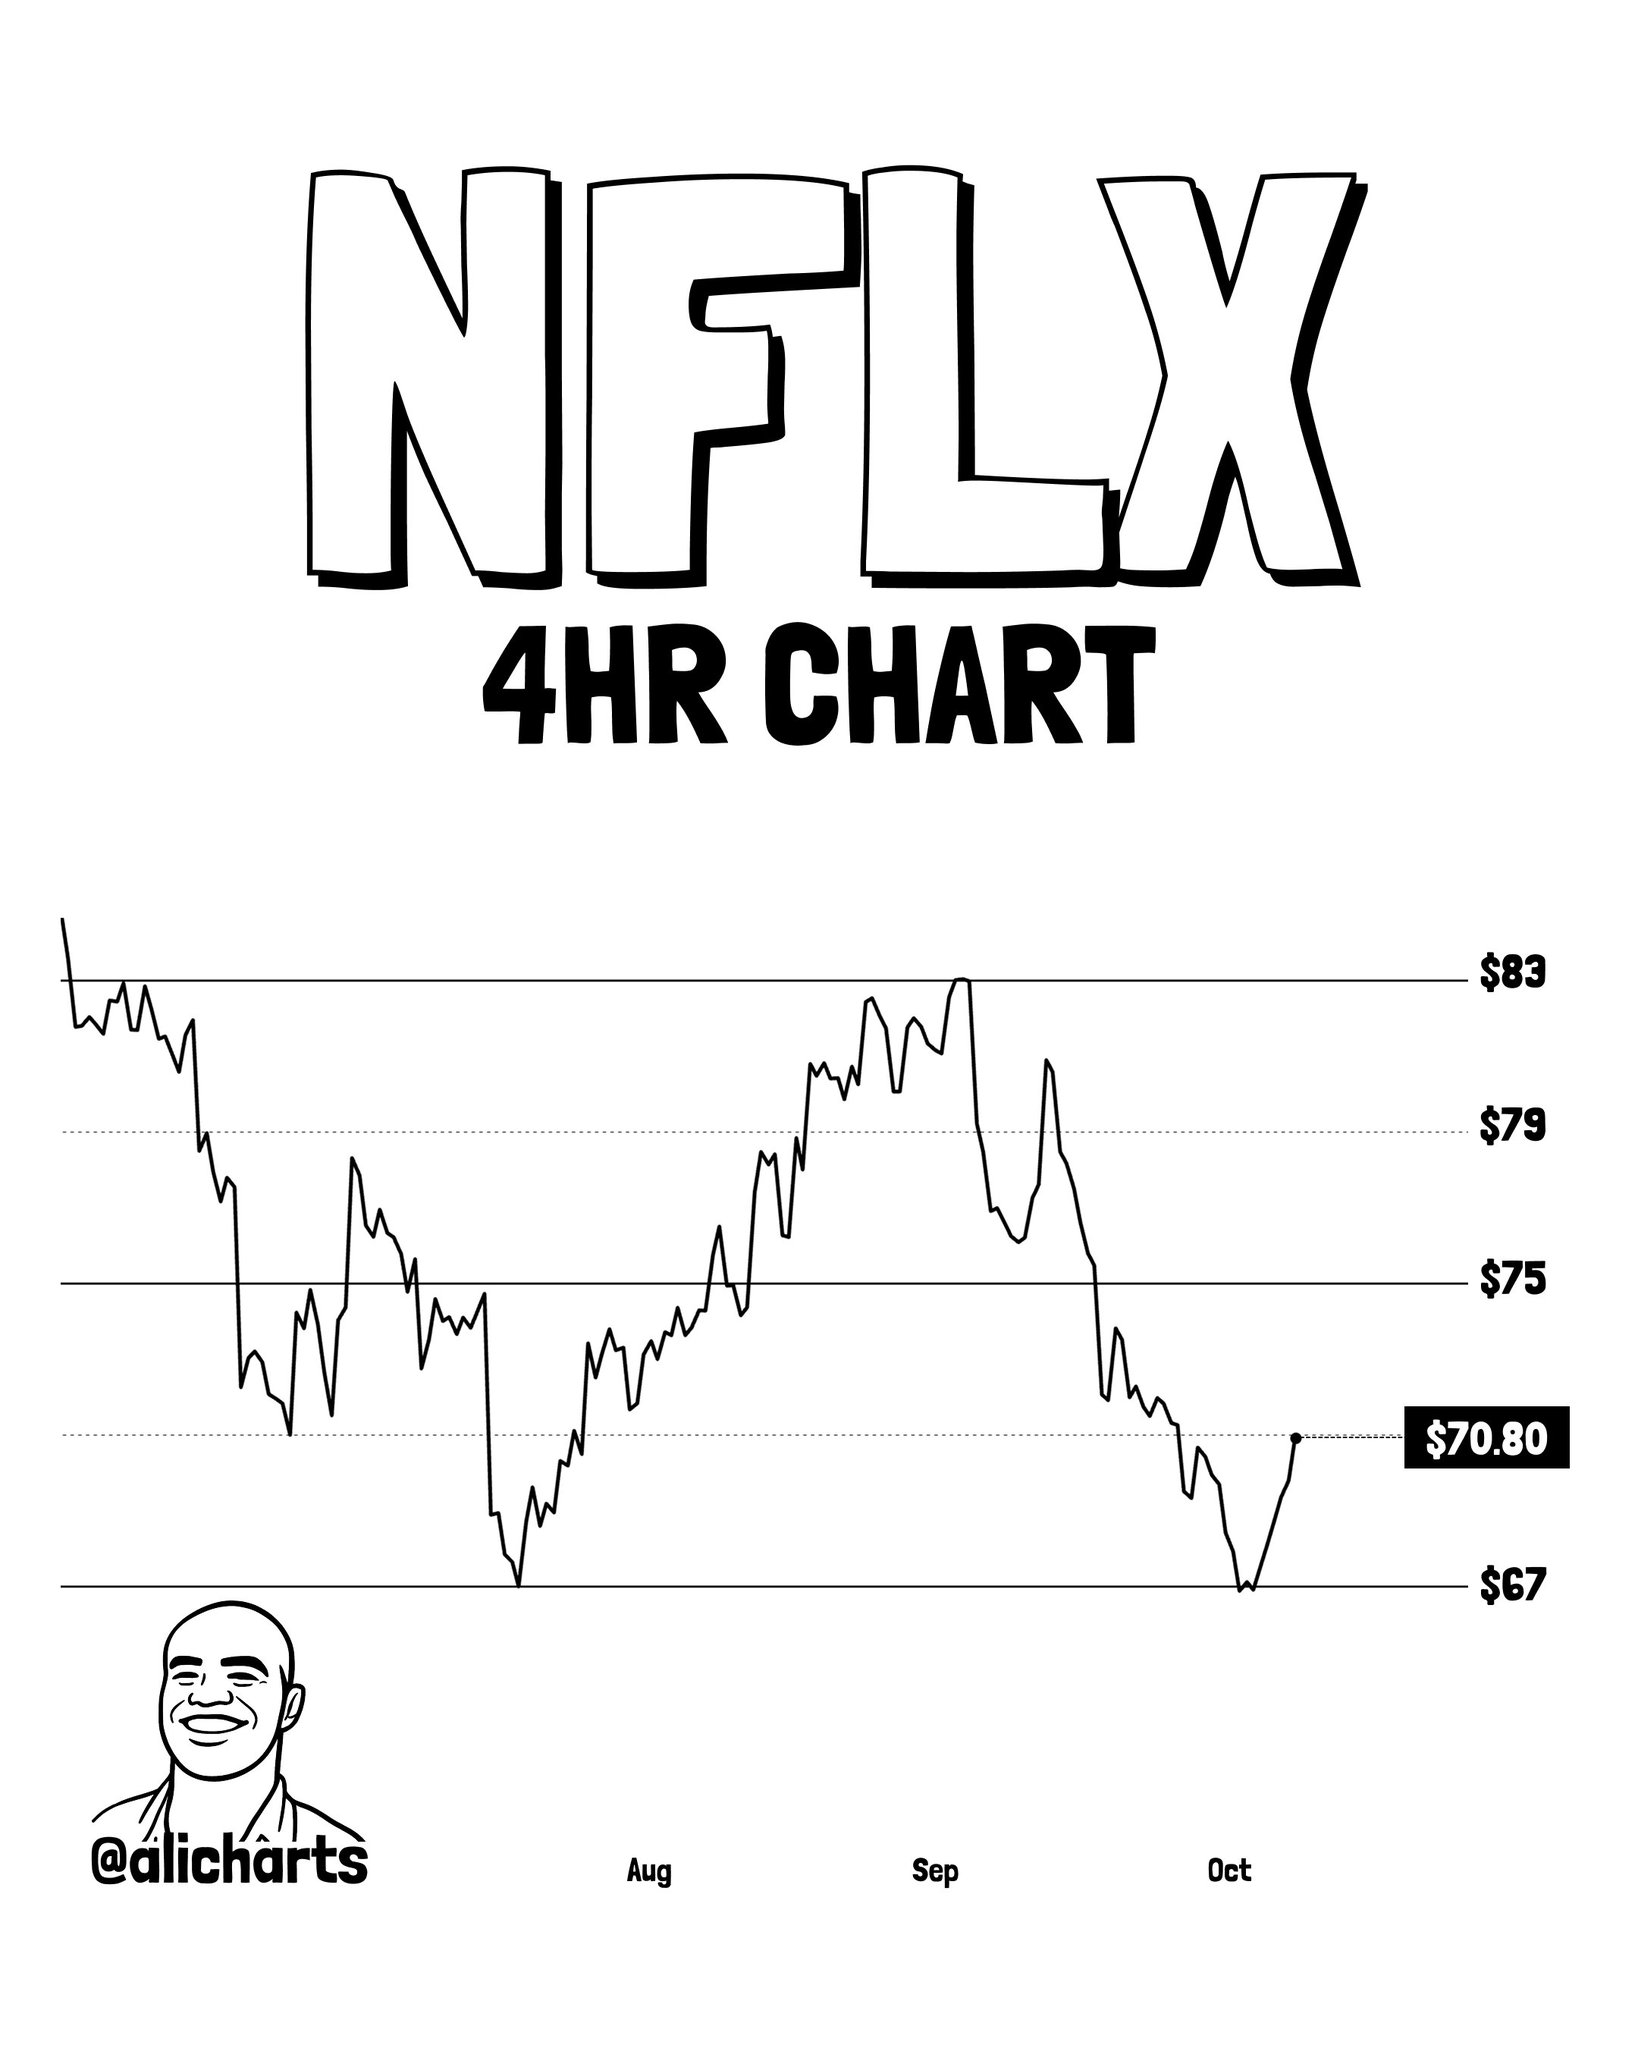
The channel boundaries are printed on the chart as $67 on the lower end and $83 on the upper end. Martinez’s tweet references $84 as the resistance zone to clear — slightly above the chart’s printed $83 upper boundary. As with the other setups, the analyst’s stated level ($84) and the chart’s printed label ($83) are close but distinct; both are reported here as labeled. A confirmed move through the $83–$84 resistance zone would complete the double bottom measured move from the $67 base. Failure to hold above $67 would negate the pattern entirely.
What the Three Setups Have in Common
Each of the three setups shares the same structural logic: prolonged compression followed by a specific close-above confirmation level that activates the thesis. None of the three are confirmed breakouts at the time Martinez posted the thread. GOOGL is at the triangle apex. PLTR is at the channel ceiling. NFLX has bounced from a double bottom low. In all three cases, the pattern is mature — but the confirmation close has not yet occurred.
For investors tracking broader market dynamics, these equity setups arrive alongside significant institutional flows in risk assets. Spot Bitcoin ETFs pulled $999M in a single day — the largest inflow since October 2025 — reflecting the same risk-appetite environment that is pushing equities toward technical decision points. Separately, SpaceX (SPCX) surged 15% despite a massive share unlock, another signal that growth-oriented equities are drawing active technical attention this week.
Bullish Scenario
GOOGL closes above $360 → target $400 (roughly 11% from trigger). PLTR sustains a close above $207 → breakout toward new all-time high above $210 channel ceiling. NFLX clears $83–$84 resistance zone → double bottom measured move confirmed from $67 base.
Bearish Scenario
GOOGL fails at $360 and breaks triangle support → downside resolution of the compression, pattern invalidated. PLTR rejects at $207–$210 and returns into the year-long channel → bullish thesis delayed. NFLX loses $67 support → double bottom negated, structure turns bearish.
All three setups are condition-based. Martinez’s framework is explicit: the close above the stated trigger is the thesis. Without it, these are compression patterns, not breakouts. GOOGL’s $360, PLTR’s $207, and NFLX’s $83–$84 are the exact levels to watch — and the sessions immediately ahead will determine which, if any, resolve to the upside.
Frequently Asked Questions
What does a symmetrical triangle apex mean for GOOGL’s next move?
Why is $207 and not $210 the PLTR breakout trigger?
What invalidates the NFLX double bottom setup?
Are these breakouts confirmed at the time of the analysis?
Source: Ali Charts · Published by CoinsProbe Markets Desk
The opinions and market insights shared on CoinsProbe represent the views of individual authors based on prevailing market conditions at the time of publication. Cryptocurrency investments carry significant risk and volatility. Readers are encouraged to conduct their own research and seek professional financial advice before making investment decisions. CoinsProbe and its contributors do not accept responsibility for financial losses or decisions made based on published content.
CoinsProbe may publish sponsored articles, affiliate links, or promotional collaborations. All sponsored material is clearly labeled to maintain transparency with our audience. Our editorial decisions remain fully independent, and advertising partnerships do not influence reviews, rankings, or published opinions.
Since 2023, CoinsProbe has delivered reliable insights on cryptocurrency, blockchain, and digital assets. Our content is created by experienced researchers and analysts who follow strict editorial standards focused on accuracy, transparency, and credibility. Every article is carefully reviewed and verified using trusted sources and current market data. We provide unbiased analysis and timely updates covering everything from emerging crypto projects to major industry developments.