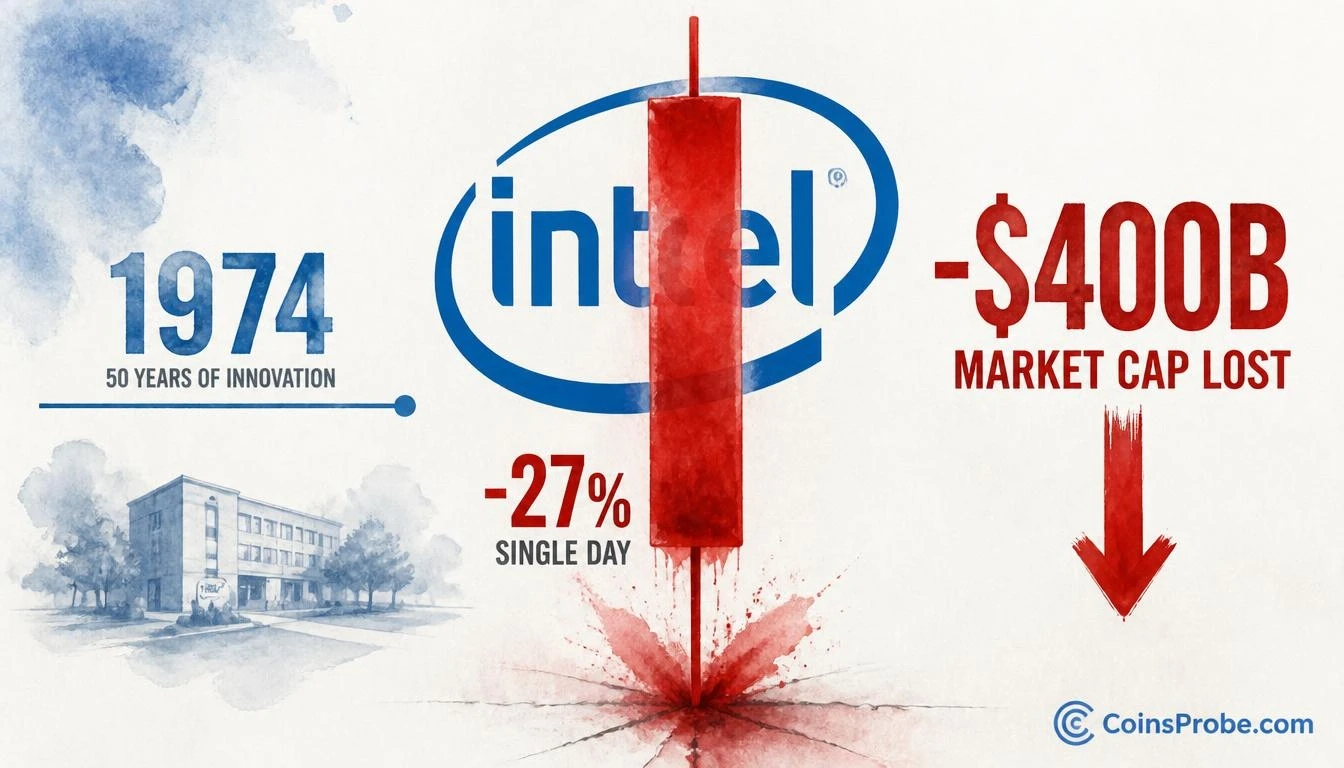

- Intel ($INTC) falls 27% intraday on October 30 — largest single-day loss since 1974 per @KobeissiLetter
- Stock is now down 53% from its June 30th record high after Thursday's collapse
- Single session erases $400 billion in Intel market capitalization
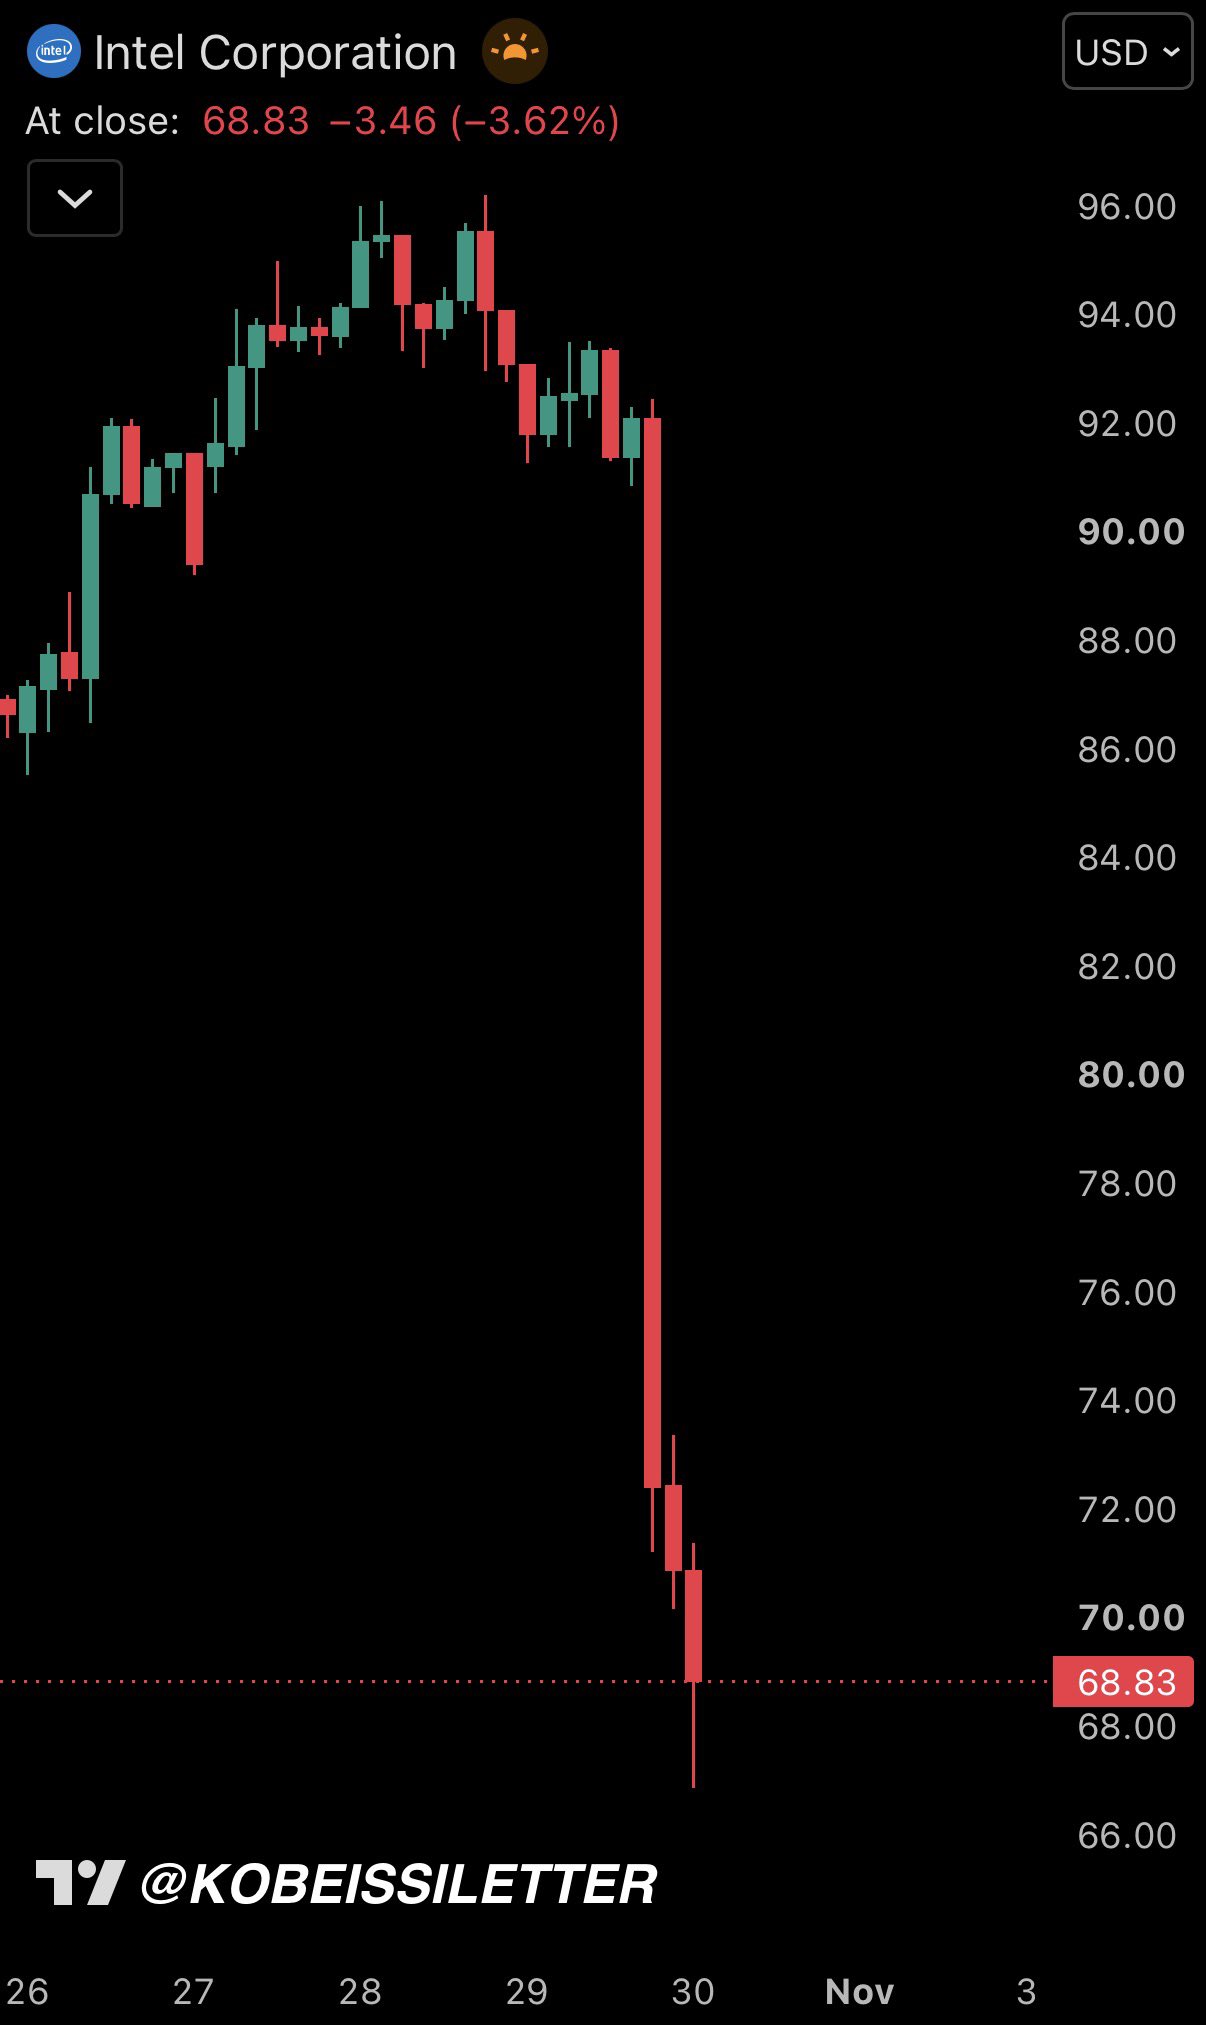
- INTC closes near $68.83 with no intraday recovery visible on the daily chart
Intel Corporation ($INTC) is in freefall. The stock extended intraday losses to -27% on October 30, putting it on course for its largest single-day percentage decline since 1974 — a 50-year record collapse, according to @KobeissiLetter.
The session’s damage is not isolated. The drop places INTC 53% below its June 30th record high, with the single-day selloff alone accounting for $400 billion in lost market capitalization — one of the largest single-session market cap destructions in U.S. equity history.
What Happened
The collapse arrived as a near-vertical drop on the daily chart — a single catastrophic red candle that cut through every prior support level without pause. The chart shows INTC trading in a gradual multi-day climb forming a rounded peak before October 30, followed by an immediate vertical breakdown. The stock closed near $68.83, the session’s dashed reference level, with no meaningful intraday recovery visible.
The scale of the one-day move places it in historically rare company. The last time Intel suffered a comparable single-session loss was over five decades ago — 1974 — a data point that underscores how structurally severe this repricing is, not merely a routine earnings miss.
The Numbers in Context
Three figures define the severity of Thursday’s session:
- -27% — single-session decline, worst since 1974
- -53% — total drawdown from the June 30th record high
- -$400 billion — market capitalization erased
For broader context, the correlation between equity stress events and crypto market behavior has become increasingly documented. As covered in Stocks and Bonds Are Moving Together Again — Nasdaq-10Y Correlation Hits +0.51, cross-asset risk-off moves have grown more synchronized in 2025–2026, meaning a shock of this magnitude in a major semiconductor stock warrants monitoring across asset classes.
What to Watch
The immediate question is whether any institutional support emerges at current levels. At $68.83, INTC has surrendered more than half its value from the year’s peak. No recovery attempt appeared on the intraday chart visible through the session. The next identifiable level on the daily structure is the zone below $66, which would mark fresh multi-year lows.
Any formal response from Intel’s management — guidance revision, buyback announcement, or restructuring update — would be the first circuit breaker worth tracking. Until then, the chart structure remains a confirmed breakdown with no visible technical floor established.
Source: x.comFrequently Asked Questions
When was the last time Intel stock fell this much in a single day?
How much market cap has Intel lost in 2024–2025 from its peak?
Where is Intel stock trading after the collapse?
Source: Kobeissiletter · Published by CoinsProbe Markets Desk
The opinions and market insights shared on CoinsProbe represent the views of individual authors based on prevailing market conditions at the time of publication. Cryptocurrency investments carry significant risk and volatility. Readers are encouraged to conduct their own research and seek professional financial advice before making investment decisions. CoinsProbe and its contributors do not accept responsibility for financial losses or decisions made based on published content.
CoinsProbe may publish sponsored articles, affiliate links, or promotional collaborations. All sponsored material is clearly labeled to maintain transparency with our audience. Our editorial decisions remain fully independent, and advertising partnerships do not influence reviews, rankings, or published opinions.
Since 2023, CoinsProbe has delivered reliable insights on cryptocurrency, blockchain, and digital assets. Our content is created by experienced researchers and analysts who follow strict editorial standards focused on accuracy, transparency, and credibility. Every article is carefully reviewed and verified using trusted sources and current market data. We provide unbiased analysis and timely updates covering everything from emerging crypto projects to major industry developments.