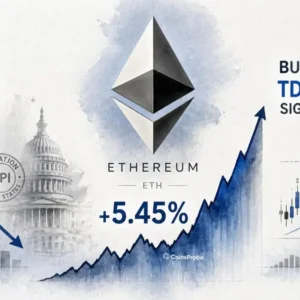

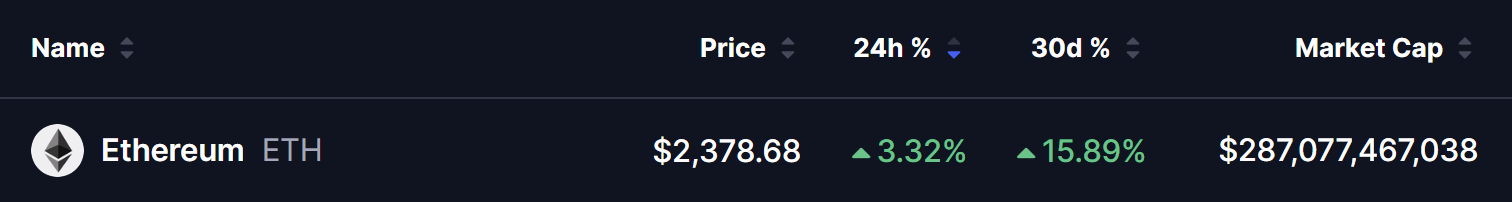
- Ethereum is trading at $2,378 — up +3.32% in 24 hours and +15.89% over 30 days — with a market cap near $287 billion.
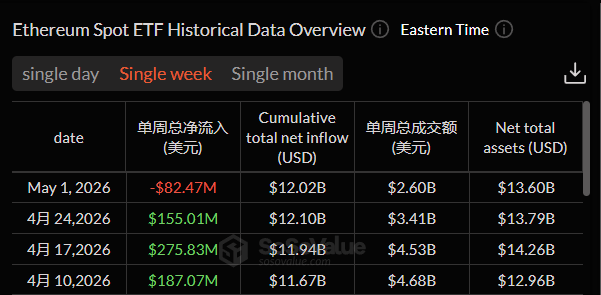
- U.S. spot Ethereum ETFs recorded a net outflow of $82.47 million in the week of April 28 – May 4 — the first weekly outflow in three weeks — but cumulative net inflows remain at $12.02 billion.
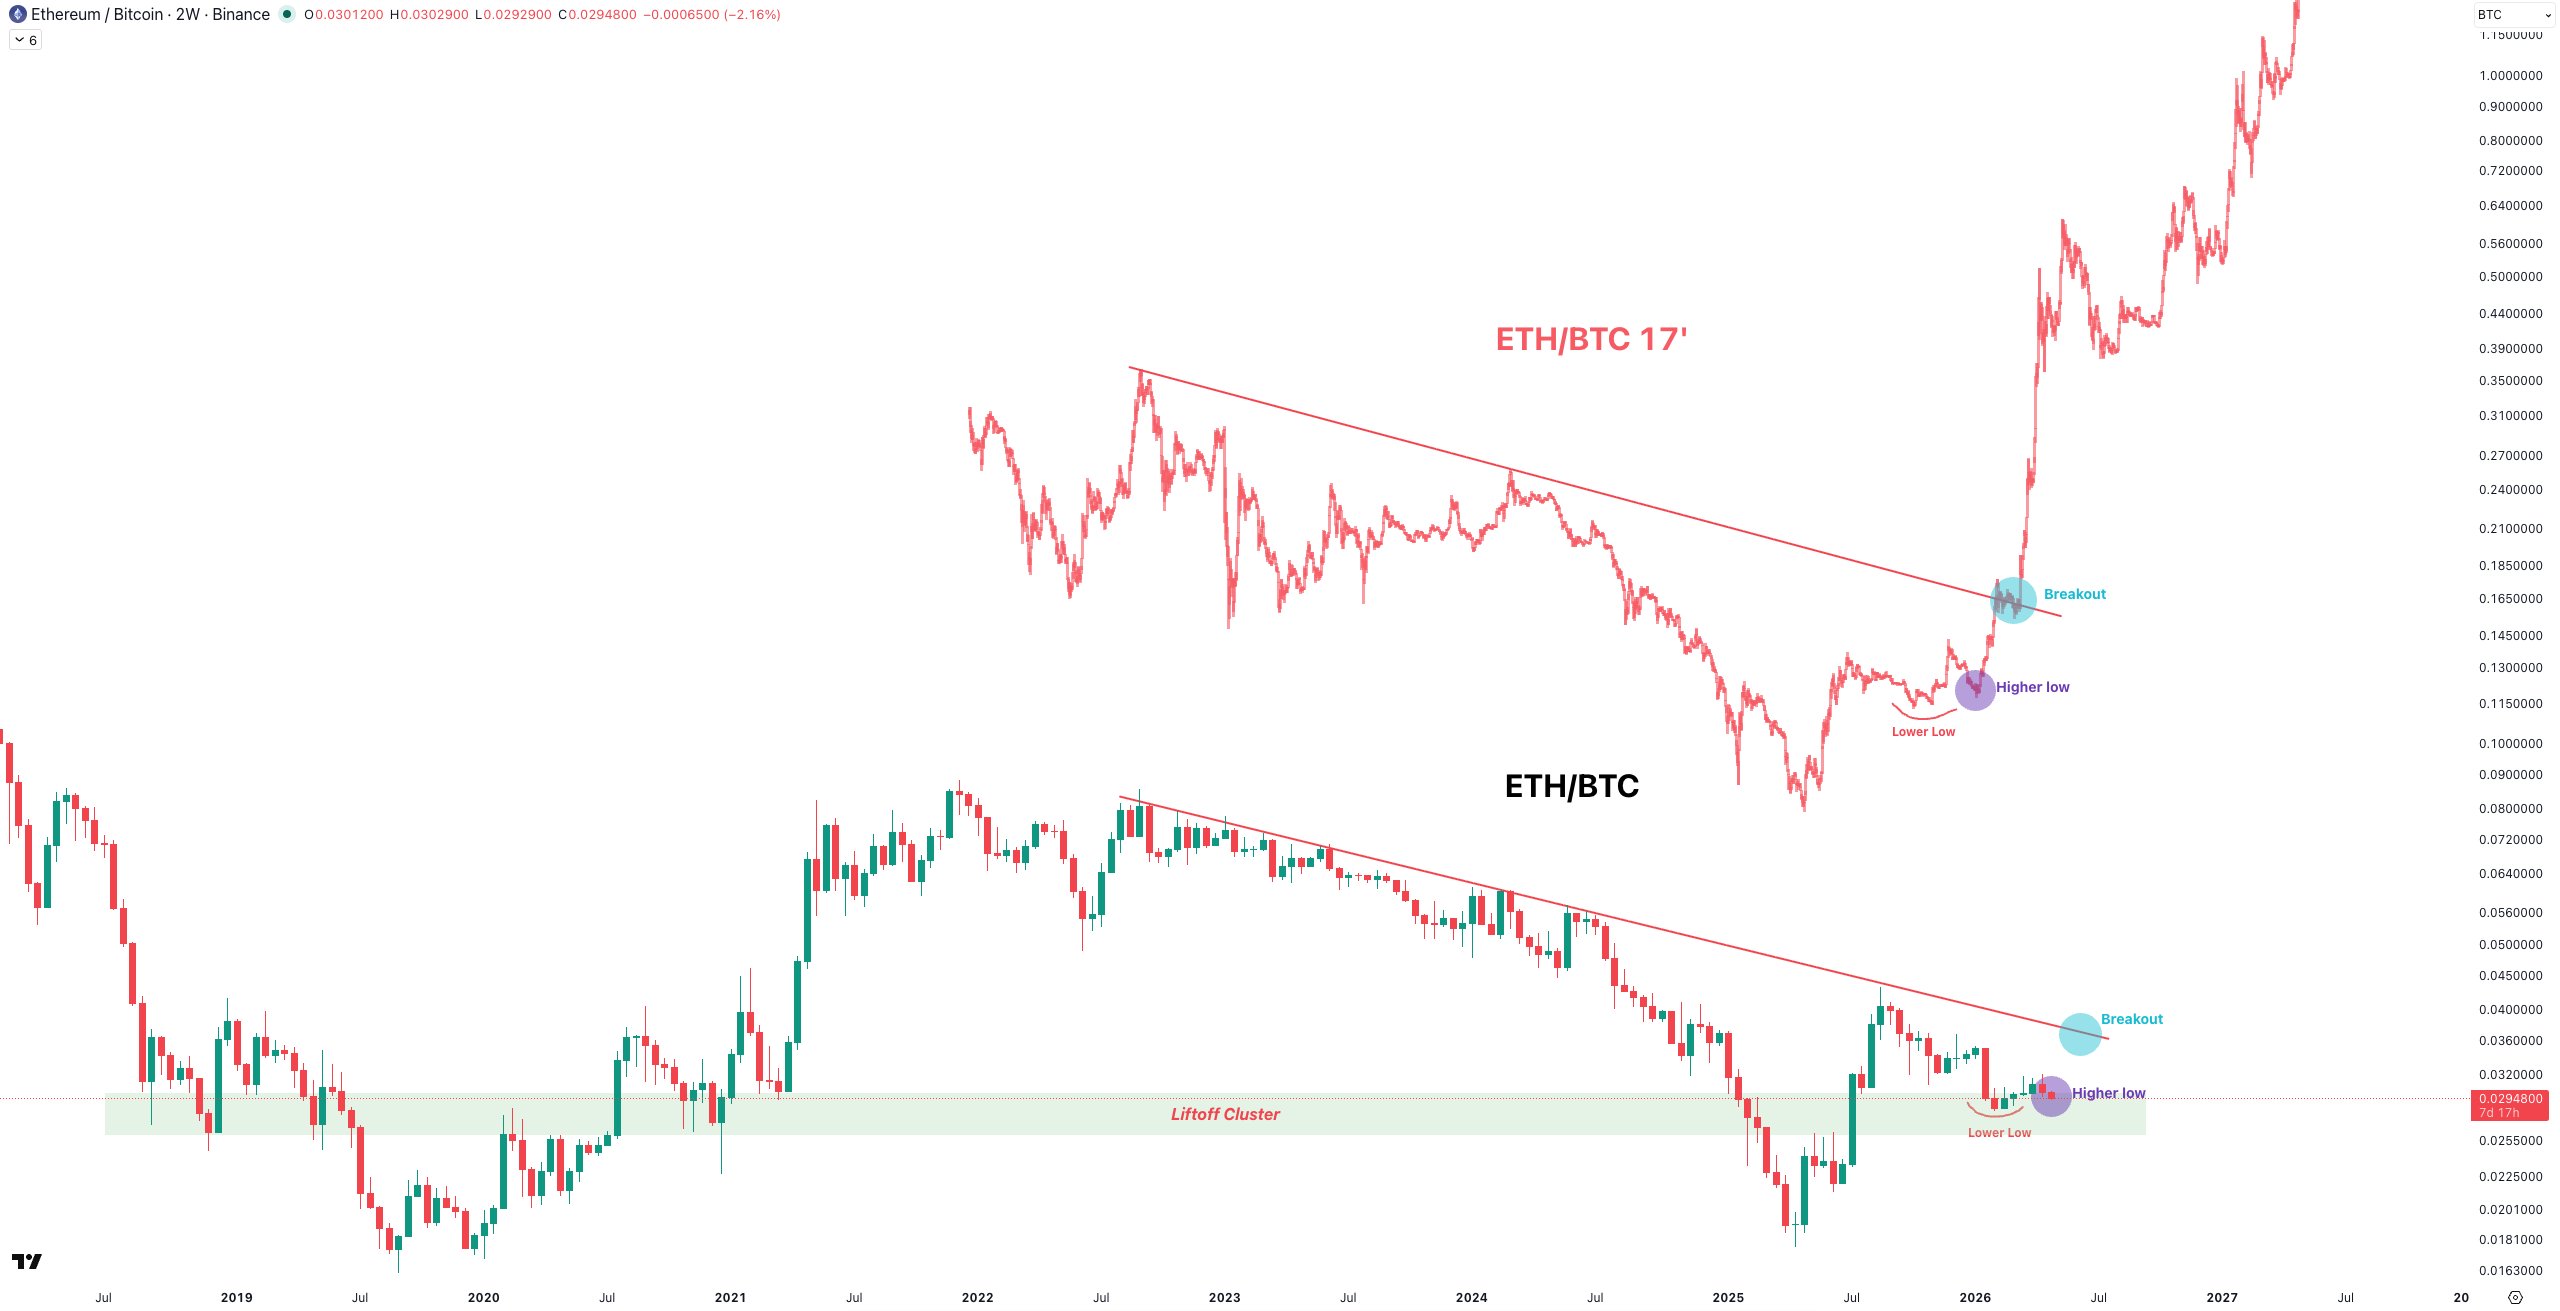
- A fractal identified by analyst @MaeliusCrypto shows ETH/BTC mirroring its 2017 breakout structure — a BARR pattern forming at multi-year downtrend resistance.
- A confirmed breakout above the ETH/BTC resistance trendline could trigger ETH outperformance against Bitcoin and potentially ignite the next major altcoin cycle.
Ethereum is currently trading at $2,378.68, gaining +3.32% in the past 24 hours and posting a solid +15.89% rise over the last 30 days. Its market capitalization now stands near $287 billion, reflecting steady strength despite recent volatility.
While a fresh wave of outflows from U.S. spot Ethereum ETFs has raised some concerns, a powerful technical setup on the ETH/BTC chart is drawing significant attention. Analysts suggest that Ethereum could be on the verge of a major breakout—one that closely resembles its explosive 2017 rally.
Ethereum ETF Outflows — Noise or Signal?
After enjoying consistent and significant inflows throughout April 2026, U.S. spot Ethereum ETFs recorded a net outflow of $82.47 million during the week of April 28 to May 4 — the first weekly outflow in three weeks and a development that caught some headlines as a bearish signal.
A closer look at the context tells a different story.
Cumulative net inflows into U.S. spot Ethereum ETFs still stand at $12.02 billion — with total assets under management at $13.60 billion. A single week of $82 million in outflows against a $12 billion cumulative inflow base represents less than 0.7% of total inflows — well within the range of normal institutional profit-taking and portfolio rebalancing activity following a strong run.
Crucially, Ethereum has held firmly above the $2,300 support level throughout this outflow period — a sign that underlying spot market demand is absorbing the ETF selling without disrupting the broader price structure. As we covered in our Ethereum whale accumulation and bullish fractal analysis, ETH has been showing consistent signs of large-wallet accumulation at key support levels — and the $2,300 hold during this outflow week is consistent with that pattern.
Market analysts widely interpret this week’s outflow as a typical short-term profit-taking phase following a strong April performance — not a trend reversal. The broader institutional conviction in Ethereum, reflected in $12 billion of cumulative inflows, remains intact.
The ETH/BTC Fractal — A 2017 Replay in Formation?
While the ETF outflow narrative was dominating headlines, analyst @MaeliusCrypto was drawing attention to something far more significant on the ETH/BTC chart — a fractal structure that closely mirrors Ethereum’s explosive 2017 breakout cycle.
The pattern follows a classic Bump and Run Reversal (BARR) structure — the same formation we identified on SUI’s daily chart — with three distinct phases playing out on the ETH/BTC pair:
Lead-In Phase — A long-term descending resistance trendline on the ETH/BTC chart that has capped Ethereum’s outperformance against Bitcoin across multiple cycles. This trendline represents the structural ceiling that ETH must break above to enter a new phase of Bitcoin-relative dominance.
Bump Phase — A period of gradual accumulation with higher lows forming beneath the resistance — building compressed energy within what @MaeliusCrypto identifies as a key “lift-off zone”. ETH/BTC is currently in this phase — testing the multi-year downtrend resistance from below while building a higher low structure that mirrors the 2017 pre-breakout consolidation.
Breakout Phase — In 2017, once ETH/BTC broke the equivalent resistance trendline, it retested the breakout level and then surged explosively — delivering one of the most dramatic asset outperformance periods in crypto history. The fractal suggests this sequence may be approaching its conclusion — and the breakout phase could be next.
As @MaeliusCrypto noted: “Ethereum’s outperformance could emerge suddenly, often catching the market off guard.” The current ETF outflow consolidation phase aligns precisely with the kind of quiet before the storm that preceded ETH’s historical breakouts.
Why the ETH/BTC Chart Matters More Than ETH/USD Right Now
For traders focused purely on ETH/USD, the $2,378 price tag and +15.89% monthly gain look solid but unremarkable. The more important signal is happening on the ETH/BTC pair — which measures Ethereum’s strength relative to Bitcoin rather than in dollar terms.
When ETH/BTC breaks out of its multi-year descending resistance, it does not just mean ETH goes up in dollar terms — it means ETH is outperforming Bitcoin. In prior cycles this has been the precursor to broad altcoin season — where capital rotates from Bitcoin into Ethereum first, and then cascades further down the altcoin market cap curve.
The 2017 template is the clearest historical precedent. When ETH/BTC broke its equivalent resistance in 2017:
- Ethereum began dramatically outperforming Bitcoin
- ETH rallied from under $10 to over $1,100 in months
- The broader altcoin market entered one of its most explosive periods ever
If the current fractal replicates that sequence — even partially — the implications extend well beyond Ethereum’s dollar price.
What’s Next for Ethereum?
Bullish Scenario
A confirmed breakout above the ETH/BTC descending resistance trendline would validate the fractal and signal the start of a new Ethereum outperformance cycle. In this scenario:
- ETH begins meaningfully outperforming BTC — with ETH/BTC ratio expanding for the first time in years
- Ethereum’s dollar price pushes toward and potentially beyond its prior all-time high
- Long-term fractal projections — in a full 2017-style replay — place targets well above $5,000
- The broader altcoin market ignites as capital rotates from BTC dominance into ETH and further down the market cap curve
The current ETF outflow consolidation, the $2,300 support hold, and the higher low structure on ETH/BTC all fit this scenario’s pre-breakout template precisely.
Bearish Scenario
If ETH/BTC fails to break the descending resistance and rolls over from the current test, the fractal is invalidated. In this case Ethereum could see renewed underperformance against Bitcoin — and the broader altcoin rotation thesis is delayed. The key invalidation level to watch is a daily close below the $2,300 support zone — which would suggest the higher low structure has broken and buyers are losing control of the setup.
The Bigger Picture — ETH as the Altcoin Cycle Catalyst
Ethereum’s role in the broader crypto market structure makes this fractal particularly significant. Every major altcoin season in crypto history has been preceded by ETH outperforming BTC — as Ethereum serves as the gateway asset through which institutional and retail capital flows into the broader altcoin ecosystem.
If the ETH/BTC breakout materialises, it would not just benefit Ethereum holders. It would likely signal the start of the next major altcoin cycle — where hundreds of tokens tied to Ethereum’s DeFi, NFT, and smart contract ecosystem begin their own sustained rallies. As we covered in our Bitcoin $80K reclaim and cycle bottom analysis, the broader crypto market is already showing strong signs that the 2026 bear market bottom is behind us — and an ETH/BTC breakout would be the confirmation signal that the full altcoin rotation has begun.
Bottom Line
The $82 million ETF outflow is a week of institutional profit-taking — not a trend reversal. The $12 billion in cumulative ETF inflows, the firm $2,300 support hold, and the 2017-style BARR fractal forming on ETH/BTC are all telling a different and more important story.
Ethereum is quietly approaching one of the most significant technical decision points in its recent history. If the ETH/BTC breakout arrives — as the fractal suggests it might — the move could be fast, powerful, and exactly the kind of development that catches the broader market off guard.
Watch ETH/BTC. That is the chart that will call the next major crypto move.
Frequently Asked Questions (FAQ)
Why did Ethereum ETFs see outflows this week?
U.S. spot Ethereum ETFs recorded a net outflow of $82.47 million in the week of April 28–May 4 — the first weekly outflow in three weeks. Analysts view this as normal short-term profit-taking following a strong April, not a trend reversal. Cumulative net inflows remain at $12.02 billion.
What is the ETH/BTC fractal that analysts are watching?
Analyst identified a BARR pattern on the ETH/BTC chart that closely mirrors Ethereum’s 2017 breakout cycle — featuring a long-term descending resistance trendline, a higher low accumulation phase, and a potential breakout that could trigger major ETH outperformance against Bitcoin.
What happened in Ethereum’s 2017 breakout?
When ETH/BTC broke its equivalent resistance trendline in 2017, Ethereum dramatically outperformed Bitcoin — rallying from under $10 to over $1,100 in months and igniting one of the broadest altcoin rallies in crypto history. The current fractal mirrors that pre-breakout structure.
What is Ethereum’s long-term price target if the fractal plays out?
In a full 2017-style replay, long-term fractal projections place Ethereum’s target well above $5,000 — with the exact level dependent on the speed and strength of the ETH/BTC breakout and broader market conditions.
The opinions and market insights shared on CoinsProbe represent the views of individual authors based on prevailing market conditions at the time of publication. Cryptocurrency investments carry significant risk and volatility. Readers are encouraged to conduct their own research and seek professional financial advice before making investment decisions. CoinsProbe and its contributors do not accept responsibility for financial losses or decisions made based on published content.
CoinsProbe may publish sponsored articles, affiliate links, or promotional collaborations. All sponsored material is clearly labeled to maintain transparency with our audience. Our editorial decisions remain fully independent, and advertising partnerships do not influence reviews, rankings, or published opinions.
Since 2023, CoinsProbe has delivered reliable insights on cryptocurrency, blockchain, and digital assets. Our content is created by experienced researchers and analysts who follow strict editorial standards focused on accuracy, transparency, and credibility. Every article is carefully reviewed and verified using trusted sources and current market data. We provide unbiased analysis and timely updates covering everything from emerging crypto projects to major industry developments.