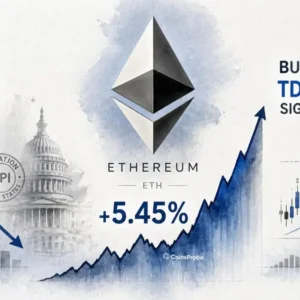

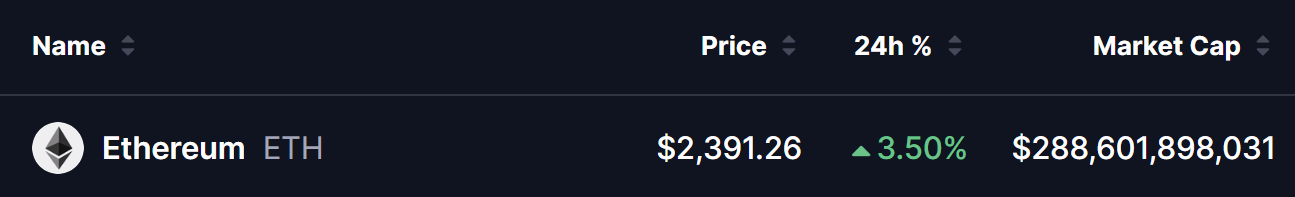
- Ethereum Price: Currently trading at $2,391 (up ~3.5% in 24 hours) with a market cap of $288.6 billion.
- Strong ETH Spot ETF Inflows: Consistent institutional buying continues, with $43.36M on April 21, $67.77M on April 20, and $127.49M on April 17 — pushing cumulative net inflows above $12 billion.
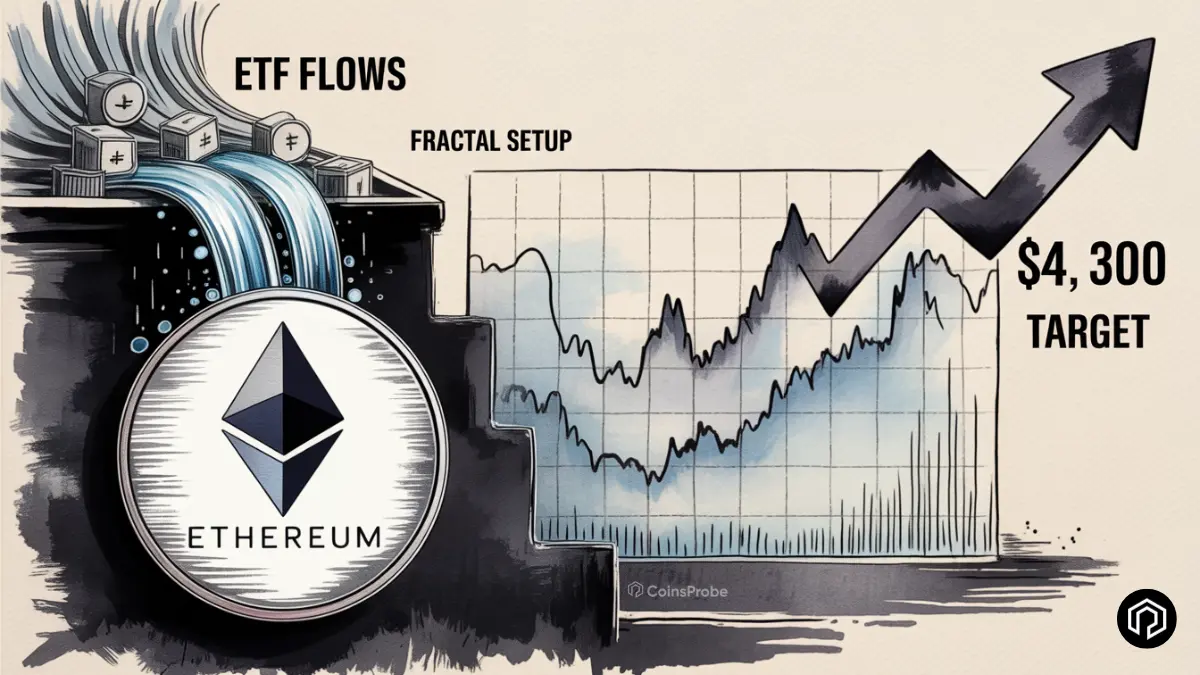
- Bullish Netflix Fractal: Long-term chart pattern shows ETH mirroring Netflix’s historic consolidation and breakout structure, with key time alignment pointing to June 29, 2026.
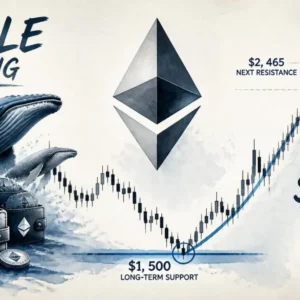
- Technical Levels: Strong support at $1,750 | Major resistance at $3,400 | Bullish target at $4,300.
Ethereum is currently trading at $2,391.26, up 3.50% in the last 24 hours. The asset’s market capitalization stands at approximately $288.6 billion. This modest daily gain comes amid broader market recovery, but the real momentum appears to be building beneath the surface through institutional capital flows and compelling technical patterns
ETH Spot ETF Inflow Streak
One of the most bullish developments for Ethereum this month has been the consistent net inflows into U.S. Spot Ethereum ETFs. Data from the latest historical overview shows a clear streak of positive flows, signaling sustained institutional accumulation even as retail sentiment remains cautious.
Key daily highlights (Eastern Time):
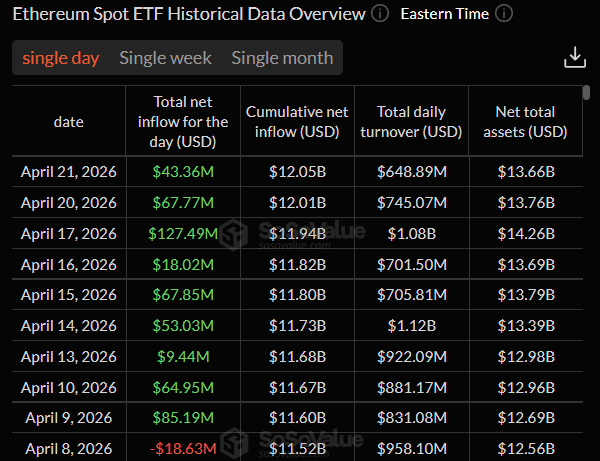
Out of the recent sessions shown, only one day (April 8) posted a minor outflow of $18.63 million, while the rest reflect strong buying pressure. Total net assets under management have climbed above $13.6 billion, with daily turnover remaining healthy in the $600–$1.1 billion range.
This multi-day inflow streak — now stretching over a full week in recent reports — marks one of the strongest periods of institutional demand for ETH ETFs in 2026. Analysts view it as “quiet accumulation” by professional investors, providing a solid fundamental tailwind that could support further price appreciation.
Fractal Hints Bullish Continuation
Technical analysts are buzzing about a striking long-term fractal comparison between Ethereum and Netflix (NFLX). Shared widely on X by chartist @Crypto_Moe84 on April 21, 2026, the overlay shows ETH mirroring Netflix’s multi-year consolidation and breakout structure with remarkable time symmetry.
The Netflix chart (2004–2009 timeframe) shows a prolonged base-building phase followed by a decisive upside breakout. The ETH chart (2021–2026) displays an almost identical pattern:
- Similar duration of the consolidation range (pink shaded area).
- Time alignment: Key fractal markers land around 1,729 days and 1,876 days, with the latter projecting to ~June 29, 2026.
- Structural symmetry: Both assets respected comparable support/resistance zones before the historical breakout.
Key Technical Levels to Watch:
- Support: $1,750 (lower boundary of the current fractal base)
- Resistance: $3,400 (major overhead level from the 2024–2025 highs)
- Bullish Target: $4,300 (measured move projection if the fractal completes successfully)
Bottom Line
With Ethereum holding firmly above key support and institutional money flowing steadily into Spot ETFs, the stage appears set for a potential breakout. If the Netflix fractal plays out as mapped, a move toward the $3,400 resistance — and ultimately the $4,300 zone — could materialize by late Q2 or early Q3 2026.
Traders and investors should monitor ETF flow data daily and watch for a clean break above $3,400 on strong volume as confirmation of the bullish continuation. As always, combine technical fractals with on-chain metrics and broader macro conditions for the highest-probability setup.
Frequently Asked Questions (FAQ)
How much have Ethereum Spot ETFs attracted in inflows recently?
ETH Spot ETFs have seen strong consistent inflows, including $43.36 million on April 21 and $67.77 million on April 20, 2026. Cumulative net inflows have now crossed $12 billion.
What is the Netflix fractal for Ethereum?
It is a long-term technical pattern comparing Ethereum’s price action (2021–2026) with Netflix’s multi-year consolidation and breakout phase (2004–2009). The time and structure alignment is remarkably similar, suggesting potential bullish continuation.
What are the key support and resistance levels for ETH?
Support: $1,750 (lower boundary of the fractal base)
Resistance: $3,400 (major overhead level)
Bullish Target: $4,300 (measured move if the fractal completes)
Is the Netflix fractal a guaranteed signal?
No pattern guarantees future results. However, the combination of strong ETF inflows, structural similarity, and time alignment makes this a compelling bullish setup that many analysts are watching closely.
The opinions and market insights shared on CoinsProbe represent the views of individual authors based on prevailing market conditions at the time of publication. Cryptocurrency investments carry significant risk and volatility. Readers are encouraged to conduct their own research and seek professional financial advice before making investment decisions. CoinsProbe and its contributors do not accept responsibility for financial losses or decisions made based on published content.
CoinsProbe may publish sponsored articles, affiliate links, or promotional collaborations. All sponsored material is clearly labeled to maintain transparency with our audience. Our editorial decisions remain fully independent, and advertising partnerships do not influence reviews, rankings, or published opinions.
Since 2023, CoinsProbe has delivered reliable insights on cryptocurrency, blockchain, and digital assets. Our content is created by experienced researchers and analysts who follow strict editorial standards focused on accuracy, transparency, and credibility. Every article is carefully reviewed and verified using trusted sources and current market data. We provide unbiased analysis and timely updates covering everything from emerging crypto projects to major industry developments.