
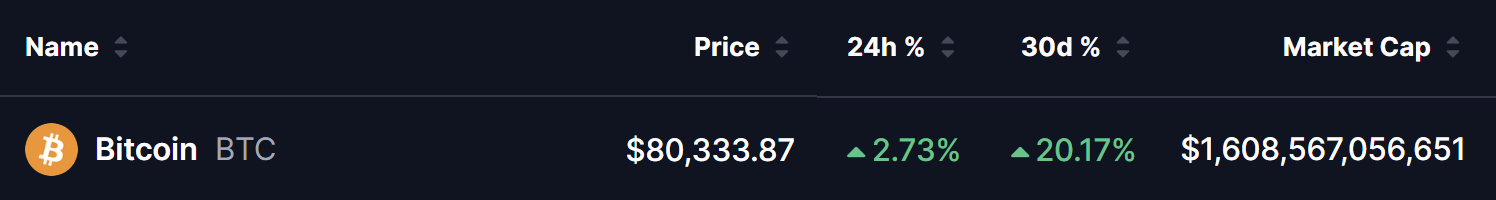
- Bitcoin has decisively reclaimed $80,000 — surging to a 3-month high of $80,333 with a +2.73% daily gain and a strong +20.17% over 30 days.
- BTC recently defended its multi-year ascending trendline near $65,000 — the same line that preceded gains of +968%, +259%, +1,126%, and +660% in prior cycles.
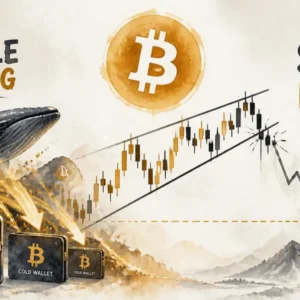
- A structural parallel between Bitcoin's current setup and Gold's rising wedge breakout is adding further weight to the bullish case.
- A sustained move above $80,000 opens the path toward the next major resistance at $90,600 — while a retest of $74K–$76K remains the key support zone to hold.
Bitcoin has done what many feared it could not — it has reclaimed $80,000 and printed a fresh 3-month high. As of May 4, 2026, BTC is trading at $80,333 — up +2.73% in the last 24 hours and a remarkable +20.17% over the past 30 days — with a market capitalisation now exceeding $1.608 trillion. After months of sustained selling pressure, repeated rejections at $80K in late February, and a bruising correction toward the $60,000–$65,000 zone, Bitcoin is back above the level that has defined the entire recovery narrative of 2026.
The question the entire market is now asking is the same one every bull run begins with: is the bottom truly in?
Multiple converging signals — technical, structural, and institutional — are now pointing in the same direction. And the weight of evidence is becoming increasingly difficult to argue against.
The Recovery in Context — How We Got Here
To understand why today’s $80K reclaim matters, it helps to remember where Bitcoin has been.
After reaching its all-time high of $126,213 in September 2025, BTC entered a prolonged and painful correction — shedding 38% of its value and grinding down to a February 2026 cycle low near $60,061. During that correction, $80,000 became a recurring wall — a level Bitcoin tested and failed to hold multiple times in late February before the correction accelerated toward the lows.
The recovery from that $60K low to today’s $80,333 represents a move of approximately +30% — and critically, this time Bitcoin has not just tagged $80K and retreated. It has reclaimed it cleanly and is trading above it with conviction. As we detailed in our Bitcoin May 2026 channel breakout analysis, the confirmed breakout from the multi-month descending channel was the first major technical signal that the corrective phase was ending — and today’s $80K reclaim is the follow-through confirmation bulls needed.
Signal 1 — Bitcoin’s Historic Ascending Trendline Defense
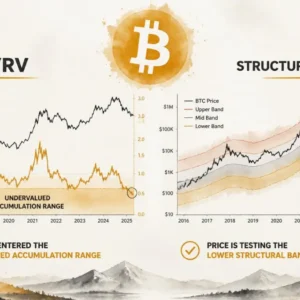
The first and most significant signal comes from what analyst @alicharts describes as “perhaps the most respected technical line in Bitcoin’s history” — the multi-year ascending trendline that has defined BTC’s macro structure across every major cycle.
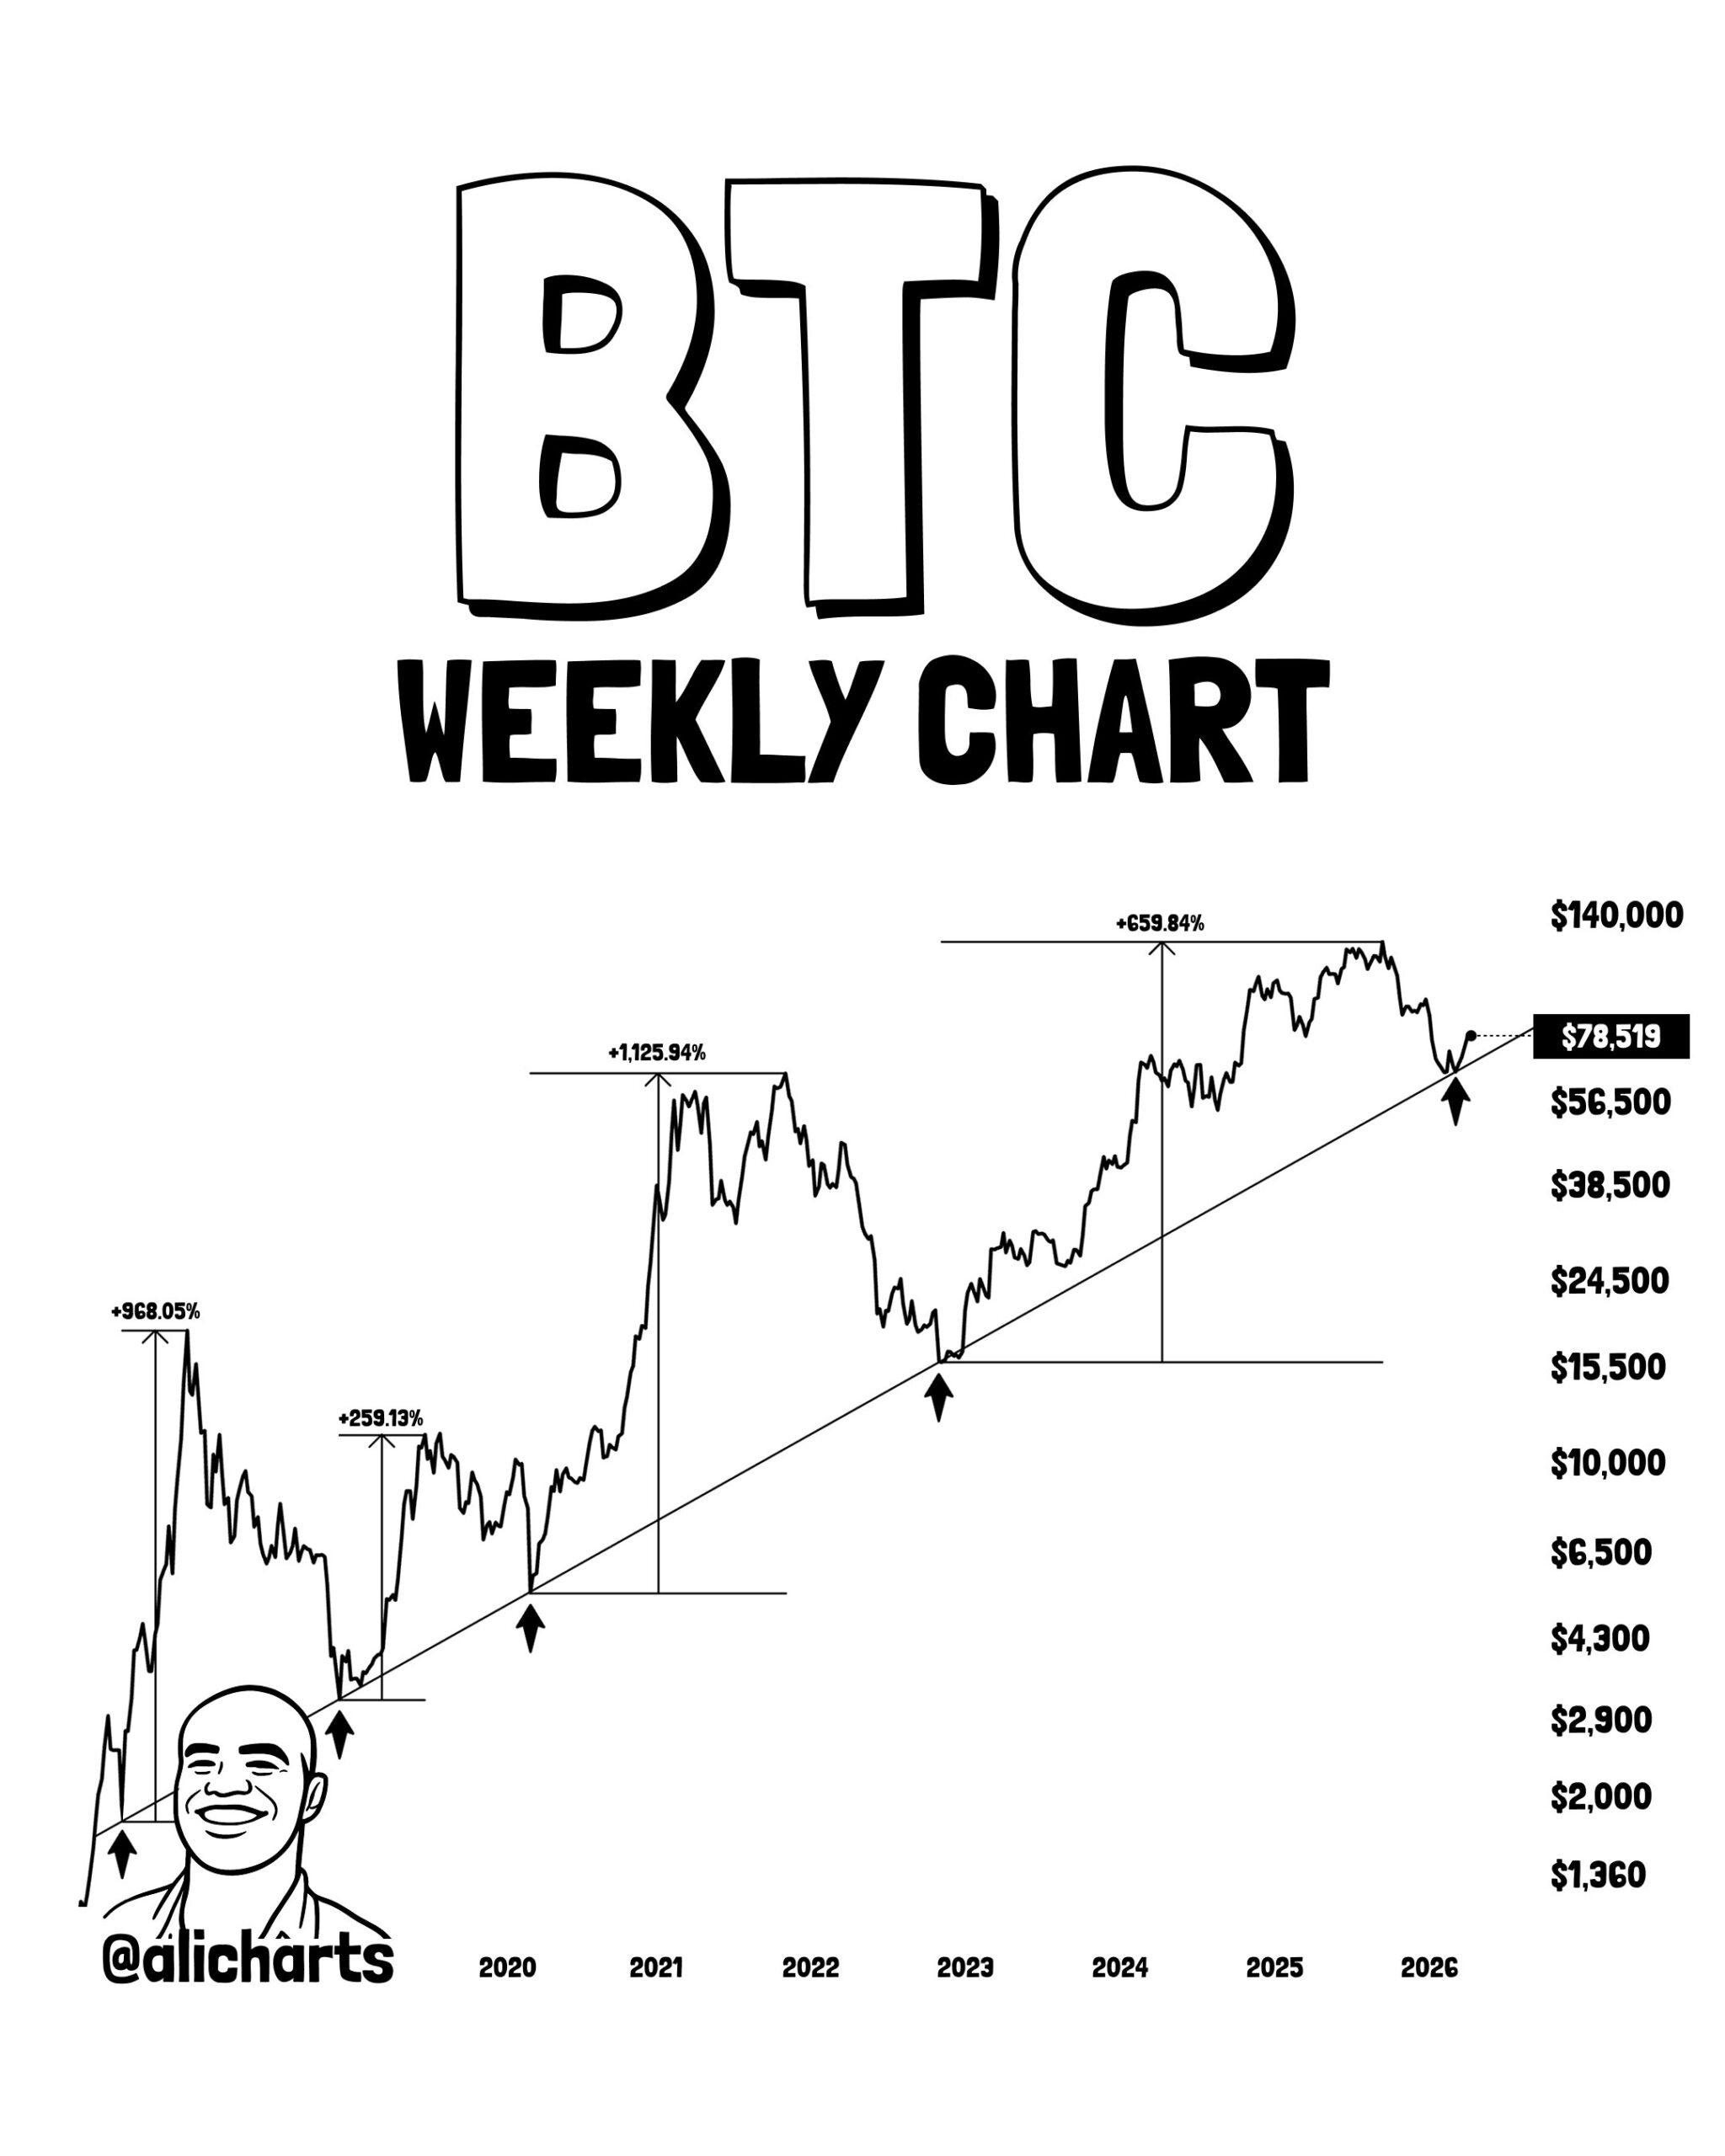
Bitcoin recently tested this trendline near the $65,000 zone — and held. The defense of this line is not just technically significant — it is historically extraordinary. Every previous time Bitcoin has touched and defended this trendline, it has preceded one of the most powerful rallies in crypto history:
| Cycle | Trendline Touch | Subsequent Rally |
|---|---|---|
| 2017 | Trendline defense | +968% |
| 2018 | Trendline defense | +259% |
| 2020 | Trendline defense | +1,126% |
| 2022 | Trendline defense | +660% |
| 2026 | Defense near $65K | TBD — +30% so far |
@alicharts noted directly: “Has Bitcoin bottomed? Well, this is perhaps the most respected technical line in Bitcoin’s history… With Bitcoin recently dipping to $65,000, it has held above this trendline again, suggesting the bottom could be in.”
Signal 2 — The Gold Rising Wedge Parallel
The second major signal comes from an unexpected direction — gold. Analyst @noBScrypto shared a compelling chart overlay comparing Bitcoin’s current price structure with gold’s multi-year rising wedge pattern — and the structural similarity is striking.
Gold’s setup followed a clear sequence:
- Extended uptrend inside a rising wedge structure
- Pullback to test the lower trendline of the wedge
- Firm defense of the lower boundary
- Powerful breakout higher once support held
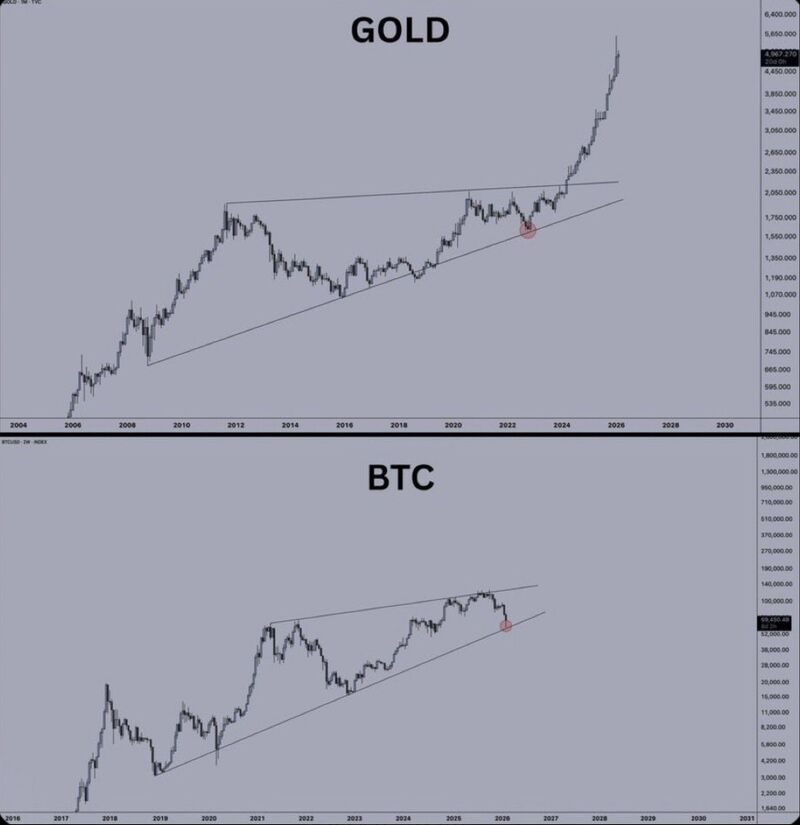
Bitcoin has now mirrored this sequence almost exactly:
- Uptrend from 2023 lows through the $126K ATH — the rising wedge upper boundary
- Pullback to the lower wedge boundary near the $60K February low
- Defense of the lower trendline — holding the multi-year ascending support
- Breakout — the current $80K reclaim replicating gold’s post-support breakout momentum
The gold parallel is not just a chart overlay curiosity. Gold’s breakout following its wedge defense was sustained and powerful — driven by the same combination of macro uncertainty, institutional demand, and technical compression that is now present in Bitcoin’s setup heading into May 2026.
What’s Next for Bitcoin?
With $80,000 now reclaimed and the weight of technical and institutional evidence pointing bullish, two clear scenarios define the path forward:
Bullish Scenario
If Bitcoin sustains its position above $80,000 on a daily closing basis and buying pressure continues to build, the next major resistance target is $90,600 — a level that would represent a further +13% move from current prices and bring BTC meaningfully closer to the $100K+ range that dominated market discussion in late 2025.
Beyond $90,600, the longer-term targets identified in our BTC and USDT.D fractal analysis remain in play — with USDT Dominance declining from its 9.0% peak acting as the macro tailwind that could eventually power a full recovery toward the $126,213 all-time high if the fractal plays out as the 2019 template suggests.
Bearish Scenario
If Bitcoin fails to hold above $80,000 and selling pressure returns, the key support zone to defend is $74,000–$76,000 — the range that represents the first meaningful demand zone below the current level. A retest of this range would not automatically invalidate the bullish thesis — but a daily close below $72,142 (the 100-day MA) would significantly weaken the recovery narrative and bring the $65K–$68K zone back into focus.
Bottom Line
Bitcoin has delivered the reclaim that bulls needed — a decisive close above $80,000 at a 3-month high, backed by a historic trendline defense, a gold-style wedge breakout parallel, and institutional demand that has fundamentally changed the support structure beneath every correction. The 2026 bottom at $60,061 is looking increasingly like the real thing.
The next test is straightforward: hold $80,000 as new support and push toward $90,600. If that sequence plays out, the conversation will shift quickly from “is the bottom in?” to “how far does this rally go?”
Frequently Asked Questions (FAQ)
What is Bitcoin’s current price and why is $80K significant?
Bitcoin is trading at $80,333 as of May 4, 2026 — a 3-month high. The $80,000 level is significant because it was a repeated rejection point in late February 2026 before the correction to $60K. Reclaiming it cleanly signals a structural shift in momentum.
What is the historic ascending trendline that analysts are watching?
The multi-year ascending trendline is a macro support line connecting Bitcoin’s major cycle lows across multiple years. Bitcoin recently tested and defended this line near $65,000 — replicating behaviour that preceded rallies of +968%, +259%, +1,126%, and +660% in prior cycles.
What is the gold rising wedge parallel for Bitcoin?
Analyst @noBScrypto identified a structural similarity between Bitcoin’s current chart and gold’s multi-year rising wedge — where gold defended its lower trendline and broke out powerfully. Bitcoin has mirrored this sequence — defending support near $60K and now breaking above $80K.
What is Bitcoin’s next price target above $80K?
The next major resistance target is $90,600 — representing a further +13% move from current levels. Beyond that, the longer-term fractal thesis points toward a full recovery toward the $126,213 ATH if macro conditions cooperate.
What support must Bitcoin hold to keep the bullish structure intact?
The immediate support zone is $74,000–$76,000. A daily close below the 100-day MA at $72,352 would significantly weaken the bullish case and bring the $65K–$68K zone back into focus.
The opinions and market insights shared on CoinsProbe represent the views of individual authors based on prevailing market conditions at the time of publication. Cryptocurrency investments carry significant risk and volatility. Readers are encouraged to conduct their own research and seek professional financial advice before making investment decisions. CoinsProbe and its contributors do not accept responsibility for financial losses or decisions made based on published content.
CoinsProbe may publish sponsored articles, affiliate links, or promotional collaborations. All sponsored material is clearly labeled to maintain transparency with our audience. Our editorial decisions remain fully independent, and advertising partnerships do not influence reviews, rankings, or published opinions.
Since 2023, CoinsProbe has delivered reliable insights on cryptocurrency, blockchain, and digital assets. Our content is created by experienced researchers and analysts who follow strict editorial standards focused on accuracy, transparency, and credibility. Every article is carefully reviewed and verified using trusted sources and current market data. We provide unbiased analysis and timely updates covering everything from emerging crypto projects to major industry developments.