
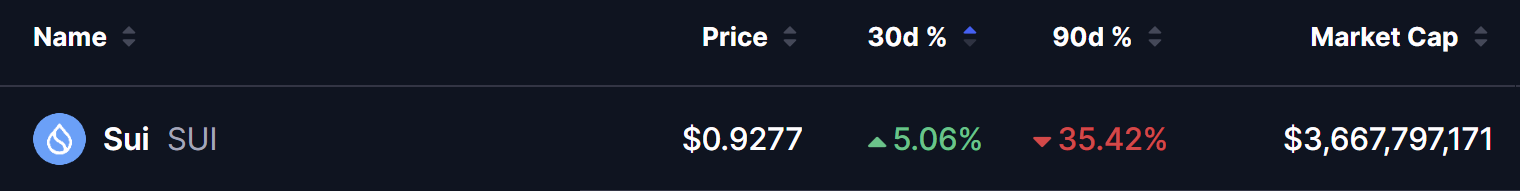
- SUI has held green over the last 30 days despite a 35% drop in the past 90 days — showing early signs of resilience.
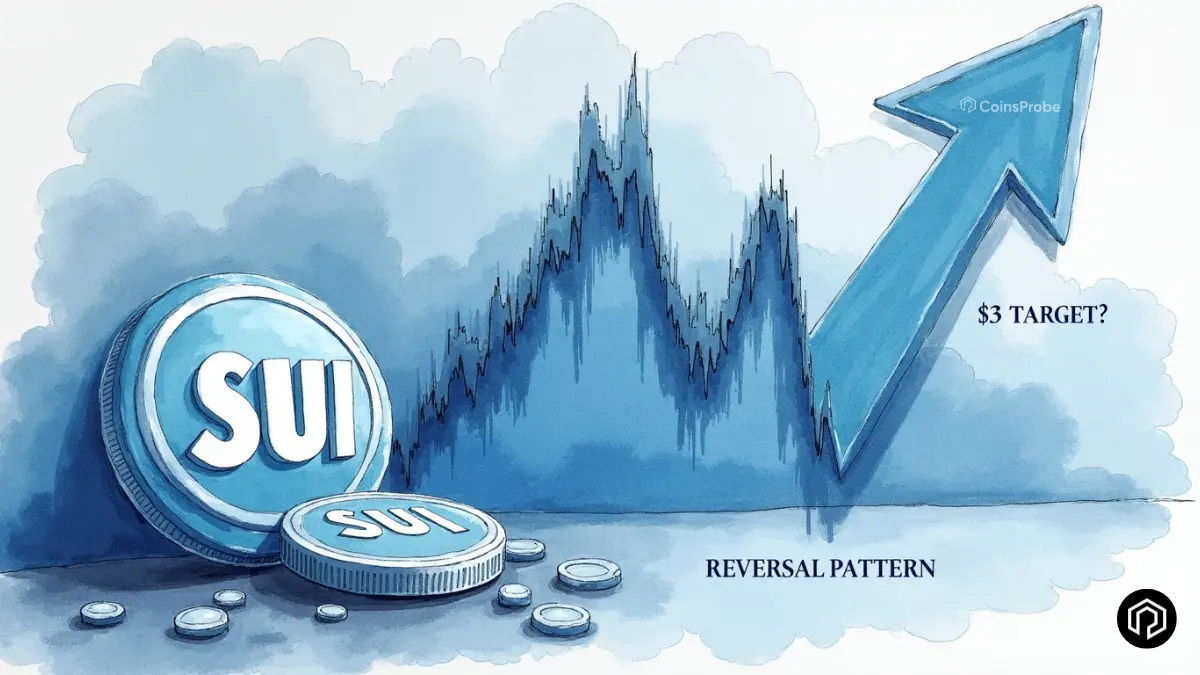
- The daily chart is forming a Bump and Run Reversal (BARR) pattern after a sharp decline from $4.45 highs to a low of $0.5610.
- Price is currently consolidating between $0.7883 and $1.09 — the critical decision zone for bulls.
- A breakout above the Lead-In trendline at $1.60 is the key confirmation trigger — with a first target of $3.00+.
- A break below $0.7883 support would significantly weaken the bullish case.
Sui’s native token $SUI — powering one of crypto’s fastest-growing Layer-1 blockchains known for its parallel execution architecture and sub-second finality — is beginning to show early signs that its prolonged downtrend may be running out of steam along with some noticeable altcoins including Tezos (XTZ).
After absorbing a punishing decline from its July 2025 highs and enduring months of relentless selling pressure, SUI has quietly turned green over the last 30 days — even as the broader 90-day picture still reflects a 35% loss. That divergence between short-term resilience and medium-term weakness is exactly the kind of behaviour that often appears at the tail end of major corrective cycles.
Meanwhile the daily chart is beginning to form a structure that technical analysts will recognise immediately — and one that, if it completes as the pattern suggests, could set the stage for one of the more significant recoveries in SUI’s trading history.
Bump and Run Reversal — The Pattern in Focus
The daily chart reveals what appears to be a developing Bump and Run Reversal (BARR) pattern — a technical structure first identified by Thomas Bulkowski and considered one of the more reliable reversal setups when its three distinct phases complete in sequence. The pattern is characterised by a sharp speculative spike — the “bump” — followed by a gradual return to the original trendline, setting the stage for a sustained reversal move in the opposite direction.
The three phases are clearly visible on SUI’s daily chart:
Lead-In Phase — The initial trending move that establishes the baseline trendline. On SUI’s chart, this phase is defined by the descending trendline originating from the $4.4519 rejection high in July 2025 — sloping downward at a moderate angle and establishing the channel that has governed price action ever since. This trendline currently sits near $1.60 and is the critical breakout level bulls must reclaim.
Bump Phase — The sharp, high-momentum decline that carries price far away from the Lead-In trendline — typically driven by panic selling or capitulation. On SUI’s chart, the Bump Phase produced a brutal drop from the $4.45 highs all the way down to a swing low of $0.5610— a decline that brought price to levels not seen since SUI’s early trading days and represented a near-total erasure of the 2024-2025 bull run gains.
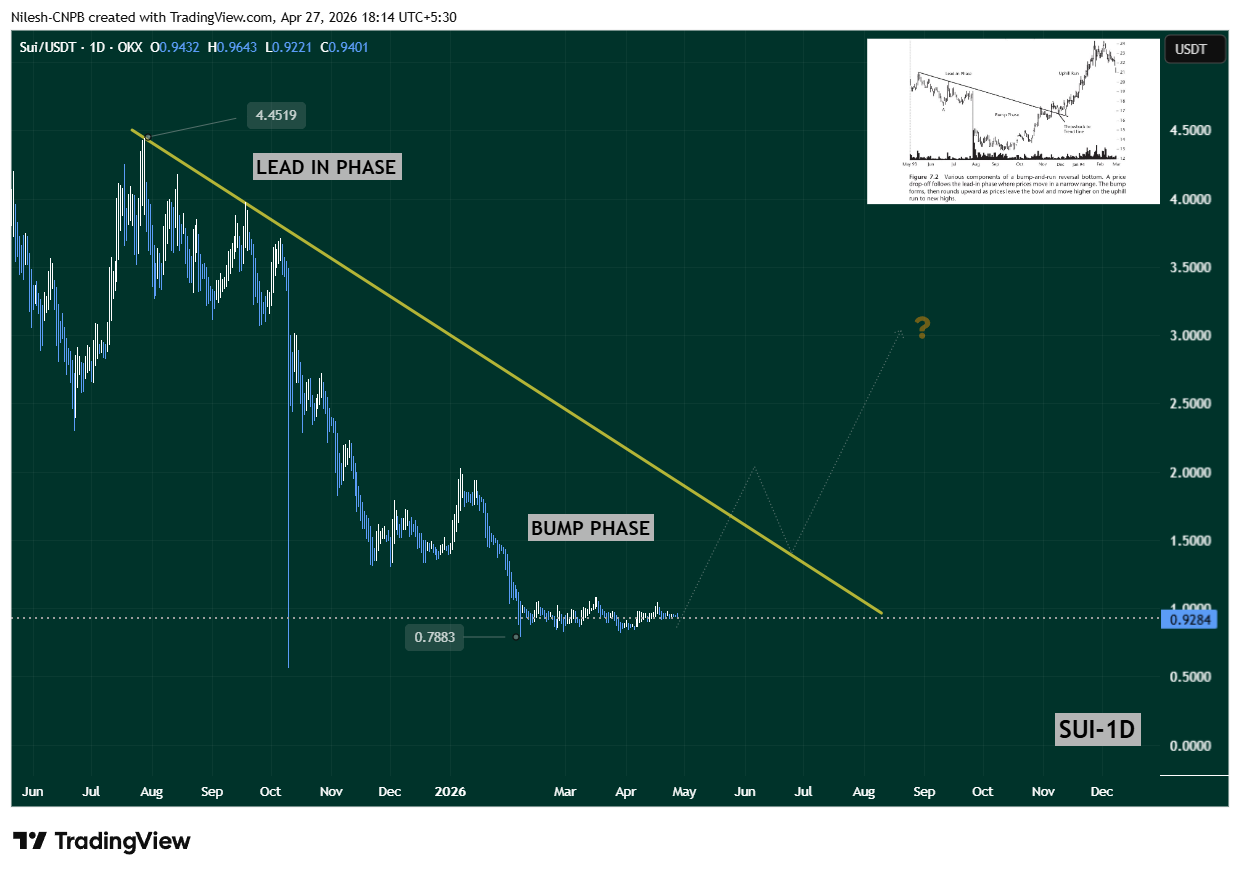
The Consolidation Zone — The Line in the Sand
The range between $0.7883 and $1.09 is the most important zone on SUI’s chart right now. This consolidation band has become what the chart describes as a “hard rock” for buyers — a region where selling pressure from above and buying support from below are locked in a battle that will ultimately determine SUI’s next major directional move.
What’s Next for SUI?
With the BARR pattern structure in place and price consolidating at a critical decision zone, two clear scenarios define SUI’s path forward:
Bullish Scenario
For the Bump and Run Reversal pattern to confirm fully, SUI must break above the Lead-In Phase descending trendline near $1.60. A clean breakout, followed by a successful retest of this level as support, would be the technical confirmation that the Run Phase is underway.
From there, the pattern’s measured move and prior support-resistance structure point toward an initial target above $3.00 — a level that would represent a +220% move from current prices and bring SUI back into the range where significant prior demand existed during the 2024-2025 bull cycle.
Bearish Scenario
If SUI fails to sustain its current consolidation and selling pressure pushes price below the $0.7883 support level on a daily closing basis, the BARR pattern’s bullish thesis weakens considerably. A break below $0.7883 would signal that the Run Phase has failed to gain traction — and that the consolidation zone was not genuine accumulation but rather a brief pause before further decline. In this scenario the next meaningful support would need to be identified well below current levels.
Bottom Line
SUI is at a technically significant crossroads. The Bump and Run Reversal pattern forming on the daily chart — combined with 30-day price resilience amid broader weakness — presents a compelling case that a meaningful bottom is being built in the $0.7883–$1.09 consolidation zone. The pattern is clear, the levels are defined, and the breakout trigger is specific: a daily close above $1.60.
Above that level, the path toward $3.00+ opens up. Below $0.7883 on a daily close, the thesis needs reassessment. For SUI traders and holders, this consolidation zone is the most important range to watch in the weeks ahead.
Frequently Asked Questions (FAQ)
What is the Bump and Run Reversal (BARR) pattern on SUI’s chart?
A BARR pattern has three phases — a Lead-In trendline, a sharp Bump decline, and a Run recovery back through the trendline. On SUI’s daily chart, the bump carried price from $4.45 down to $0.5610, and price is now consolidating in the early Run Phase between $0.73 and $1.09.
What is the breakout confirmation level for SUI?
SUI must break and close above the Lead-In Phase descending trendline near $1.60 to confirm the BARR pattern. A successful retest of $1.60 as support following the breakout would strengthen the bullish case further.
What is the key support SUI must hold?
The $0.7883 level is the critical lower boundary of the current consolidation zone. A daily close below this level would weaken the bullish pattern thesis significantly.
The opinions and market insights shared on CoinsProbe represent the views of individual authors based on prevailing market conditions at the time of publication. Cryptocurrency investments carry significant risk and volatility. Readers are encouraged to conduct their own research and seek professional financial advice before making investment decisions. CoinsProbe and its contributors do not accept responsibility for financial losses or decisions made based on published content.
CoinsProbe may publish sponsored articles, affiliate links, or promotional collaborations. All sponsored material is clearly labeled to maintain transparency with our audience. Our editorial decisions remain fully independent, and advertising partnerships do not influence reviews, rankings, or published opinions.
Since 2023, CoinsProbe has delivered reliable insights on cryptocurrency, blockchain, and digital assets. Our content is created by experienced researchers and analysts who follow strict editorial standards focused on accuracy, transparency, and credibility. Every article is carefully reviewed and verified using trusted sources and current market data. We provide unbiased analysis and timely updates covering everything from emerging crypto projects to major industry developments.