
- ETH trades at $2,737.28 (-0.16%) with $334.1B market cap as CryptoQuant Analyst Consensus flips to STRONG BUY
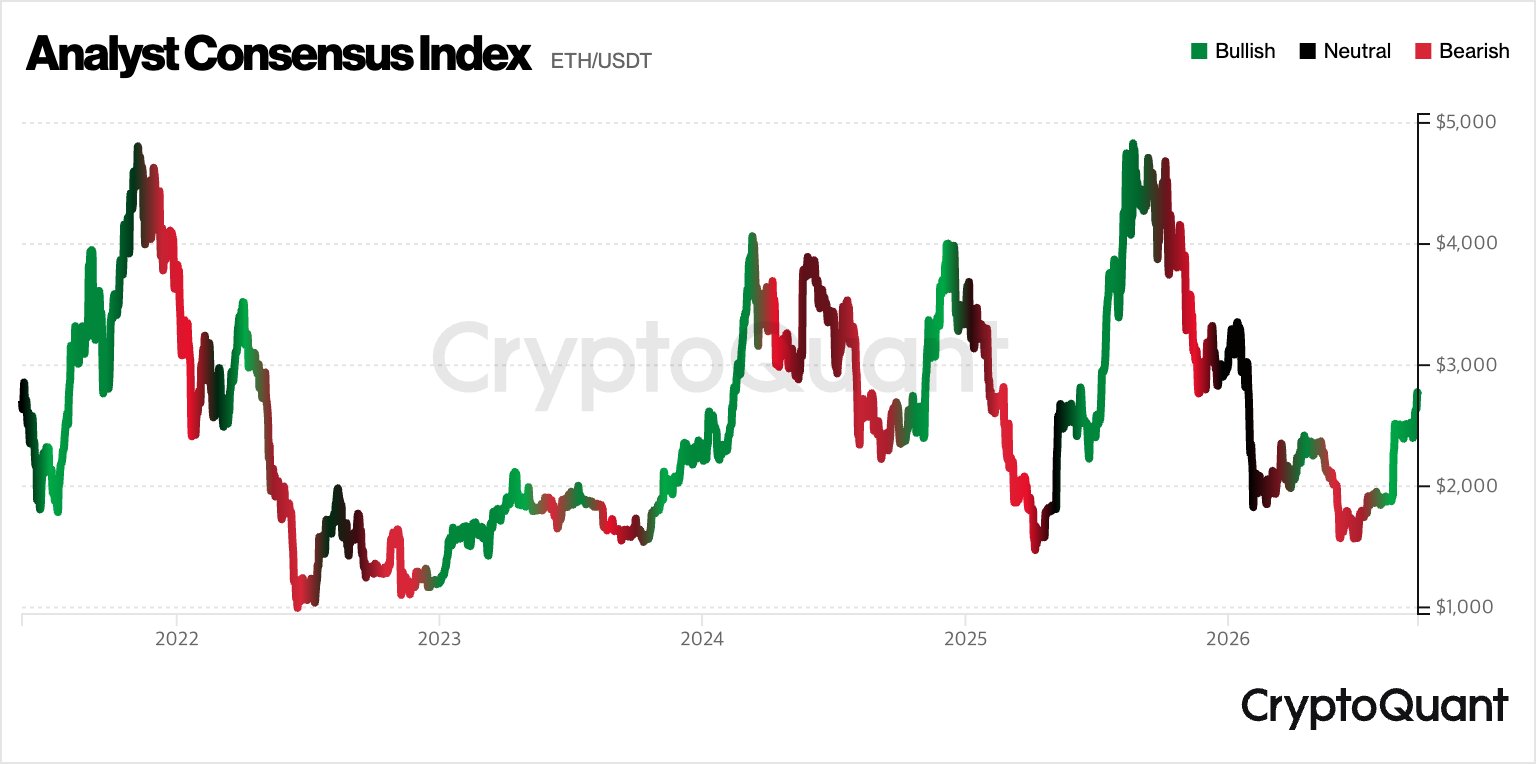
- Ki Young Ju's CryptoQuant chart shows Green consensus at cycle lows preceded 150%–300% ETH recoveries in 2022 and 2025
- Current Green signal emerged after ETH fell from ~$5,000 peak to ~$1,700–$1,800 low — same configuration as prior instances
- Watch $3,000 to the upside and $2,400 to the downside as the two structural decision levels
Ethereum is trading at $2,737.28 — essentially flat on the day (-0.16%) — with a market cap of $334.1 billion. Beneath the surface quiet, CryptoQuant’s Analyst Consensus Index has just flipped to its strongest reading: STRONG BUY. The last two times this signal appeared at comparable price lows, ETH did not consolidate indefinitely — it moved 2x to 3x from the signal zone.
CryptoQuant founder Ki Young Ju (@ki_young_ju) posted the signal directly on September 23, 2026, writing: “Analyst consensus on Ethereum: STRONG BUY.”
The declaration carries weight precisely because it is not a single analyst’s opinion — it is a composite aggregation of multiple independent analyst inputs inside CryptoQuant’s consensus framework, all pointing in the same direction simultaneously.
What the Analyst Consensus Index Actually Measures
The CryptoQuant Analyst Consensus Index is not a sentiment poll. It aggregates structured on-chain and market analysis submissions from CryptoQuant’s registered analyst community into a single directional score — Green (Bullish), Black (Neutral), or Red (Bearish). A STRONG BUY reading requires broad agreement across contributors, not a simple majority. It is a composite signal, not a single data point, which is what separates it from an individual call.
The current reading has turned Green with ETH near $2,000–$2,100 at the time the chart was captured — having bounced from a low near $1,700–$1,800. The recovery toward $2,737 at present represents the market already beginning to reprice from that signal zone.
The Historical Pattern — What Happened After Prior Green Signals
Ki Young Ju’s chart covers approximately five years of ETH price history alongside the Analyst Consensus color overlay. Two prior Green signal periods are visible at structural lows:
| Signal Period | ETH Price at Signal | Subsequent High | Move From Signal |
|---|---|---|---|
| 2022 Bear Market Bottom | ~$1,000 | ~$4,000+ (2024 cycle) | ~+300% |
| 2025 Mid-Cycle Dip | ~$2,000 | ~$5,000 (early 2026) | ~+150% |
| Current (2026) | ~$1,700–$1,800 low / $2,737 now | TBD | TBD |
Source: CryptoQuant Analyst Consensus Index via @ki_young_ju (X)
The pattern is consistent: the Green consensus does not appear at market tops. It has historically materialized at moments when price has already compressed significantly from prior highs — and has preceded the next leg of recovery. The 2022 bottom signal preceded a move toward $4,000+. The 2025 dip signal preceded a run to $5,000. The current signal arrives after ETH fell from the $5,000 peak toward $1,700 before recovering.
Ki Young Ju’s chart shared on September 23 shows the Analyst Consensus color overlay against ETH’s full price history from 2021 through early 2026. The current green signal appears at the right edge of the chart, with ETH having bottomed near $1,700–$1,800 and recovering toward the $2,000+ range at the time of the chart’s publication. The visual alignment with the 2022 bottom pattern — where green emerged at the cycle nadir before a multi-year recovery — is the structural argument for the current reading.
Why This Signal Carries More Weight at This Specific Price Level
ETH at $2,737 sits 45% below its early 2026 peak near $5,000. A drawdown of that magnitude from a cycle high into a Green consensus reading is the exact configuration that defined both the 2022 and 2025 prior instances. The signal does not appear when price is at highs — it appears when the analyst community collectively concludes that risk/reward has shifted in favor of buyers.
This matters structurally for one specific reason: the CryptoQuant consensus is backward-looking in its inputs (on-chain data, realized price levels, exchange flows, miner behavior) but forward-looking in its implication. When analysts with access to those data layers all converge on the same directional call, it suggests that the on-chain regime — not just price action — has shifted. For context on what an on-chain regime shift looks like at the Bitcoin level, the Bitcoin MVRV Exits Accumulation Zone article documents a comparable dynamic playing out simultaneously in the broader market.
Ethereum’s current daily trading volume of $15.95 billion confirms that the asset is not illiquid or ignored — it is actively traded at these levels, which means the consensus reading is being stress-tested in real market conditions, not in a low-volume vacuum.
What the Signal Confirms — And What It Does Not
The Analyst Consensus Index confirms directional bias among CryptoQuant’s analyst community. It does not confirm entry timing, price target, or the magnitude of any move. The 2022 instance took months before price decisively broke out. The 2025 instance was faster. The current one may follow either path.
What it does not do: it does not eliminate downside risk. ETH could retest $2,000 or lower and still validate the signal — the 2022 instance saw further consolidation after the Green flip before the sustained breakout. The signal is a regime indicator, not a trigger.
Readers tracking Ethereum’s price structure around key levels should also note our earlier analysis: Ethereum Clears $2,700 — Analyst Eyes $3,000 as the Next Level — which identified $3,000 as the next structural target from a technical standpoint, aligning with the upside implied by the current consensus signal.
Bullish Scenario — Hold $2,700 and Advance Toward $3,000+
If ETH sustains above $2,700 and builds volume above $3,000, the historical 2–3x move from the $1,700–$1,800 signal low implies a potential target range of $3,400–$5,400 over the medium term. This aligns with the prior cycle pattern where the 2025 dip signal at ~$2,000 preceded the run to $5,000.
Bearish Scenario — Loss of $2,400
A decisive daily close below $2,400 would suggest the recovery from the $1,700 low is stalling. The critical structural support to monitor is $2,000 — a break there would not necessarily invalidate the signal (2022 showed Green during extended consolidation) but would extend the accumulation timeline and test analyst conviction.
The One Number That Matters Now
CryptoQuant’s Analyst Consensus has a two-instance track record of turning Green at cycle lows and preceding 150%–300% recoveries. The current reading is the third Green signal in the five-year dataset. ETH bottomed near $1,700–$1,800, has recovered to $2,737, and the composite of on-chain analysts remains collectively bullish. Whether this becomes a third confirmed instance — or an extended consolidation like the early phase of the 2022 pattern — will be determined at $2,400 on the downside and $3,000 on the upside. Those are the two levels CryptoQuant’s data and the chart’s structural architecture both point to as the next meaningful decision points. Watch $3,000 — a sustained close above it flips the macro chart structure from recovery to breakout.
Frequently Asked Questions
What is CryptoQuant’s Analyst Consensus Index and why does a STRONG BUY reading matter for ETH?
How far could ETH move if the Strong Buy signal plays out like prior instances?
What level would invalidate the bullish signal for Ethereum?
Is the Analyst Consensus Index a timing tool for ETH entry?
Source: Ki Young Ju · Published by CoinsProbe Markets Desk
The opinions and market insights shared on CoinsProbe represent the views of individual authors based on prevailing market conditions at the time of publication. Cryptocurrency investments carry significant risk and volatility. Readers are encouraged to conduct their own research and seek professional financial advice before making investment decisions. CoinsProbe and its contributors do not accept responsibility for financial losses or decisions made based on published content.
CoinsProbe may publish sponsored articles, affiliate links, or promotional collaborations. All sponsored material is clearly labeled to maintain transparency with our audience. Our editorial decisions remain fully independent, and advertising partnerships do not influence reviews, rankings, or published opinions.
Since 2023, CoinsProbe has delivered reliable insights on cryptocurrency, blockchain, and digital assets. Our content is created by experienced researchers and analysts who follow strict editorial standards focused on accuracy, transparency, and credibility. Every article is carefully reviewed and verified using trusted sources and current market data. We provide unbiased analysis and timely updates covering everything from emerging crypto projects to major industry developments.