
- ETH trades at $2,527.22 (-1.05% 24h) with the Investor Price blue line narrowing in proximity on the log chart
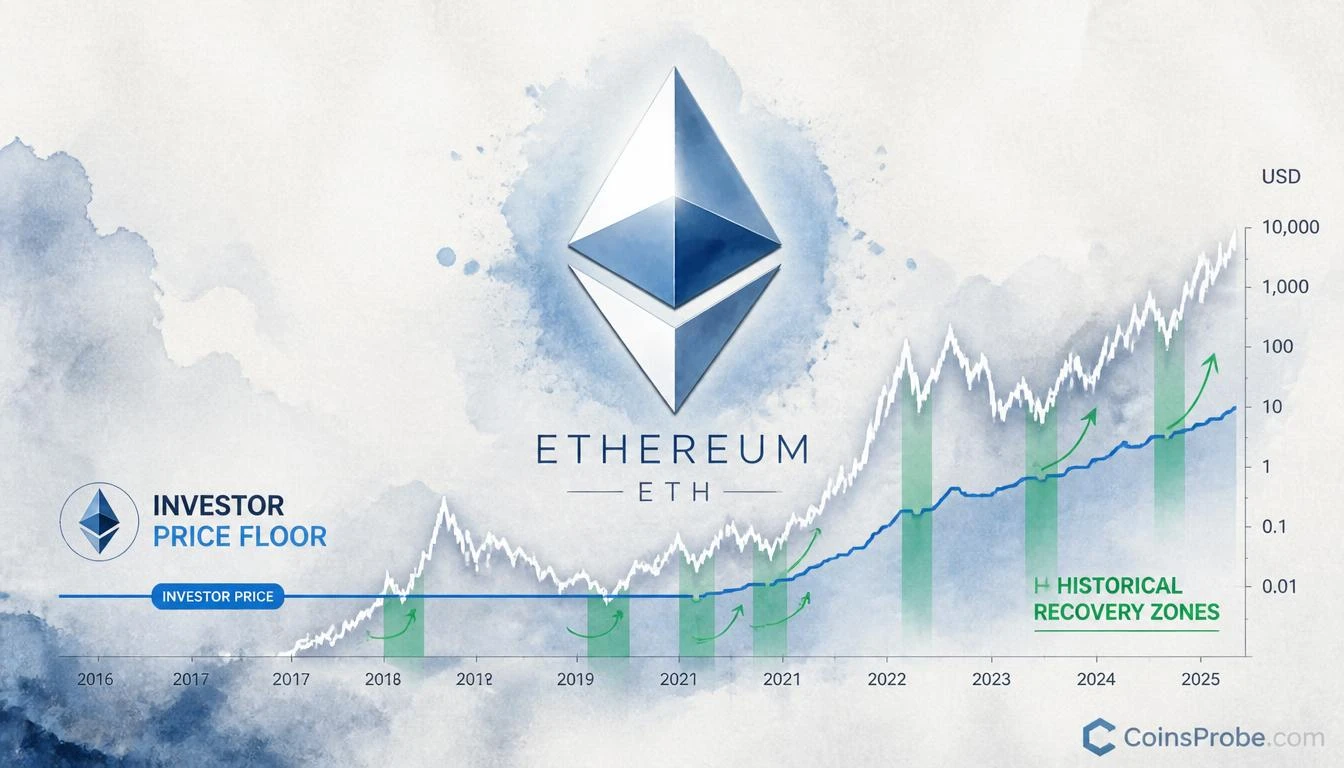
- Alphractal: every green-shaded zone where ETH touched Investor Price on full history chart preceded a recovery — zero exceptions on the chart
- Investor Price = Investor Cap ÷ Adjusted Supply (excludes lost ETH) — cleaner floor than Realized Price
- Binance holds 49% of ETH open interest (record since 2023) — derivatives concentration could amplify any move toward this floor
Ethereum is trading at $2,527.22 — down 1.05% in the past 24 hours against a market cap of approximately $308.65 billion. The price decline is modest, but one on-chain metric is now demanding attention: the Investor Price, a level that has acted as a reliable accumulation floor every time ETH has approached or breached it throughout the asset’s history.
On-chain analytics platform Alphractal (@Alphractal) flagged the metric on October 12, 2026, with a direct instruction: “If Ethereum drops for any reason, keep a close eye on the Investor Price. Historically, this metric has served as a strong price floor.” The post has drawn over 5,900 views, underscoring the signal’s relevance to traders positioning around ETH’s current range.
What the Investor Price Actually Measures
Before assessing the signal, the metric itself warrants a precise definition — because it is frequently confused with Realized Price.
The Investor Price is calculated as Investor Cap divided by Adjusted Supply. Crucially, Adjusted Supply excludes coins classified as permanently lost — wallets whose private keys are irretrievable and which have not moved in years. This exclusion is what separates Investor Price from Realized Price, which counts all coins including provably lost supply in its denominator.
The practical result: Investor Price produces a cleaner, higher estimate of the true average acquisition cost for economically active Ethereum holders. It strips out dormant supply that no rational market participant would ever sell, leaving only the coins that actually determine price discovery dynamics. In Alphractal’s words: “It represents the average acquisition price of all economically circulating (non-lost) Ethereum.”
The Historical Track Record — Green Zones on the Chart
The logarithmic chart shared by @Alphractal spans Ethereum’s full price history from 2016 through October 2026. Two lines dominate the visual: the white line (ETH spot price) and the blue line (Investor Price). The defining feature is a series of green shaded vertical bands — each marking a period where the white price line touched, crossed, or fell below the blue Investor Price line.
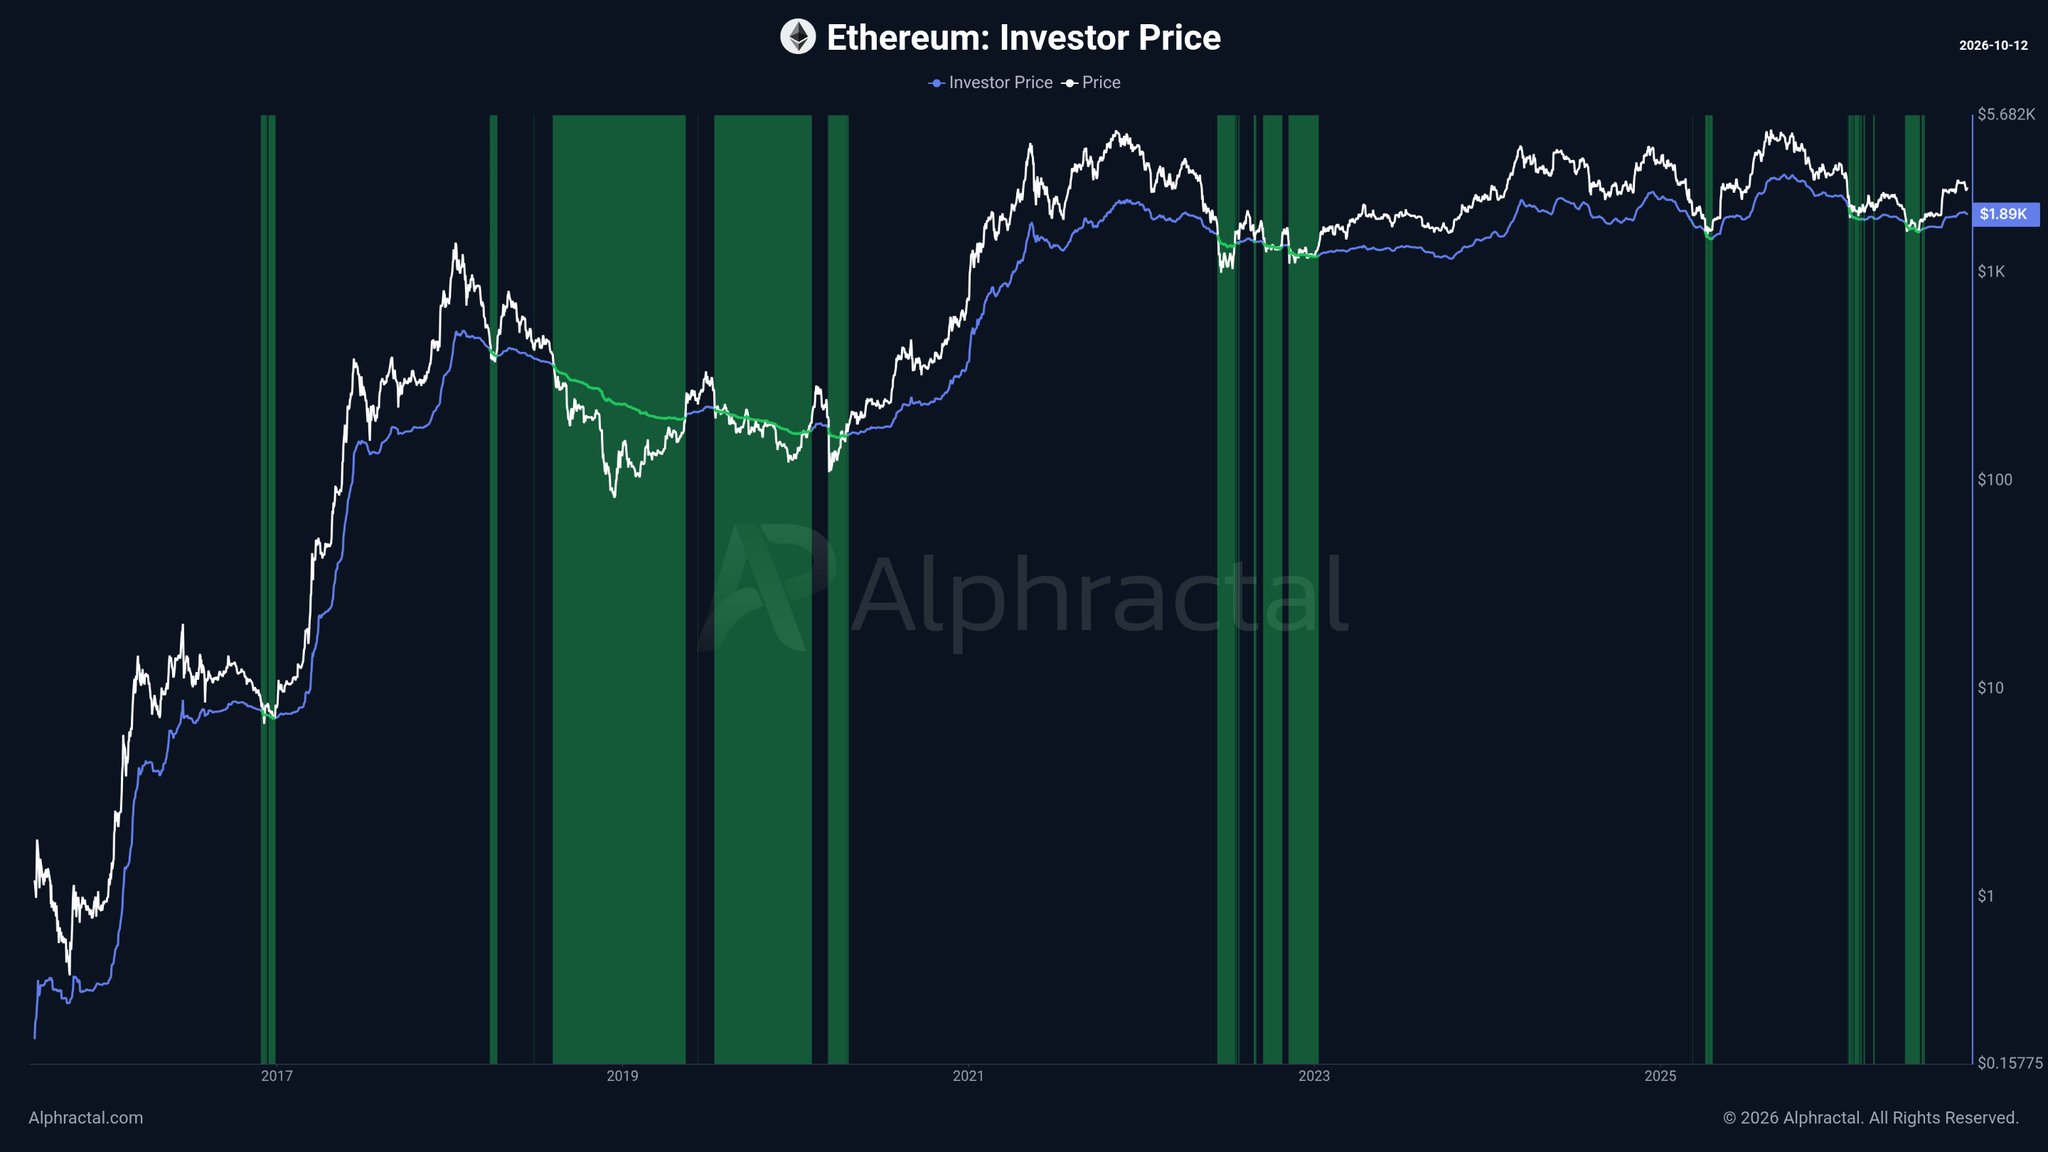
What the chart makes immediately legible is the consistency: every green-shaded zone preceded a meaningful recovery. There is no instance on the full historical chart where ETH breached the Investor Price and continued lower indefinitely without subsequently staging a recovery from that zone. The metric has functioned as a gravitational floor, not a guaranteed buy signal with a fixed time horizon, but a structural reference point where selling pressure historically exhausted itself.
The chart’s price axis runs from $0.15775 at the bottom to $5,682 near the top on a logarithmic scale, with the current price label reading $1.89K on the chart annotation — the value at chart construction time. At the time of writing, ETH’s live price is $2,527.22, reflecting subsequent market movement. Both figures are reported separately to avoid conflating the chart’s annotated value with the live ticker.
Where ETH Sits Today — and Why Proximity Matters
The current chart configuration shows the white price line sitting modestly above the blue Investor Price line, with the gap between the two narrowing relative to prior cycle peaks. This narrowing gap is precisely the condition Alphractal is flagging as a watch zone.
The metric’s significance is not directional — Alphractal does not state that ETH will fall to the Investor Price, nor does the post assign a specific numerical level to it in the tweet. What the post establishes is a conditional: if Ethereum drops for any reason, the Investor Price is the level at which historical accumulation behavior has concentrated. Traders treating it as a downside alert zone — not a downside inevitability — are reading the signal correctly.
This distinction matters in the current macro environment. With broader risk assets navigating elevated bond yields and persistent inflation data, Ethereum is not immune to macro-driven drawdowns. As covered in CoinsProbe’s analysis of TIPS bond ETF signals and their relationship to crypto, macro leading indicators have repeatedly telegraphed risk-off pressure before it reached spot prices. The Investor Price functions as the on-chain counterpart to that macro-level caution.
Investor Price vs. Realized Price — Why the Distinction Is Structural
The difference between these two metrics is more than definitional — it is structural. Realized Price, the more commonly cited on-chain floor metric, includes millions of ETH that are permanently inaccessible. Including those coins in the supply denominator artificially lowers the average cost basis of all holders, producing a floor estimate that understates where actual market participants are positioned.
Investor Price corrects for this by using only economically active supply. The result is a metric that more accurately represents the weighted average entry point of participants who can actually sell. When price approaches this level, it reflects genuine stress among real holders — not a statistical artifact inflated by lost coins. That is why the green zones on Alphractal’s chart correspond to recoveries: those zones represent points where active holders were, on average, at or near breakeven, and selling pressure from profit-taking was structurally minimal.
For additional context on ETH derivatives positioning around this period, CoinsProbe has separately noted that Binance now holds 49% of ETH open interest — a record since 2023 — a concentration of derivatives exposure that could amplify price moves in either direction should spot prices approach a structural floor like the Investor Price.
Bullish Scenario
If ETH holds above the Investor Price on any near-term drawdown — without ever breaching it — the metric reinforces the floor narrative and supports a recovery thesis. Every prior instance on the chart where price touched the Investor Price zone and reversed produced a subsequent rally; holding above it entirely would represent structural strength relative to those historical episodes.
Bearish Scenario
A sustained close below the Investor Price — particularly on a weekly or monthly timeframe — would represent the first instance in Ethereum’s charted history where this metric failed to arrest a drawdown. Alphractal does not define this as the expected scenario, but traders monitoring the metric should treat a confirmed breach as a signal that the structural floor has weakened, requiring reassessment of the accumulation thesis.
Ethereum is trading at $2,527.22 — above the Investor Price but close enough to it that any macro or protocol-driven drawdown would bring the two lines into direct contact. The Investor Price is not a buy signal with a countdown timer. It is a historically validated structural reference: the average cost basis of everyone in Ethereum who still has access to their coins. When price approaches that level, the data says selling pressure has historically exhausted and recovery has followed. The level to watch is the blue Investor Price line on Alphractal’s logarithmic chart — exact numerical value updates with each block, but its location relative to $2,527 is the number every ETH holder should have in a price alert today.
Frequently Asked Questions
What is Ethereum’s Investor Price and how is it different from Realized Price?
Has Ethereum’s price ever stayed below the Investor Price for an extended period?
How do I find the current numerical value of Ethereum’s Investor Price?
Does the Investor Price signal tell you which direction ETH will move?
Source: Alphractal · Published by CoinsProbe Markets Desk
The opinions and market insights shared on CoinsProbe represent the views of individual authors based on prevailing market conditions at the time of publication. Cryptocurrency investments carry significant risk and volatility. Readers are encouraged to conduct their own research and seek professional financial advice before making investment decisions. CoinsProbe and its contributors do not accept responsibility for financial losses or decisions made based on published content.
CoinsProbe may publish sponsored articles, affiliate links, or promotional collaborations. All sponsored material is clearly labeled to maintain transparency with our audience. Our editorial decisions remain fully independent, and advertising partnerships do not influence reviews, rankings, or published opinions.
Since 2023, CoinsProbe has delivered reliable insights on cryptocurrency, blockchain, and digital assets. Our content is created by experienced researchers and analysts who follow strict editorial standards focused on accuracy, transparency, and credibility. Every article is carefully reviewed and verified using trusted sources and current market data. We provide unbiased analysis and timely updates covering everything from emerging crypto projects to major industry developments.