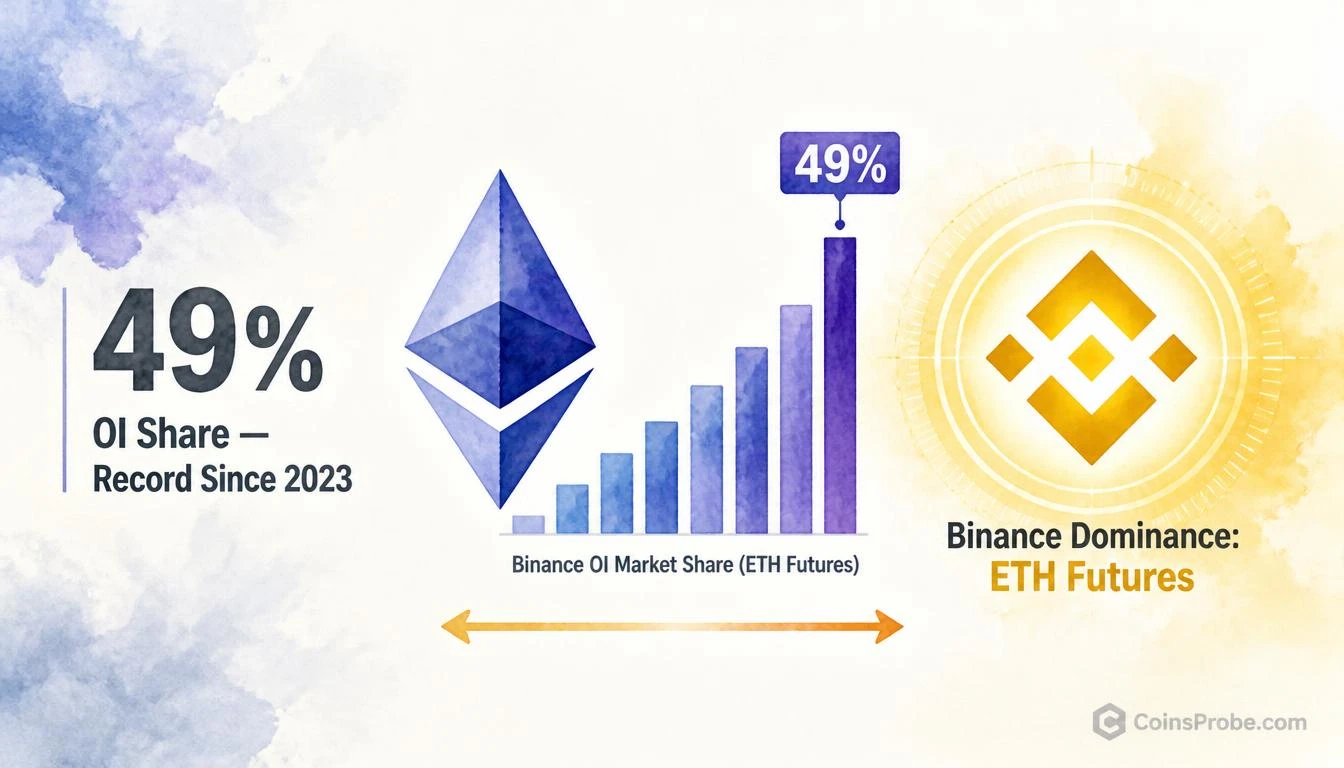
- ETH is trading at $2,527.73 (-1.23% 24h) as Binance's ETH futures OI share hits a record 49% since 2023
- CryptoQuant analyst Darkfost: "Nearly half of all ETH committed to futures markets now sits on Binance derivatives"
- 49% OI concentration on one venue amplifies liquidation cascade risk in both directions — directional bias unspecified
- Metric to watch: Binance ETH OI market share on CryptoQuant's derivatives dashboard in real time
Ethereum is trading at $2,527.73, down 1.23% over the past 24 hours, with a market cap of approximately $308.7 billion. Beneath that price action, a structural concentration signal has quietly reached a level not seen since 2023: Binance now controls 49% of all ETH open interest across futures markets.
That figure comes directly from CryptoQuant analyst Darkfost (@Darkfost_Coc), published via @cryptoquant_com on October 12, 2026. In his words: “Nearly half of all ETH committed to futures markets now sits on Binance derivatives.” The reading marks a record concentration on a single venue since the metric was first tracked in 2023.
What ETH Open Interest Concentration Actually Measures
Open interest is the total number of outstanding futures contracts that have not been settled. When one exchange holds a disproportionate share of that total, it means that a large fraction of the market’s directional exposure, leverage, and liquidation risk is concentrated on a single platform’s order book and liquidation engine.
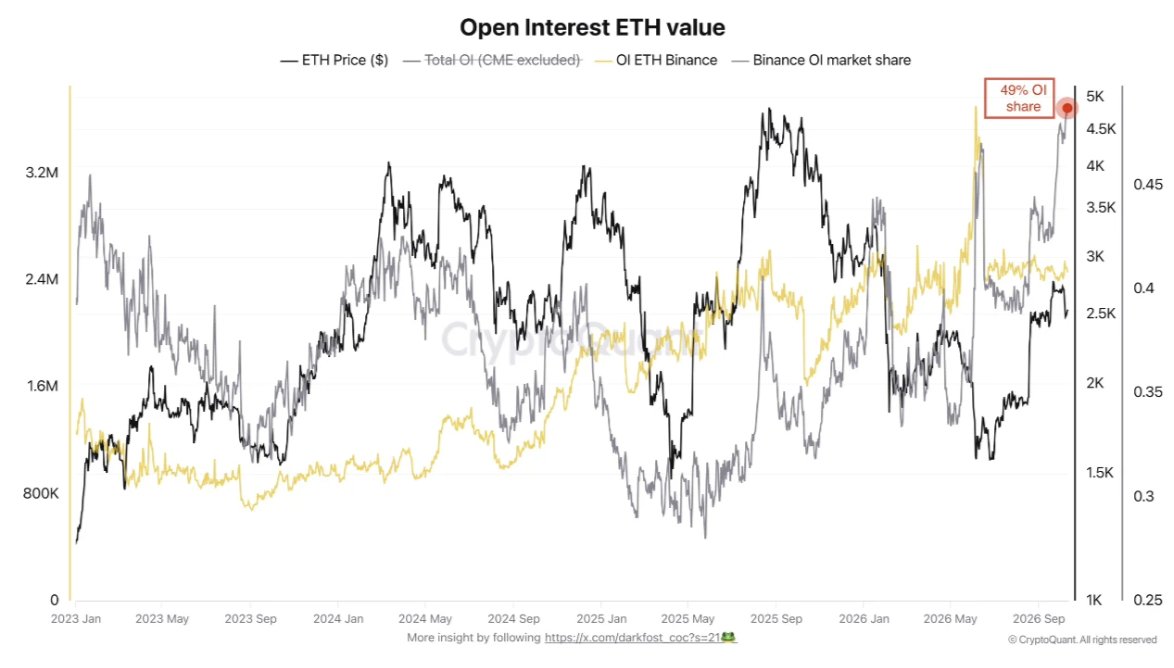
Binance’s ETH OI market share reaching 49% means that nearly one in every two ETH futures contracts globally — whether long or short — currently exists on Binance. The CryptoQuant chart tracking this metric shows both the absolute ETH open interest on Binance (yellow line) and Binance’s percentage share (gray line) surging sharply at the rightmost edge of the dataset, diverging from the flatter behavior that characterized most of the 2023–2025 period. The annotation box on the chart explicitly labels the current reading as 49% OI share.
Why 49% on a Single Exchange Is Structurally Significant
Futures market concentration carries specific mechanical implications that differ from spot market concentration. When nearly half of all ETH futures exposure lives on one venue, several dynamics shift simultaneously.
Liquidation cascade risk increases. If ETH moves sharply against the dominant directional positioning on Binance, the liquidations cluster on one venue’s engine rather than being distributed across Bybit, OKX, dYdX, and others. Concentrated liquidations can amplify price moves in either direction because the liquidation engine executes at market price, adding momentum to the initial move.
Funding rate signals become Binance-dominant. When Binance holds 49% of OI, its funding rate becomes the de facto reference for the ETH futures market. A funding rate imbalance on Binance now carries more weight than at any point since 2023 — because a larger share of the market is paying or receiving that rate.
Price discovery gravitates toward Binance’s order book. Large block trades, liquidations, and institutional positioning flows increasingly pass through one venue, which can narrow or widen spreads relative to other exchanges in ways that create short-term basis divergences.
It is worth being precise about what this signal does not say: Darkfost’s note carries no explicit directional bias. The 49% reading is characterized as a concentration signal — historically significant since 2023 — not as a bullish or bearish trigger. No price targets, support zones, or upside projections are stated in the analyst’s note. The article reflects that characterization precisely.
Historical Context — What This Level Has Preceded
The CryptoQuant chart covers ETH OI share data from January 2023 through October 2026. The current 49% reading sits at the top of the range visible across that entire window, representing a fresh record for Binance’s dominance of ETH futures. The prior range across 2023–2025 showed Binance’s share oscillating within a lower band before this most recent vertical spike.
Concentration at this level has historically preceded periods of elevated volatility — not because concentration itself causes price direction, but because the structural conditions for outsized moves (clustered liquidations, dominant funding, single-venue price discovery) are fully in place. Whether that volatility resolves to the upside or downside depends on the positioning that underlies the open interest, which this chart does not specify.
For broader context on ETH’s positioning on Binance, CoinsProbe previously reported that ETH liquidity on Binance had hit a 7-month low — a supply-side dynamic that now sits alongside this demand-side concentration reading. Separately, a whale rotating $19.1M from BTC into ETH earlier this cycle signals that large-scale directional conviction in ETH remains active.
What Traders Are Watching
A 49% OI share on Binance sets up a specific monitoring framework. The key variable is not the concentration itself but the direction of that positioning. If the bulk of Binance’s ETH open interest is long-biased, then a sharp move lower creates cascading liquidations that accelerate the drop. If it is short-biased, a squeeze to the upside becomes the structural risk.
Darkfost does not specify the directional composition of the 49% — only the concentration level. The full CryptoQuant Quicktake analysis is linked in the source post and contains the complete breakdown.
The metric to track in real time: Binance ETH OI market share on CryptoQuant’s derivatives dashboard. If the 49% reading holds or climbs further, the structural concentration deepens. If it begins to normalize — meaning OI redistributes to Bybit, OKX, and other venues — that signals the extreme is resolving without a liquidation event.
Bullish Scenario
If Binance’s concentrated ETH OI is predominantly short-biased, a sustained move above near-term resistance forces a short squeeze concentrated on a single venue’s liquidation engine — producing amplified upside momentum. The 49% concentration means the squeeze would be larger in dollar terms than at any point since 2023.
Bearish Scenario
If the 49% OI is predominantly long-biased and ETH continues its current -1.23% trajectory, Binance becomes the primary venue for cascading long liquidations. Concentrated long OI at a single venue on a declining price is the structural setup for an accelerated move lower — the same mechanism that amplified ETH drawdowns during prior concentration spikes.
Binance holding 49% of ETH open interest is the single most concentrated position the exchange has occupied since 2023. Darkfost’s signal from CryptoQuant identifies the structural fact — nearly half of all ETH futures exposure globally now resides on one venue — without specifying the directional bet embedded within it. That unknown is precisely what makes the reading significant: the conditions for a high-velocity ETH move, in either direction, are structurally assembled. Watch Binance’s ETH OI share on CryptoQuant’s derivatives dashboard — and watch ETH at $2,527.73 as the current baseline against which that concentrated positioning will be tested.
Frequently Asked Questions
What does Binance holding 49% of ETH open interest actually mean for traders?
Is the 49% ETH OI concentration on Binance a bullish or bearish signal?
Where can I track Binance’s ETH open interest market share in real time?
How does ETH OI concentration on Binance differ from ETH spot liquidity on Binance?
Source: CryptoQuant · Published by CoinsProbe Markets Desk
The opinions and market insights shared on CoinsProbe represent the views of individual authors based on prevailing market conditions at the time of publication. Cryptocurrency investments carry significant risk and volatility. Readers are encouraged to conduct their own research and seek professional financial advice before making investment decisions. CoinsProbe and its contributors do not accept responsibility for financial losses or decisions made based on published content.
CoinsProbe may publish sponsored articles, affiliate links, or promotional collaborations. All sponsored material is clearly labeled to maintain transparency with our audience. Our editorial decisions remain fully independent, and advertising partnerships do not influence reviews, rankings, or published opinions.
Since 2023, CoinsProbe has delivered reliable insights on cryptocurrency, blockchain, and digital assets. Our content is created by experienced researchers and analysts who follow strict editorial standards focused on accuracy, transparency, and credibility. Every article is carefully reviewed and verified using trusted sources and current market data. We provide unbiased analysis and timely updates covering everything from emerging crypto projects to major industry developments.