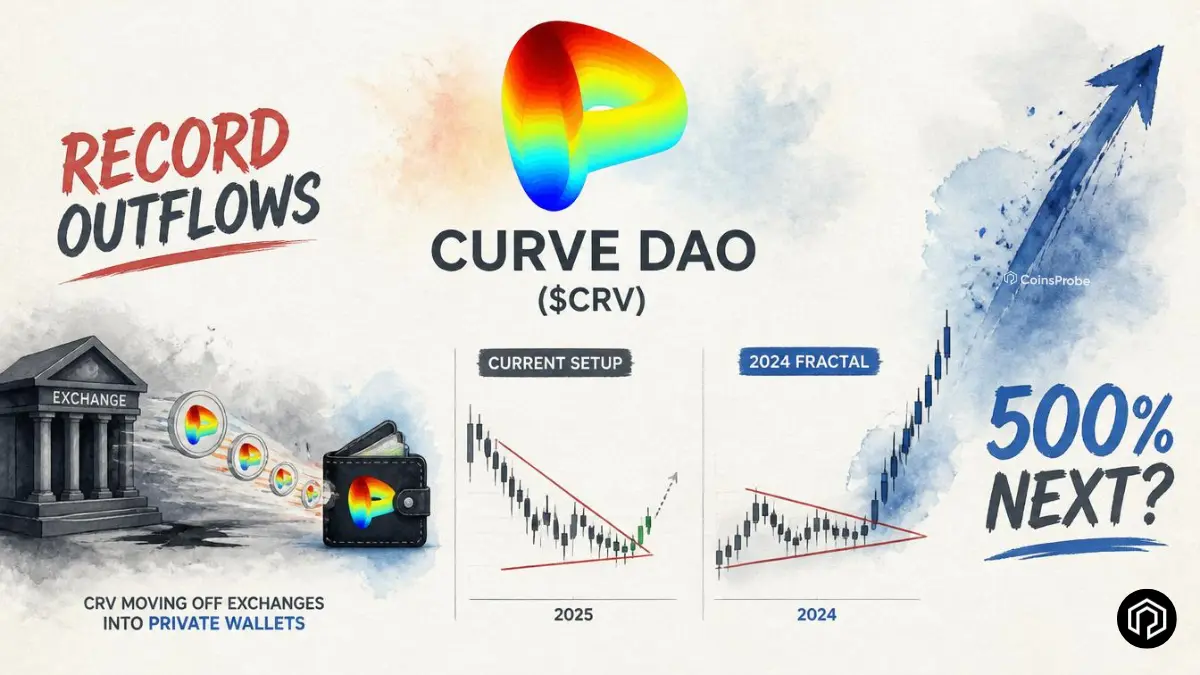
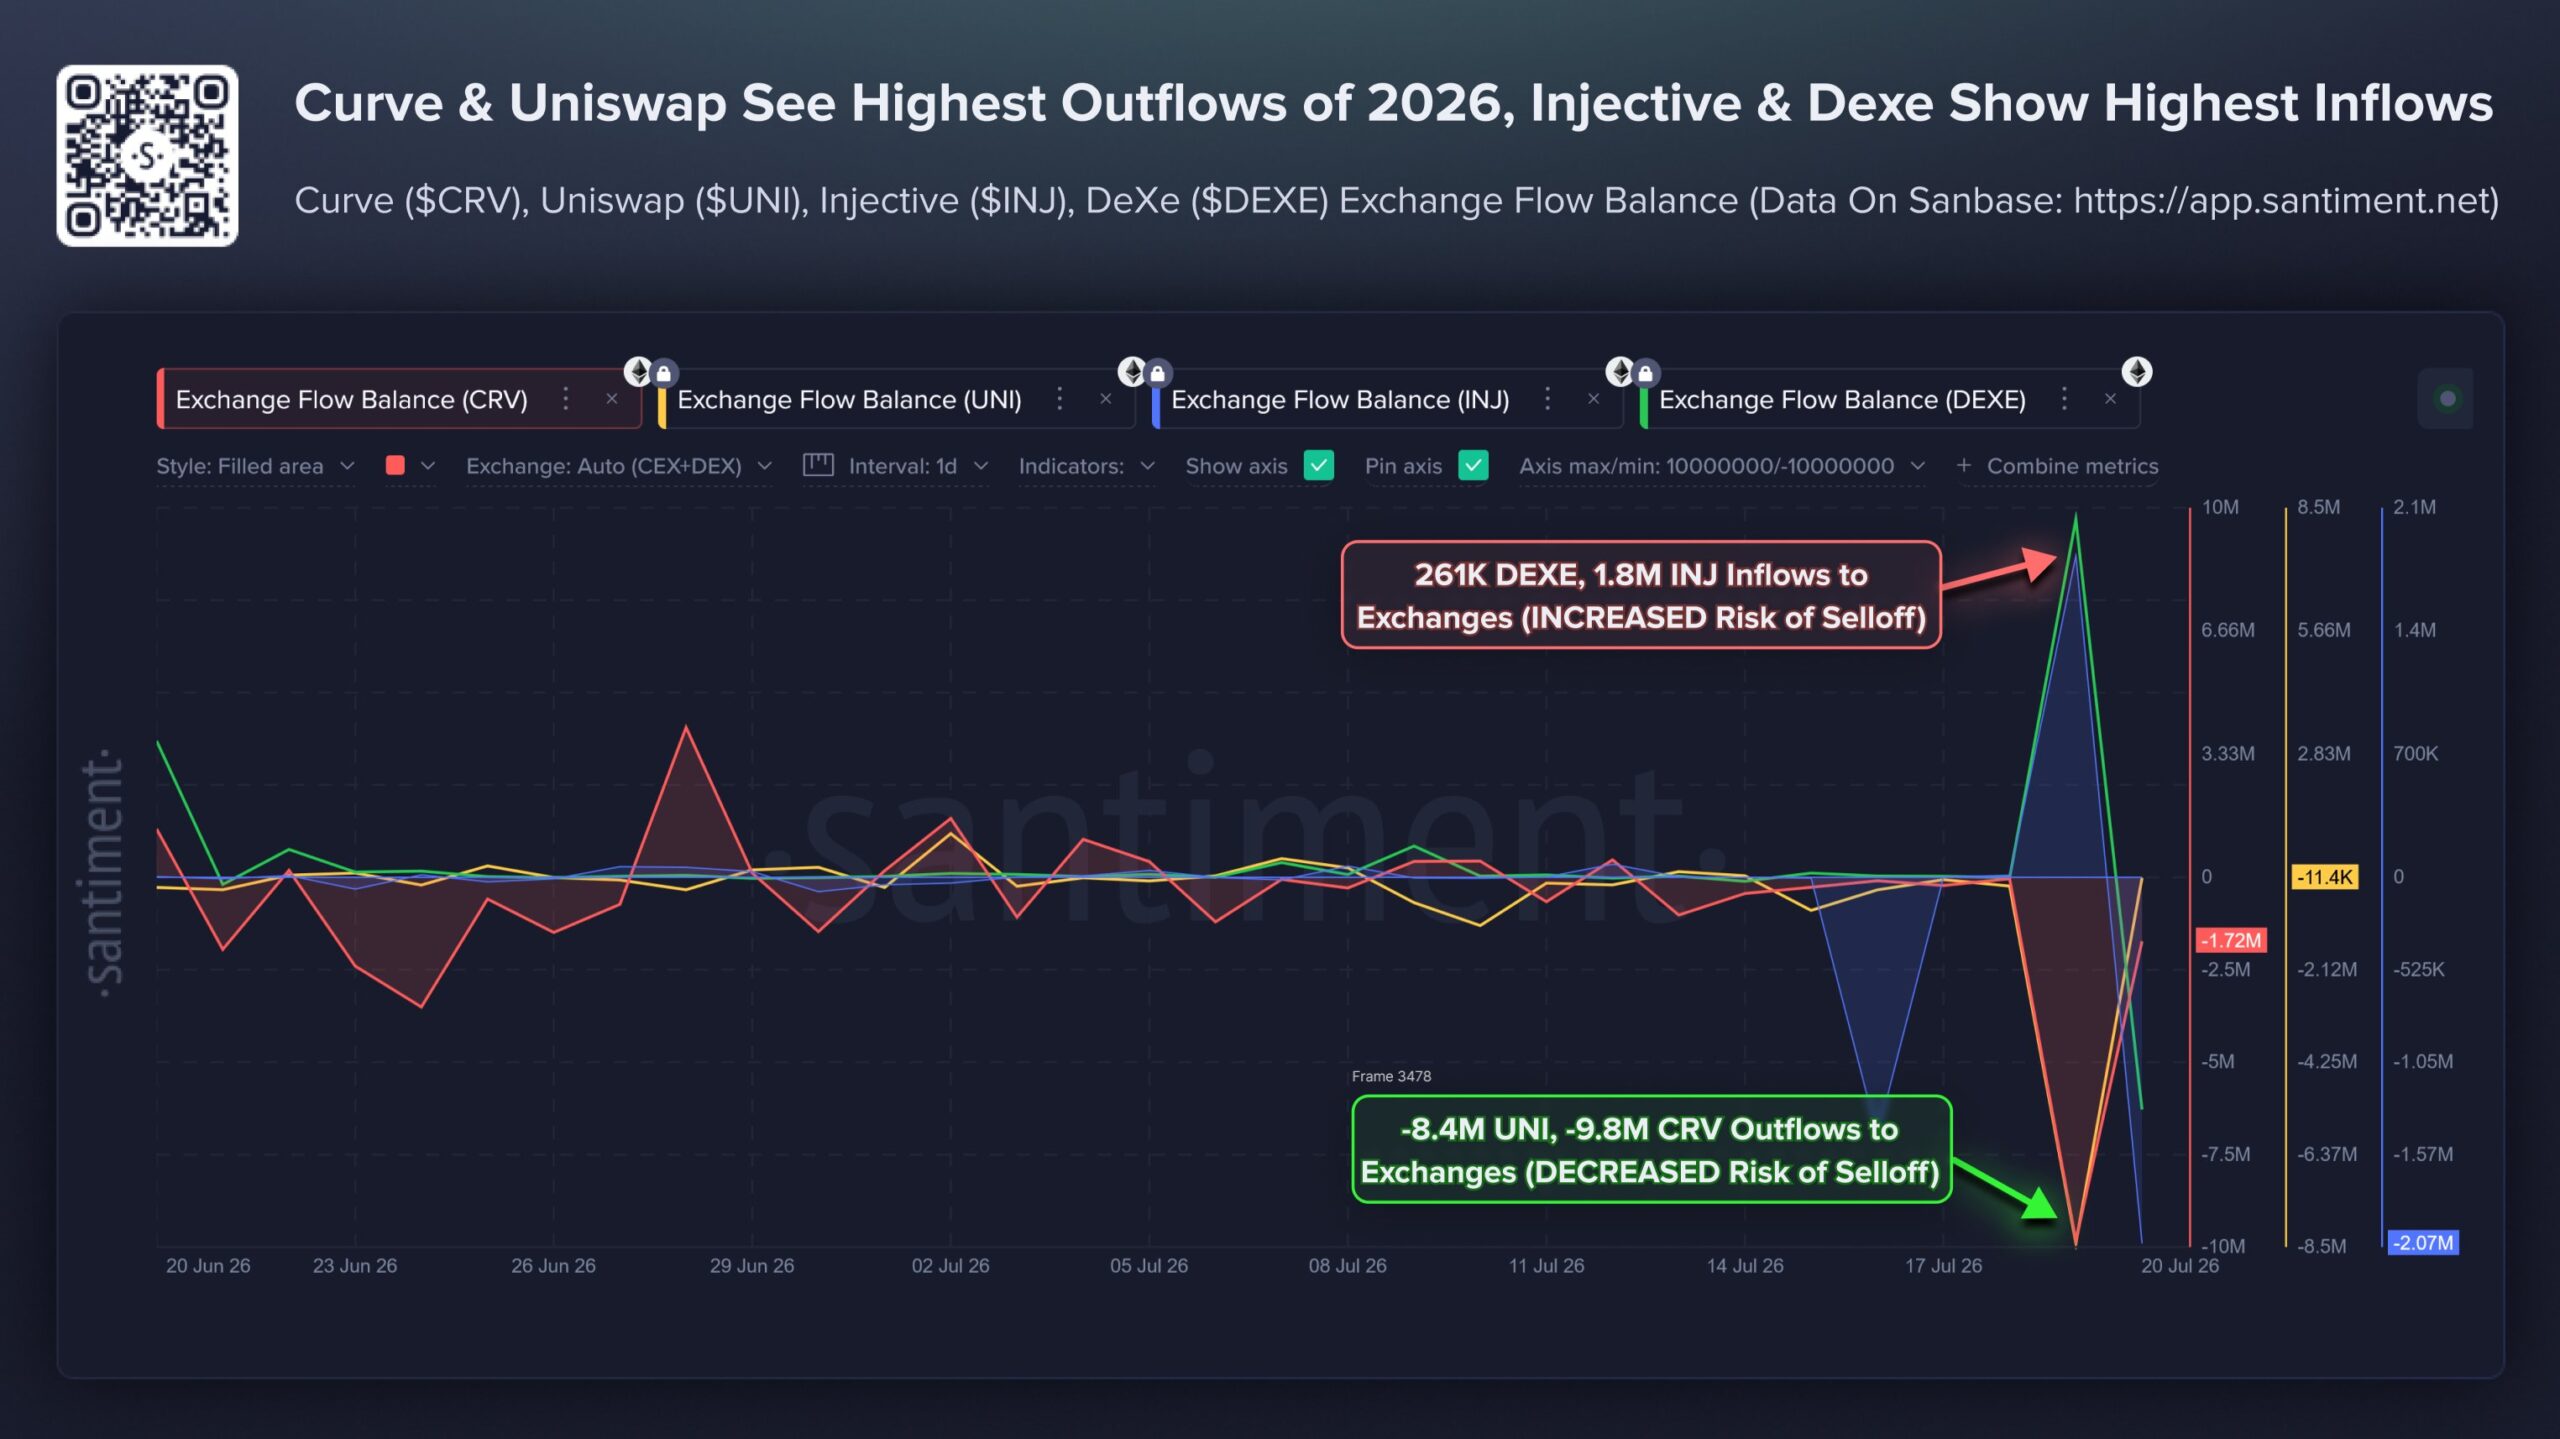
- Santiment reports 9.8 million CRV left centralized exchanges in 24 hours, reducing near-term sell pressure.
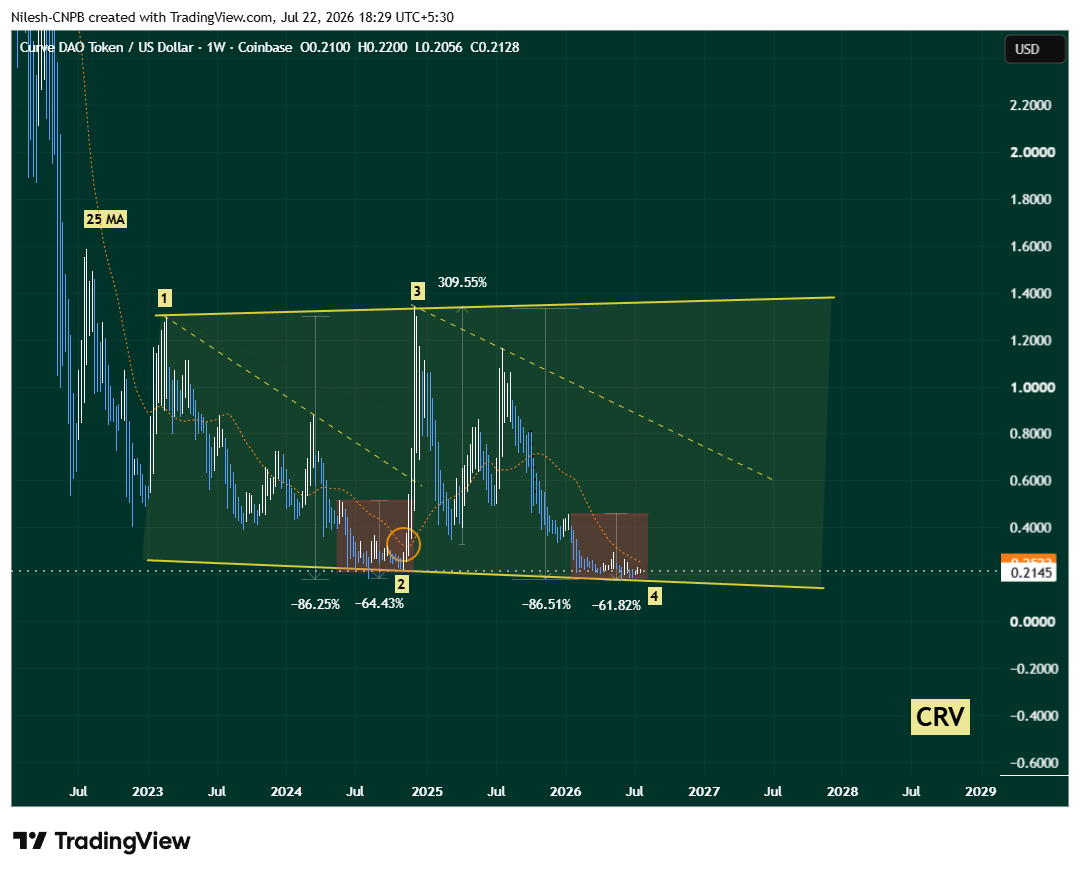
- CRV's chart is mirroring its 2024 broadening wedge, which preceded a 309% rally.
- A move above $0.2523 and $0.4580 could confirm the bullish setup, with a long-term target near $1.37.
Curve DAO Token is presenting a multi-signal setup that combines on-chain outflow data, protocol-level fundamental improvements, and a weekly chart fractal with a documented historical parallel — all pointing toward the same potential conclusion from different analytical angles.
CRV is trading around $0.2149 — up +0.20% in 24 hours and +0.74% over 30 days — with a market cap of approximately $329 million and a YTD performance of -40% from earlier 2026 highs.

Signal 1 — Record Exchange Outflows Reduce Sell Pressure
According to Santiment, CRV and Uniswap (UNI) recently recorded their highest exchange outflows of 2026 in the same 24-hour period:
| Token | 24h Exchange Outflow |
|---|---|
| CRV | ~9.8 million tokens |
| UNI | ~8.4 million tokens |
Exchange outflows — when tokens move from centralised exchange wallets to private wallets — are generally interpreted as a constructive signal because they reduce the immediately available sell-side supply on exchange order books. Tokens sitting on exchanges are available to sell at any moment; tokens in private wallets require an active decision to move back to an exchange before they can be sold.
Why the timing matters for CRV specifically:
The outflow is occurring alongside a series of protocol-level improvements that give the holding thesis genuine fundamental backing:
Cheaper crvUSD minting — reducing the cost barrier for the protocol’s native stablecoin, expanding its potential user base.
Rebuilt PegKeeper reserves — restoring the stability mechanism infrastructure that supports crvUSD’s peg maintenance.
Rising veCRV distributions — increasing the yield available to locked CRV holders, providing a direct incentive for long-term holding rather than liquid selling.
Llamalend V2 momentum — the next iteration of Curve’s lending product showing growing usage and integration.
When tokens exit exchanges while on-chain usage and fee-generating activity are simultaneously improving — the combination suggests holders are positioning for longer-term holding rather than preparing to distribute. This is the opposite of the pattern visible in tokens like INJ and DEXE, which saw notable exchange inflows in the same period — the signal that typically precedes short-term selling pressure.
Signal 2 — The 2024 Fractal: A Documented +309% Recovery
The weekly chart is the most compelling element of the current CRV setup — because it shows a pattern that has already played out once before on the same asset with documented results.
The late 2024 historical parallel:
CRV experienced a sharp -86.25% correction to find a local bottom in late 2024. Within that broader decline, a -64.43% manipulation zone correction — marked in red on the chart — created the final shakeout phase before the recovery began. Once price reclaimed the 25-period moving average on a sustained basis, that reclaim acted as the trigger for a powerful +309.55% rally as momentum shifted decisively bullish.
The 2026 current setup:
The 2026 structure has replicated the sequence with striking precision:
A -86.51% correction — nearly identical in depth to the 2024 instance (-86.25%). A -61.82% manipulation zone correction — comparable to the prior -64.43% shakeout. Price has consolidated near the $0.17 lower boundary before the recent bounce to the current ~$0.21 level.
This is the same type of fractal comparison we have been applying to multiple assets throughout 2026 — including the XRP vs ZEC fractal warning, the DEXE vs CRO collapse fractal, and the BEAT vs LAB symmetrical triangle warning. The difference in CRV’s case is that the fractal is pointing toward recovery rather than collapse — and it has already produced a +309% outcome once before on the same asset.
The Two Confirmation Levels — What to Watch
The broadening wedge pattern has produced a specific, level-based roadmap with two sequential confirmation gates:
Confirmation 1 — Reclaim of the 25 MA at $0.2523:
A decisive, sustained close above the 25-period moving average at $0.2523 would be the first meaningful technical confirmation that the 2026 fractal is following its 2024 predecessor’s path. In the prior instance, this reclaim was the specific trigger that preceded the +309% rally — making it the most important near-term level to watch.
From the current price of $0.2149, reaching $0.2523 requires approximately +17% upside — a meaningful but achievable move if the outflow-driven supply reduction and improving protocol fundamentals translate into sustained buying pressure.
Confirmation 2 — Break above $0.4580:
A subsequent break and sustained hold above $0.4580 would confirm the larger bullish structure is intact and open the door for the broadening wedge’s full measured move to develop. This level is approximately +113% above current price — the kind of move that would require a significant shift in broader market sentiment toward CRV alongside the token-specific catalysts already in place.
The full target — $1.37:
If both confirmation levels are cleared, the broadening wedge projects the upper resistance trendline near $1.37 — representing approximately +500% upside from the current $0.2149 price level. This would broadly mirror the +309.55% outcome the same fractal produced in 2024, extended by the larger scale of the 2026 pattern.
The Risk — What Invalidates the Setup
The bullish fractal thesis is not without a defined invalidation level — and it is worth being explicit about where the setup fails.
A breakdown below the $0.17 support zone — particularly on a sustained weekly close basis — would weaken or invalidate the bullish structure, suggesting the fractal parallel is breaking down and that the manipulation zone has not yet fully completed. In this scenario, the broadening wedge’s lower boundary could extend further, and the recovery timeline would reset.
This is the same risk discipline we apply to every fractal comparison — the specific level below which the bullish case is no longer supported by the pattern structure.
Bottom Line
Curve’s current setup presents three independent signals pointing toward the same potential outcome: record exchange outflows reducing sell-side pressure, improving protocol fundamentals in crvUSD, veCRV, and Llamalend V2, and a weekly chart fractal that has already produced a +309% recovery from an almost identical prior setup on the same asset.
The confirmation pathway is clear and level-based: $0.2523 first, then $0.4580, with the full pattern target at $1.37. The invalidation is equally clear: below $0.17, the bullish thesis requires reassessment.
Watch whether the exchange outflow momentum sustains and whether the 25 MA reclaim at $0.2523 materialises — those two developments together would be the most meaningful early confirmation that the 2024 fractal is repeating.
Frequently Asked Questions
What do CRV exchange outflows signal?
Record outflows (e.g., ~9.8M CRV in 24h) signal reduced near-term sell pressure and holders positioning for the longer term. Combined with improving protocol activity, this is a constructive on-chain bullish indicator.
Will CRV recover above $1?
A recovery above $1 is possible if CRV reclaims the 25 MA (~$0.25) and $0.46, targeting the upper wedge trendline near $1.37 (+500% potential). However, it requires confirmation and is not guaranteed — breakdown below $0.17 would invalidate the setup.
Is CRV a good investment for 2026?
CRV offers high-risk/high-reward potential in 2026 due to its technical pattern and on-chain strength, but it remains highly volatile. Only suitable for risk-tolerant investors who can afford losses — DYOR and diversify.
The opinions and market insights shared on CoinsProbe represent the views of individual authors based on prevailing market conditions at the time of publication. Cryptocurrency investments carry significant risk and volatility. Readers are encouraged to conduct their own research and seek professional financial advice before making investment decisions. CoinsProbe and its contributors do not accept responsibility for financial losses or decisions made based on published content.
CoinsProbe may publish sponsored articles, affiliate links, or promotional collaborations. All sponsored material is clearly labeled to maintain transparency with our audience. Our editorial decisions remain fully independent, and advertising partnerships do not influence reviews, rankings, or published opinions.
Since 2023, CoinsProbe has delivered reliable insights on cryptocurrency, blockchain, and digital assets. Our content is created by experienced researchers and analysts who follow strict editorial standards focused on accuracy, transparency, and credibility. Every article is carefully reviewed and verified using trusted sources and current market data. We provide unbiased analysis and timely updates covering everything from emerging crypto projects to major industry developments.