
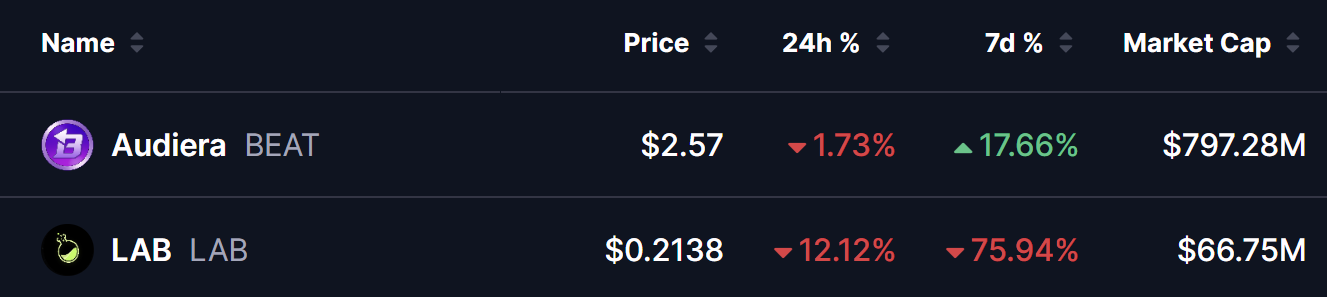
- Audiera (BEAT) is trading at $2.57, up 17.66% over the past week, with a market cap of $797.28 million.
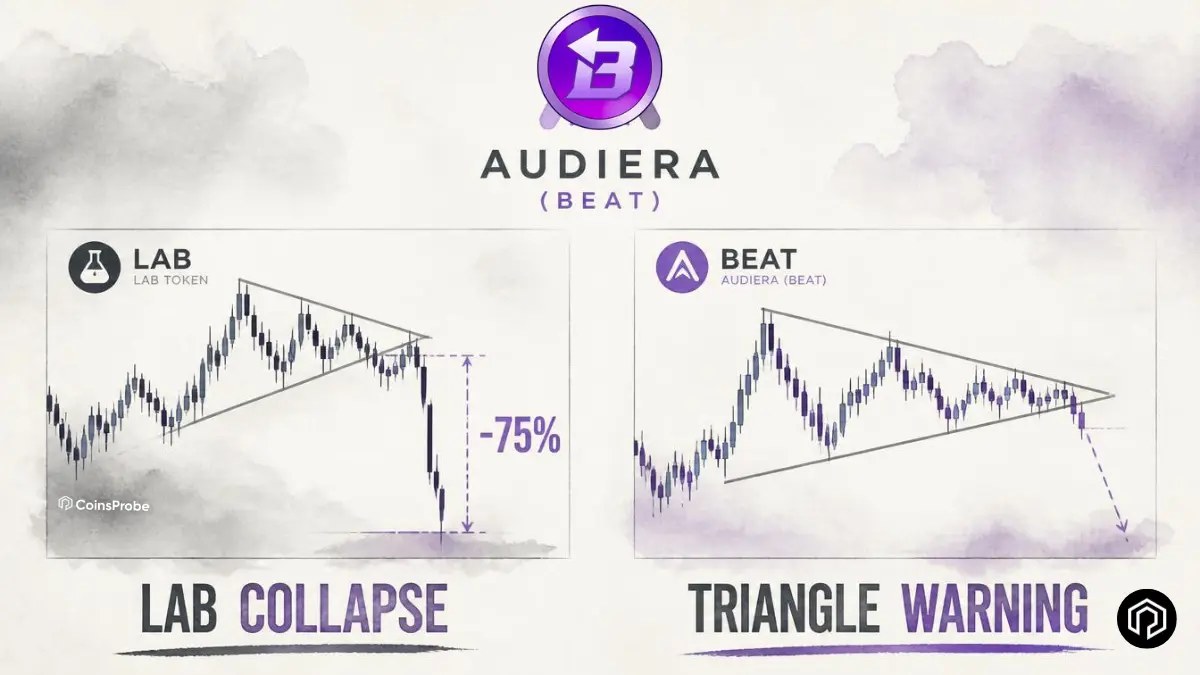
- BEAT's chart is drawing comparisons to LAB Token, which plunged nearly 76% in a week following alleged insider selling.
- A symmetrical triangle is forming on BEAT's daily chart — the same pattern that preceded LAB's sharp collapse.
- A breakout above $3.674 would invalidate the bearish setup, while a breakdown could open the door to a move toward $0.50, implying nearly 80% downside.
Audiera (BEAT) is currently trading at $2.57, down 1.73% in the last 24 hours but still up +17.66% over the past 7 days, with a market capitalization of approximately $797.28 million.
Both BEAT and LAB have proven to be highly volatile tokens in recent history, known for sudden explosive pumps followed by sharp corrections. While BEAT has shown strength this week, its chart structure is raising concerns among traders that it could follow a similar path to LAB’s dramatic collapse.
What Happened to LAB Token — The Collapse Explained
LAB Token’s -75.94% weekly decline is one of the most severe single-week drops among named tokens in the current market — and its cause, as documented by prominent on-chain investigator ZachXBT, is specific and verifiable rather than attributable to general market weakness.
The on-chain evidence ZachXBT identified:
On July 12, a wallet with documented links to the LAB team or insiders transferred and sold large quantities of LAB on decentralised exchanges — with the largest single transaction involving approximately 18.4 million LAB tokens worth approximately $18.3 million at the time of the sale.
The cascade that followed:
The scale of the insider selling triggered an immediate and severe price reaction — a 54% decline from approximately $1.20 to $0.55 in a compressed timeframe. This kind of rapid, large-scale selling creates a self-reinforcing downward spiral: the initial price drop triggers stop-losses from retail traders, which creates additional selling pressure, which triggers more stop-losses — producing the cascading collapse that took LAB from its pre-dump price to its current $0.2138.
The total damage: A -75.94% weekly decline — wiping out the majority of LAB’s market capitalisation and eroding the trader confidence that had built during its prior rally phase.
The LAB collapse follows a well-documented pattern in the broader token market — projects that generate strong short-term price momentum through community narrative and trading volume, but whose insider tokenomics create concentrated selling pressure that eventually overwhelms retail buying interest when large holders choose to exit.
The Chart Comparison — BEAT Forming the Same $LAB Structure
The specific concern connecting BEAT to LAB’s collapse is not a vague similarity in price action — it is a documented structural pattern appearing on both charts at sequential stages.
LAB’s pre-collapse chart structure:
LAB broke down from a symmetrical triangle on its daily chart — a pattern characterised by two converging trendlines, one descending from higher highs and one ascending from higher lows, that squeeze price action toward an increasingly narrow apex. When a symmetrical triangle resolves with a downside breakdown, the standard measured move projects the height of the triangle below the breakdown point — in LAB’s case producing the 80%+ correction that followed.
BEAT’s current chart structure:
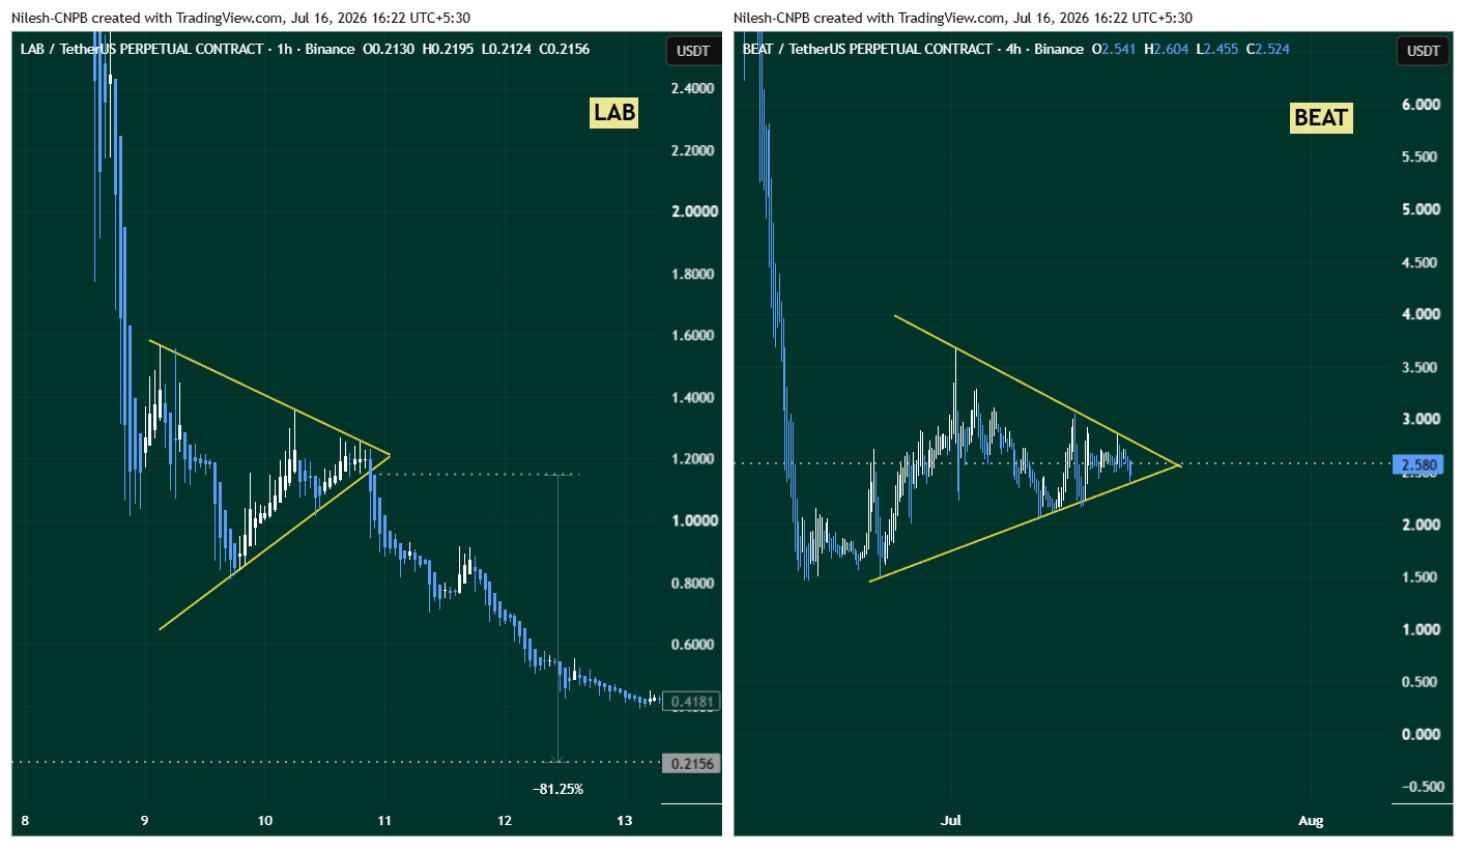
BEAT is currently forming a nearly identical symmetrical triangle on its daily chart — with both the descending upper trendline and the ascending lower support trendline converging toward a narrowing apex. The structural stage BEAT is at now maps directly to where LAB was before its breakdown.
The critical distinction between a fractal and a guarantee:
The symmetrical triangle pattern does not inherently predict direction — it identifies a coiling price structure where a significant move in one direction is building, without specifying which direction. LAB’s breakdown was specifically catalysed by the documented insider selling ZachXBT exposed — without a comparable specific catalyst, BEAT’s triangle could resolve with either a breakout or a breakdown.
What the LAB comparison establishes is the magnitude of the potential downside if the bearish scenario plays out — not a certainty that it will.
Bullish Scenario — Break Above $3.674
A decisive daily close above $3.674 — the upper trendline resistance of BEAT’s symmetrical triangle — would invalidate the bearish fractal comparison entirely. A confirmed breakout above this level with strong volume would signal that the triangle has resolved to the upside rather than the downside, and would open the door for continuation of the broader uptrend that produced BEAT’s +17.66% weekly gain.
This is the level to watch for anyone considering a long position — a confirmed close above $3.674 changes the technical picture fundamentally.
Bearish Scenario — Breakdown Below Lower Support
If BEAT instead breaks down below the ascending lower trendline of the symmetrical triangle — particularly on a sustained daily close basis with volume — the pattern’s measured move would project a target toward the $0.50 area.
From the current price of $2.57, reaching $0.50 would represent approximately -80% downside — consistent in magnitude with both LAB’s actual collapse and the standard measured move calculation for a symmetrical triangle of BEAT’s current dimensions.
Bottom Line
Audiera (BEAT) is presenting a genuine two-sided setup — a +17.66% weekly gain and an active symmetrical triangle that could resolve either as a bullish continuation above $3.674 or a bearish breakdown toward $0.50. The LAB Token collapse this week — a documented insider-selling-driven -75.94% drop from the same type of symmetrical triangle structure — is the specific precedent making traders cautious about the downside scenario.
The resolution is level-based and binary: watch $3.674 for the bullish invalidation, and watch the lower triangle trendline for the breakdown trigger. Until one of those levels is crossed with conviction, the symmetrical triangle keeps both outcomes on the table simultaneously.
This type of fractal analysis — comparing current price structures to prior collapse patterns — has been one of the more reliable early-warning frameworks in the current market cycle.
As we covered in our Zcash ZEC Price Prediction 2026 article, ZEC is currently showing a strikingly similar structural parallel to XRP’s 2021–2022 collapse setup — suggesting that fractal-based caution is warranted across multiple assets simultaneously, not just in isolated cases.
Frequently Asked Questions (FAQ)
What happened to LAB Token this week?
LAB crashed -75.94% in seven days after on-chain investigator ZachXBT exposed insider/team-linked selling — including a single transaction of ~18.4 million LAB (~$18.3M) that triggered a 54% drop from $1.20 to $0.55 before cascading further.
Why is BEAT being compared to LAB Token?
BEAT’s daily chart is forming a symmetrical triangle — the same pattern structure LAB broke down from before its 80%+ correction — with both trendlines converging at a similar structural stage to where LAB was before its collapse.
The opinions and market insights shared on CoinsProbe represent the views of individual authors based on prevailing market conditions at the time of publication. Cryptocurrency investments carry significant risk and volatility. Readers are encouraged to conduct their own research and seek professional financial advice before making investment decisions. CoinsProbe and its contributors do not accept responsibility for financial losses or decisions made based on published content.
CoinsProbe may publish sponsored articles, affiliate links, or promotional collaborations. All sponsored material is clearly labeled to maintain transparency with our audience. Our editorial decisions remain fully independent, and advertising partnerships do not influence reviews, rankings, or published opinions.
Since 2023, CoinsProbe has delivered reliable insights on cryptocurrency, blockchain, and digital assets. Our content is created by experienced researchers and analysts who follow strict editorial standards focused on accuracy, transparency, and credibility. Every article is carefully reviewed and verified using trusted sources and current market data. We provide unbiased analysis and timely updates covering everything from emerging crypto projects to major industry developments.