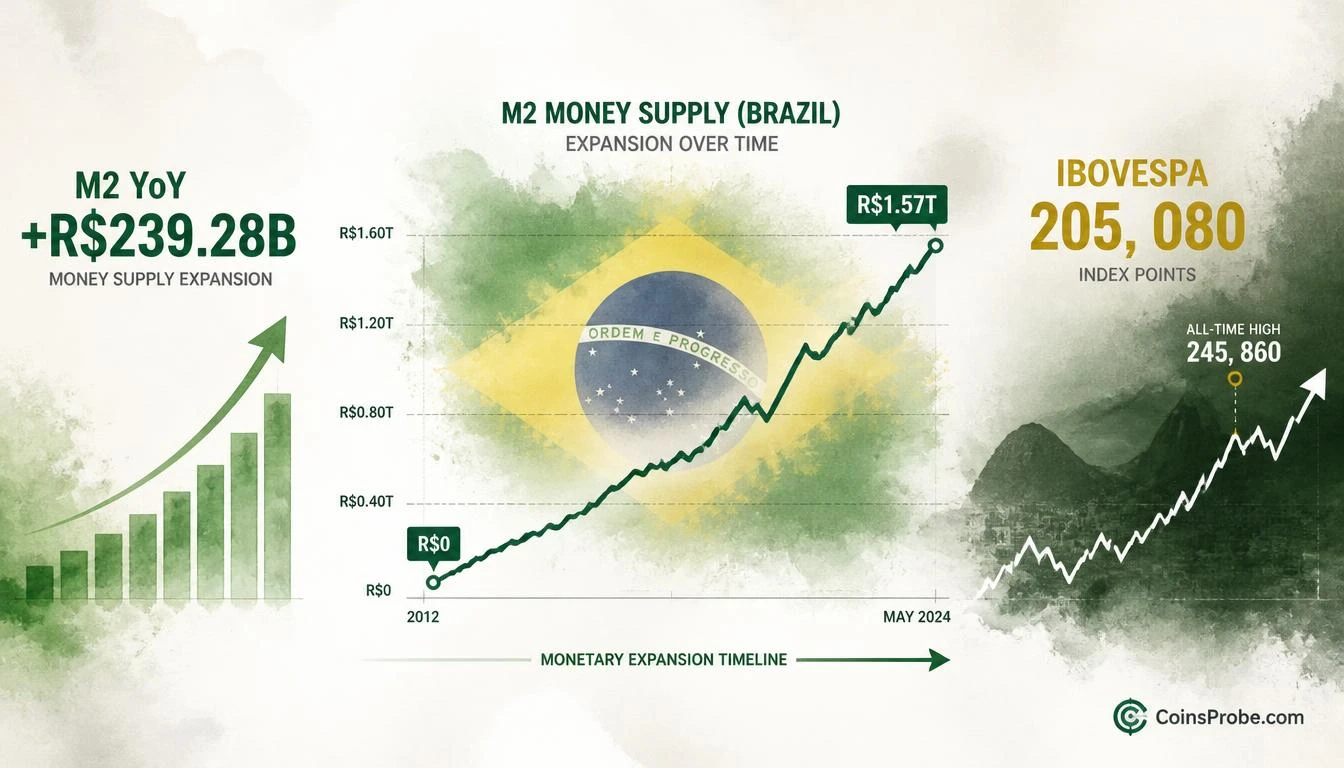

- Brazil M2 hits R$1.57T — up R$239.28B year-over-year, firmly in monetary expansion territory per Alphractal's 4-chart analysis
- Ibovespa trades at 205,080 points — approximately 16.6% below the printed chart peak of 245,860, with M2 still accelerating
- Central Bank of Brazil balance sheet at R$825.47B (+R$64.59B YoY) — positive but decelerating, the key divergence risk to watch
- Every major Ibovespa bear leg since 2006 was preceded by M2 YoY turning negative — currently still deep green at +R$239.28B
Brazil is voting today, and the question on every macro trader’s desk is not who wins — it is what monetary history says happens next. Over the past two decades, Brazil’s M2 money supply has expanded to R$1.57 trillion, with a year-over-year increase of R$239.28 billion, while the Ibovespa equity benchmark trades near 205,080 points, close to its all-time printed high of 245,860 points. The data leaves a clear pattern: every major cycle of monetary expansion in Brazil has historically aligned with Ibovespa inflection points.
Macro analytics platform @Alphractal published a four-chart thread on October 25, 2026, mapping two decades of Brazil’s M2, its Central Bank balance sheet, and their year-over-year changes against Ibovespa performance — covering the 2008 Global Financial Crisis, the 2015–16 recession, the 2020 pandemic crash, and every sustained equity rally in between. The core question the thread poses: how much of Brazil’s asset market gains reflect genuine economic growth versus pure liquidity expansion?
Signal 1 — Brazil M2 at R$1.57T: What the Absolute Level Reveals
The first chart in the Alphractal thread overlays Brazil’s total M2 money supply against the Ibovespa from approximately 2006 through October 2026. M2 — which includes currency in circulation, demand deposits, savings accounts, and short-term securities — currently stands at R$1.57 trillion, with the chart showing near-vertical acceleration at the right edge. The Ibovespa peaked at the printed chart high of 245,860 points before pulling back to the current 205,080, creating a divergence: M2 continues rising while equities have retraced approximately 16.6% from peak.
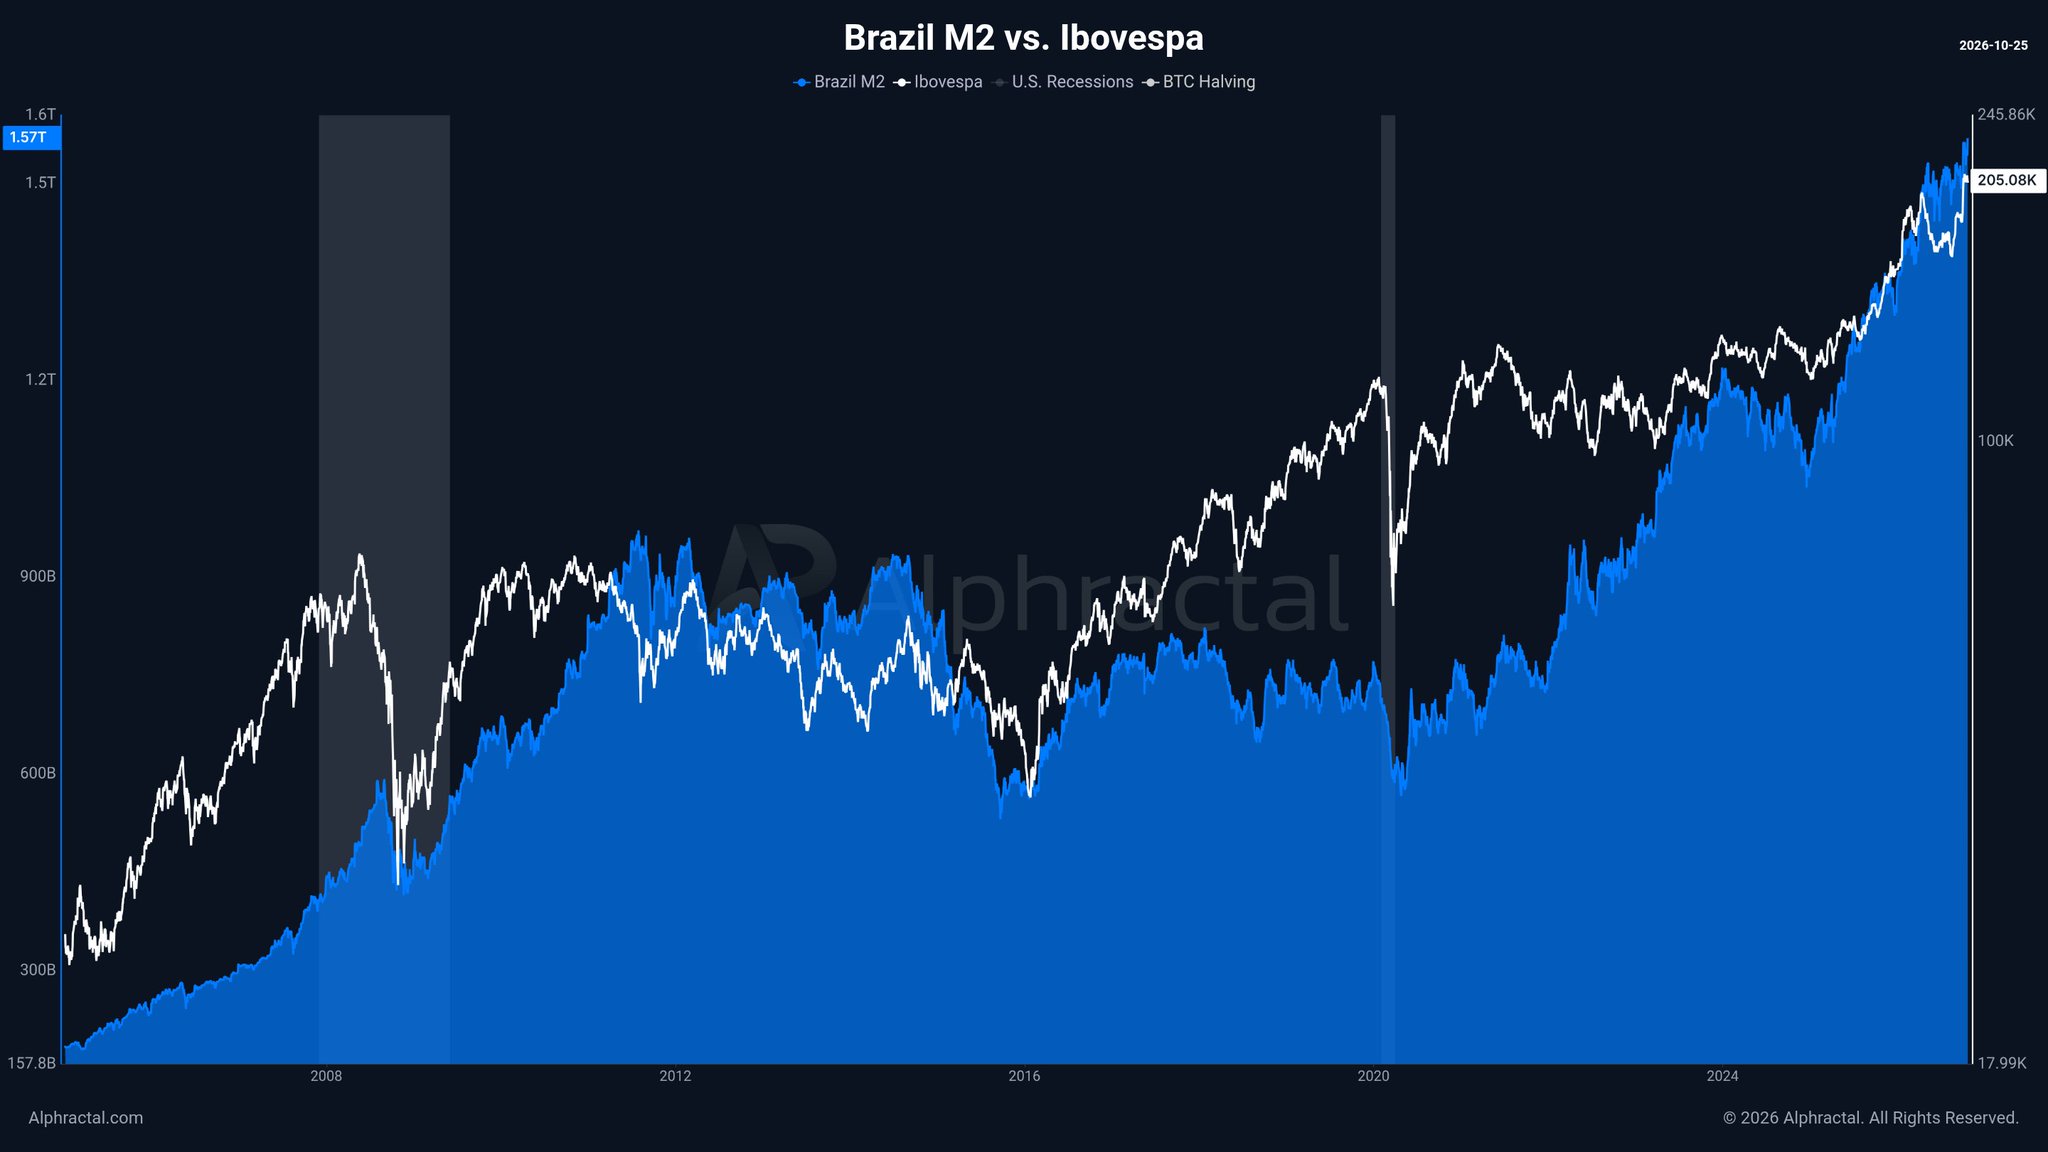
The pattern over twenty years is consistent. When M2 expanded aggressively — post-2008 stimulus, the commodity supercycle into 2011, and the post-pandemic liquidity flood of 2020–2021 — the Ibovespa followed with sustained rallies. Contraction periods or plateaus in M2 growth preceded equity drawdowns. The current reading of +R$239.28 billion year-over-year places Brazil firmly in an expansion regime, not a contraction.
Signal 2 — Central Bank Balance Sheet at R$825.47B: The Institutional Layer
The second chart adds the Central Bank of Brazil’s balance sheet — currently at R$825.47 billion, up R$64.59 billion year-over-year — as a second monetary expansion indicator alongside the Ibovespa. The Central Bank balance sheet captures reserve operations, foreign exchange interventions, and repo activity that M2 alone does not show. Historically, the two measures have moved together during full-cycle expansions and diverged during sterilization periods.
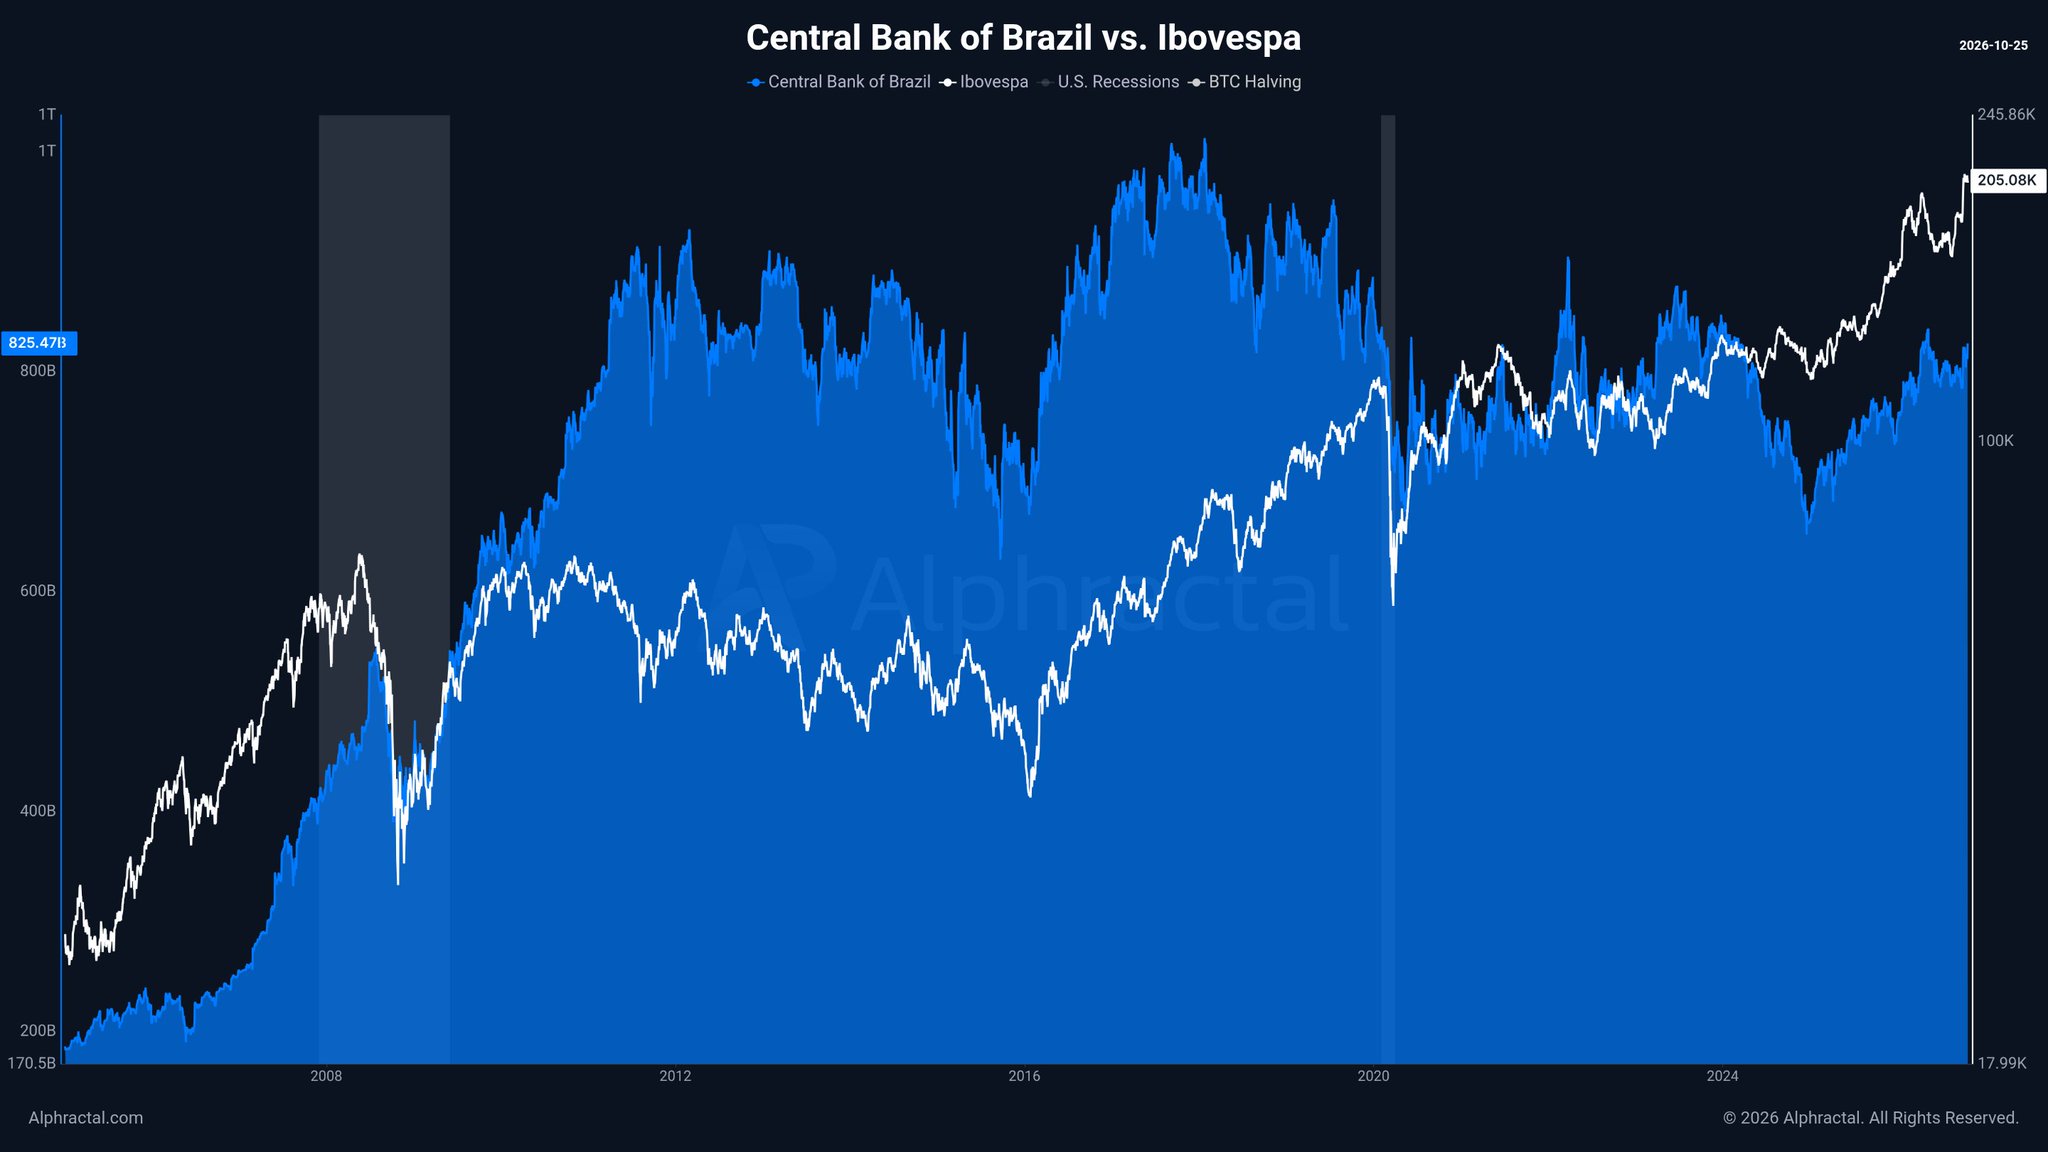
The chart shows the Central Bank balance sheet surged sharply post-2020, mirroring global central bank behavior during pandemic-era liquidity operations. Both series currently sit at elevated recent levels without a confirmed directional break. The Alphractal analysis presents this as a structural backdrop — not a trading signal — raising the question of how durable the current Ibovespa level is when both monetary aggregates are historically stretched.
Signal 3 — M2 YoY at +R$239.28B: Expansion Confirmed, Direction Pending
The third chart shifts from absolute levels to the year-over-year change in M2 — the most directly actionable of the four views. Green bars above zero indicate monetary expansion; red bars below zero signal contraction. The chart spans 2006–2026 with current M2 YoY reading at +R$239.28 billion, firmly in green expansion territory. The Ibovespa white line sits near 205,080 points, above its long-term baseline, confirming the correlation the thread has been building.
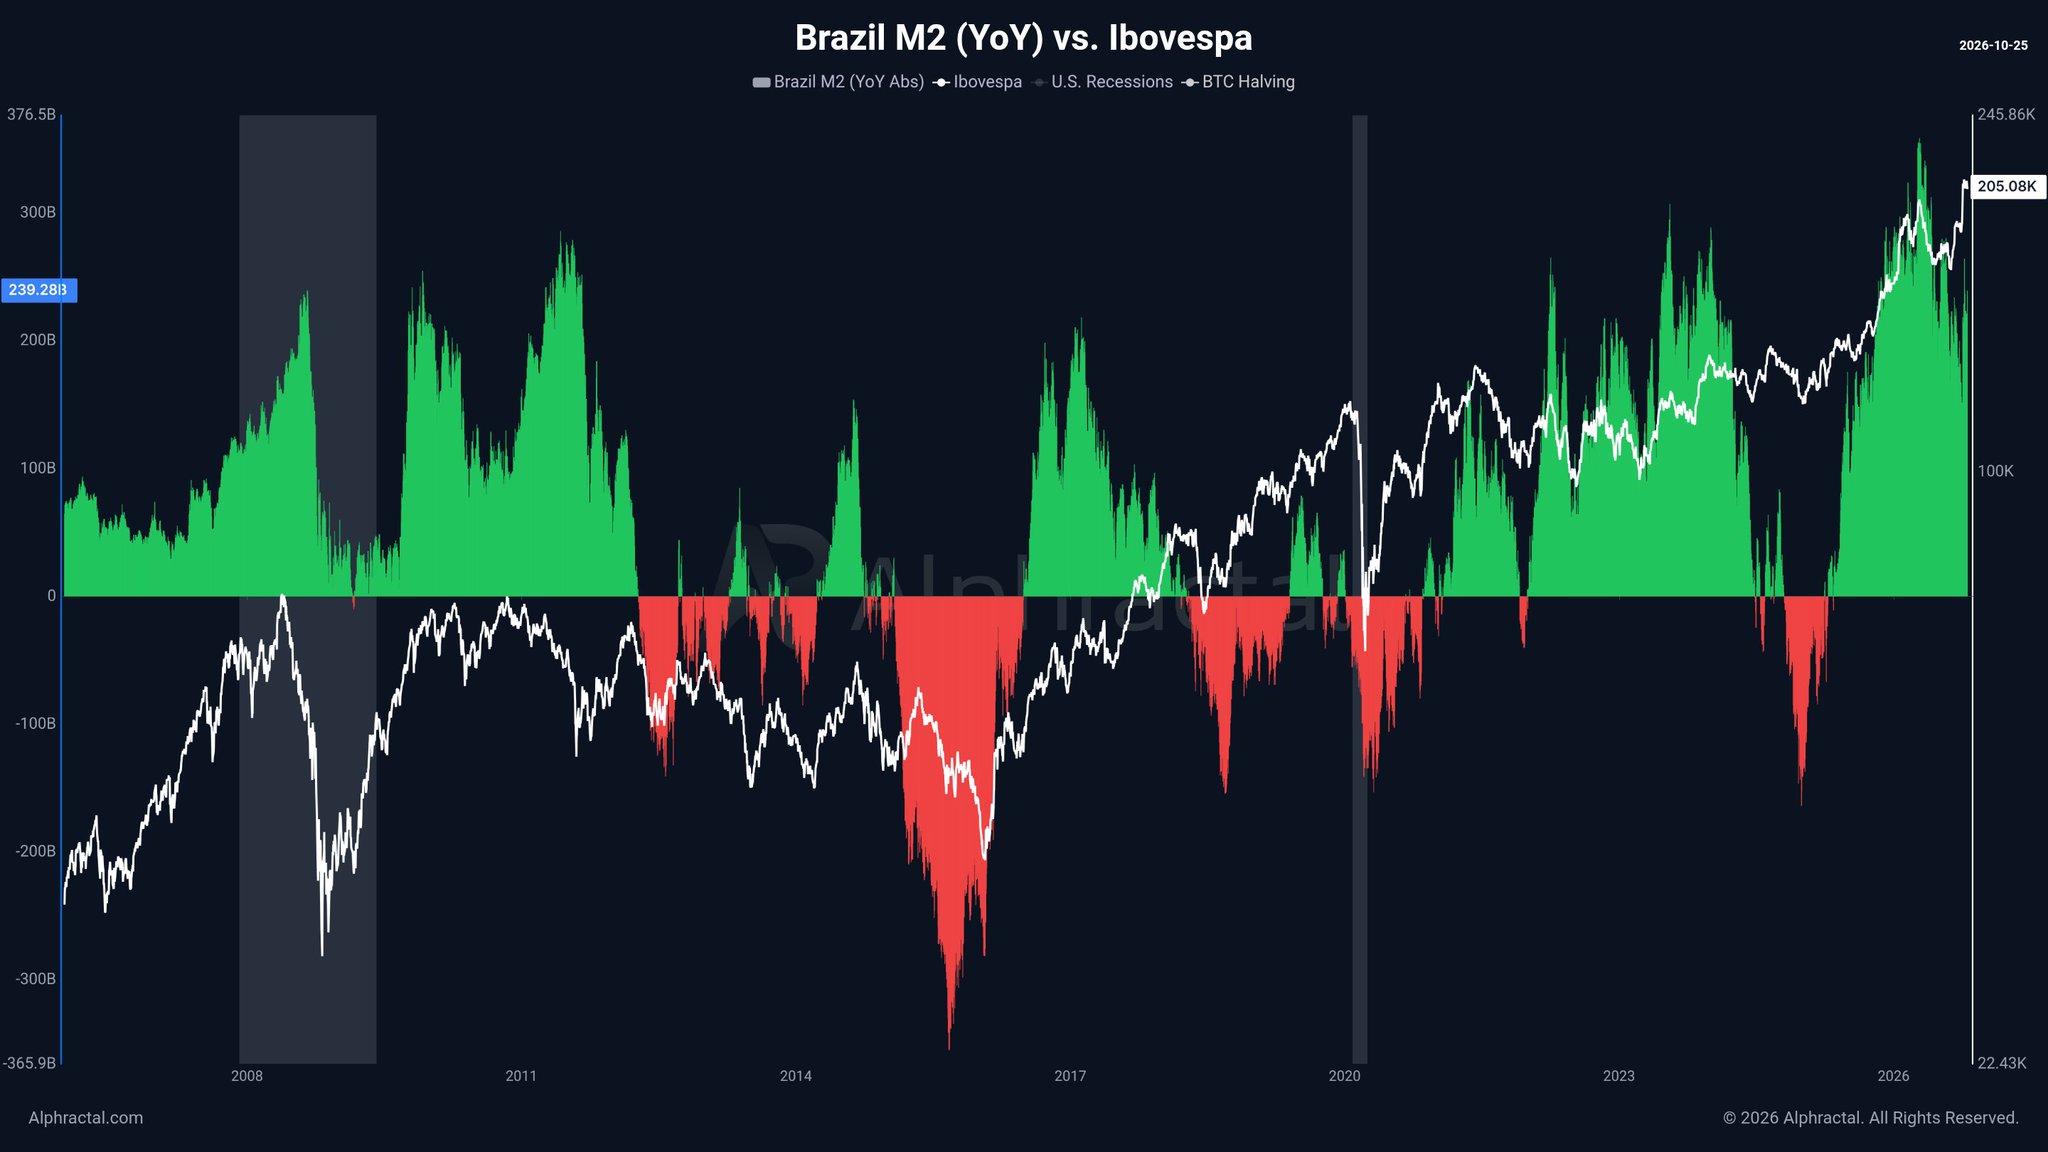
What the chart makes explicit: every sustained red-bar contraction period — particularly 2015–2016 and the brief 2020 shock — was accompanied by Ibovespa drawdowns. The current green bar reading is the most straightforward signal in the thread. Brazil’s monetary environment, measured by M2 YoY growth, is in expansion. That does not guarantee equity appreciation, but it removes the contraction headwind that preceded every major Ibovespa bear leg in the dataset. Readers tracking this metric in real time can find the latest M2 data via the Brazil M2 monetary expansion breakdown covered previously on CoinsProbe.
Signal 4 — Central Bank Balance Sheet YoY at +R$64.59B: Expansion but Decelerating
The fourth chart shows the Central Bank of Brazil’s balance sheet year-over-year change — currently at +R$64.59 billion — against the same Ibovespa overlay. Green bars represent balance sheet expansion; red bars represent contraction. The current reading is positive but modest relative to the post-2020 surge, suggesting the institutional monetary impulse is softer than it was at peak. The Ibovespa line tracks near its highest printed value of 205,080, above the long-term uptrend on the chart.
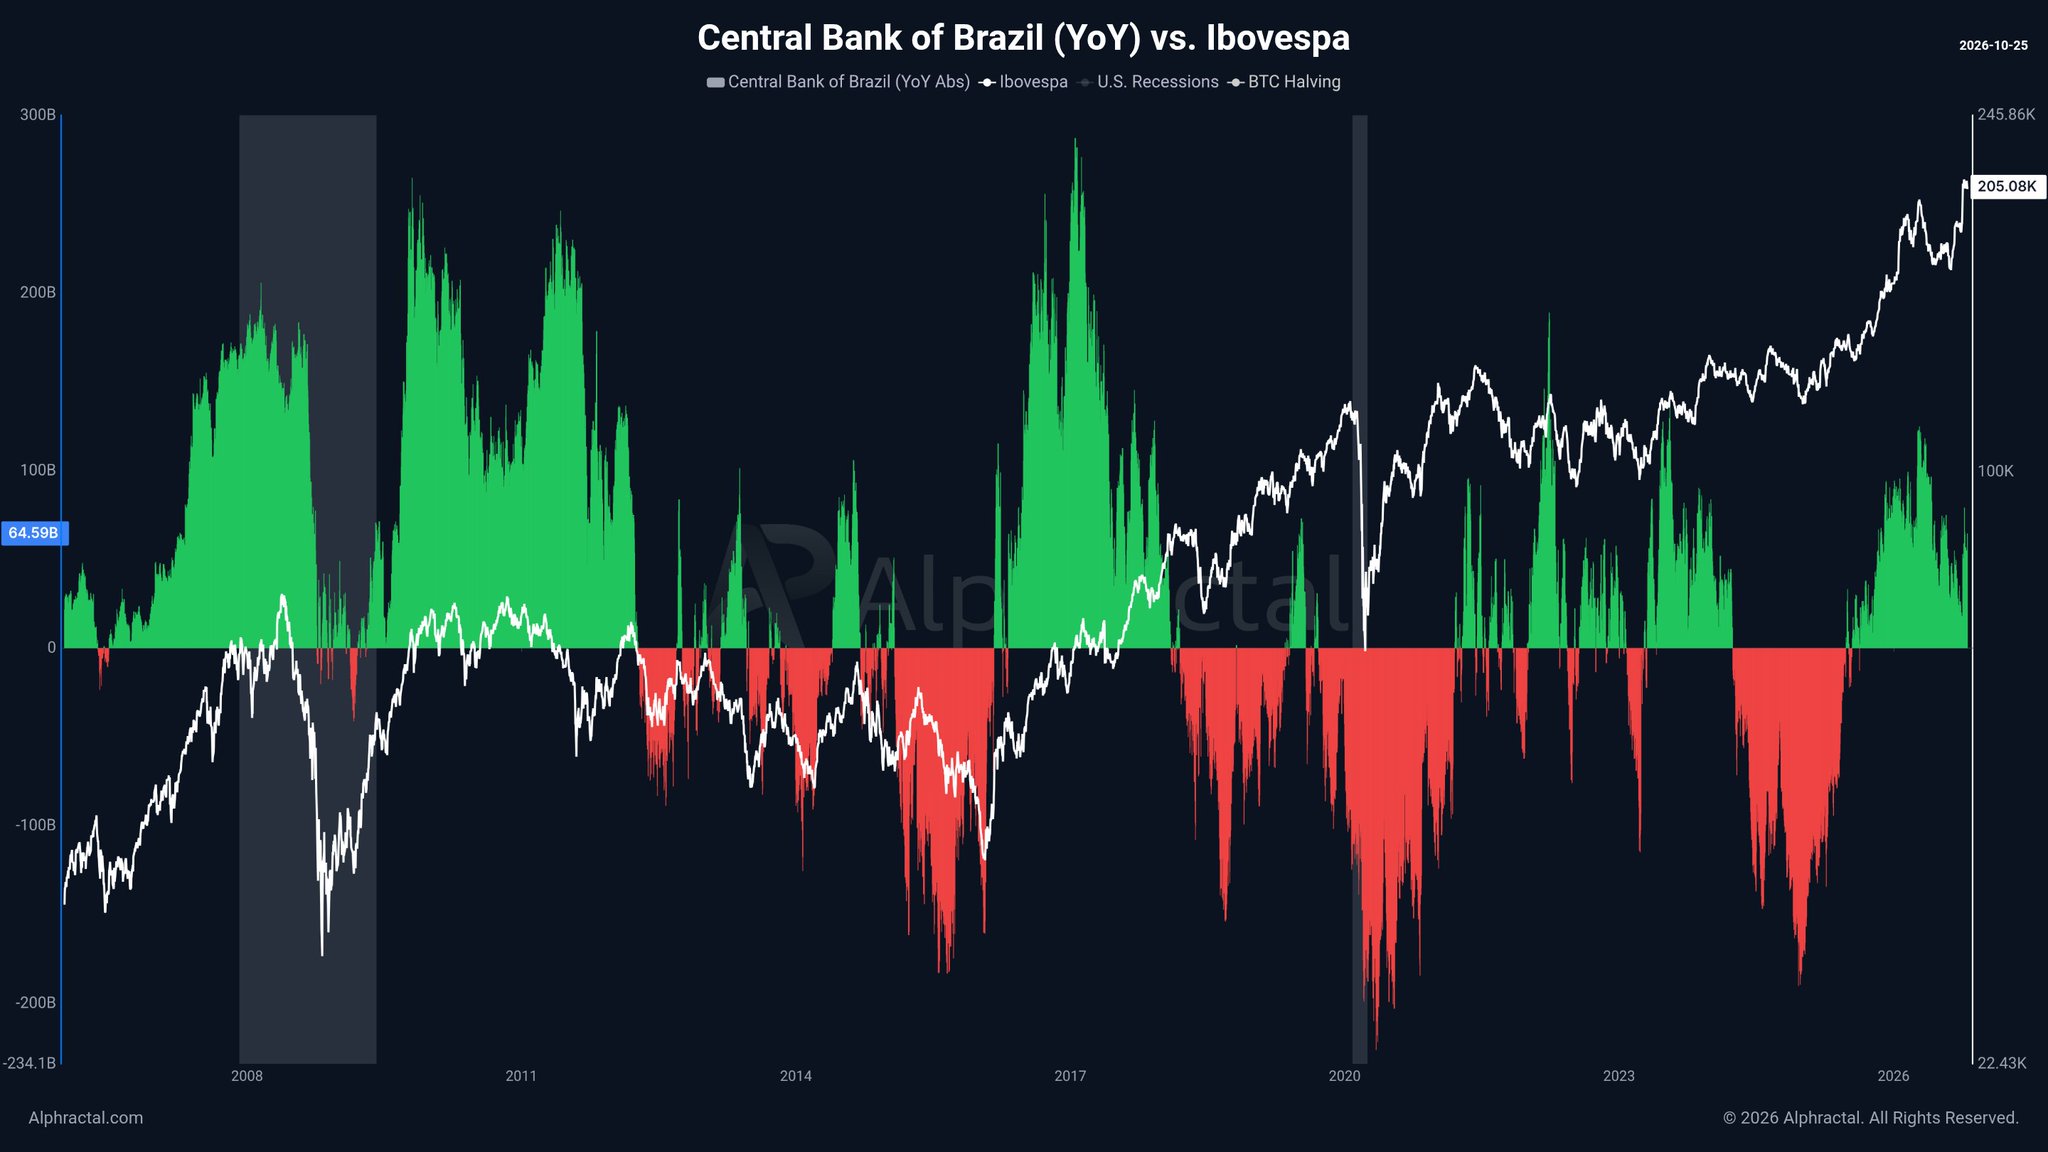
This deceleration in Central Bank YoY expansion — even while remaining positive — is the thread’s implicit caution. If the CB balance sheet YoY turns negative while M2 YoY remains green, the two measures would diverge, a setup that has historically preceded periods of Ibovespa choppiness rather than clean directional moves. The Brazilian Real’s nearly 5% surge in response to first-round election results adds currency market context: FX movement is already pricing political outcomes while the monetary data above quantifies the structural backdrop those outcomes will operate within.
The Core Question Alphractal Is Asking
The Alphractal thread does not issue a price target for the Ibovespa. It raises a structurally important question: how much of Brazil’s equity market gains over the past two decades reflect genuine economic growth, and how much is monetary liquidity expansion being mistaken for fundamental value creation?
The data the four charts provide gives the framework to answer that question by cycle. The 2008–2011 rally was accompanied by commodity-driven real GDP growth plus M2 expansion. The 2016–2019 recovery came with structural reform narratives plus a recovering CB balance sheet. The 2020–2022 surge was almost entirely liquidity-driven — M2 surged, the CB balance sheet surged, and earnings growth lagged. The current setup — M2 at R$1.57T growing at +R$239.28B YoY, CB balance sheet at R$825.47B growing at +R$64.59B YoY, Ibovespa at 205,080 versus a printed peak of 245,860 — is a hybrid. Expansion is real. But the gap between peak equities and current equities suggests the market has already partially priced in the monetary tailwind.
Election Day as a Catalyst Layer
Alphractal’s timing is deliberate. Publishing this four-chart monetary history thread on Brazil’s presidential election day frames the vote not as a binary equity trigger but as the political variable layered on top of a monetary structure that has a twenty-year track record. Government transitions in Brazil — from Lula to Dilma to Temer to Bolsonaro and back — all appear in this dataset. Every administration inherited and operated within the same monetary transmission mechanism. The Ibovespa responded to monetary policy first, political leadership second, across every cycle the charts cover.
That framing matters. If today’s election produces a clear result, FX and equity markets will react to the political headline. The Alphractal data argues that reaction will be short-term noise layered on top of a monetary expansion regime that is the primary long-duration driver of Ibovespa direction.
Bullish Scenario
If Brazil’s M2 YoY growth sustains above +R$200B and the Ibovespa reclaims the printed chart peak of 245,860 points, the two-decade correlation suggests the expansion regime remains intact and the prior high becomes the next base. Clear election outcome removing political uncertainty would accelerate repricing toward that level.
Bearish Scenario
If Brazil’s M2 YoY growth decelerates into sub-zero territory — as it did in 2015–16 — the historical pattern points to sustained Ibovespa drawdowns. The Central Bank balance sheet YoY already at a relatively modest +R$64.59B signals the institutional expansion impulse is thinner than it appears from M2 alone. A negative CB YoY print would be the first confirmation of a regime shift.
The Alphractal analysis makes one conclusion unavoidable: across every government, every crisis, and every recovery in the past twenty years, Brazil’s M2 and Central Bank monetary cycles have been the primary leading indicator for Ibovespa direction — not election outcomes, not individual policy announcements. Watch Brazil’s M2 YoY: at +R$239.28B it remains squarely expansionary. The moment that reading rolls negative is the moment the two-decade track record says the Ibovespa faces structural headwinds — regardless of who won today’s vote.
Source: x.comFrequently Asked Questions
Has Brazil’s M2 expansion always led to Ibovespa gains?
What would signal the end of Brazil’s current monetary expansion regime?
Does the Brazilian presidential election matter more than monetary policy for the Ibovespa?
Why is the Ibovespa at 205,080 when M2 is still expanding — shouldn’t it be near its 245,860 high?
Source: Alphractal · Published by CoinsProbe Markets Desk
The opinions and market insights shared on CoinsProbe represent the views of individual authors based on prevailing market conditions at the time of publication. Cryptocurrency investments carry significant risk and volatility. Readers are encouraged to conduct their own research and seek professional financial advice before making investment decisions. CoinsProbe and its contributors do not accept responsibility for financial losses or decisions made based on published content.
CoinsProbe may publish sponsored articles, affiliate links, or promotional collaborations. All sponsored material is clearly labeled to maintain transparency with our audience. Our editorial decisions remain fully independent, and advertising partnerships do not influence reviews, rankings, or published opinions.
Since 2023, CoinsProbe has delivered reliable insights on cryptocurrency, blockchain, and digital assets. Our content is created by experienced researchers and analysts who follow strict editorial standards focused on accuracy, transparency, and credibility. Every article is carefully reviewed and verified using trusted sources and current market data. We provide unbiased analysis and timely updates covering everything from emerging crypto projects to major industry developments.