
- Bitcoin trades at $78,441 (+0.87% 24h) as November 3 US midterm elections approach
- Analyst flags 4-for-4 pattern: every prior US midterm election preceded a major BTC correction
- Chart places current -30% drawdown annotation at the "NOW" marker — not a future target
- Spot Bitcoin ETFs saw $643.3M in single-day outflows on Oct 30, per SoSoValue data
Bitcoin is trading at approximately $78,441 — up 0.87% in the past 24 hours — with a market cap of $1.577 trillion. But one analyst believes the calendar, not the chart, is the most important data point right now.
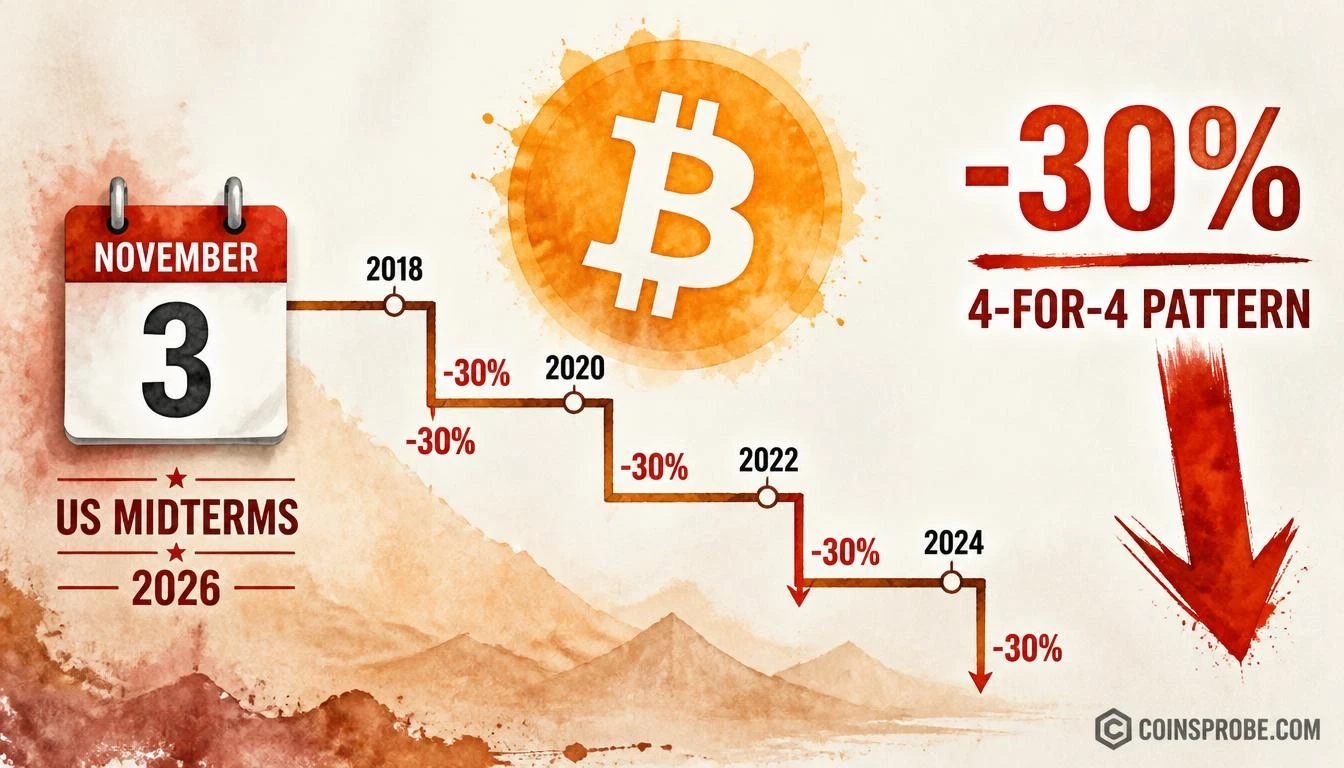
With the US midterm elections scheduled for November 3, 2026, an analyst who tracks macro-cycle patterns flags a historical pattern that has held across every midterm election cycle on record: four elections, four major Bitcoin corrections. The chart shared in the analysis places the current moment — labeled “NOW” on the timeline — already at the -30% drawdown level, suggesting the breakdown is not a future possibility but a present reality in the context of this cycle.
The Pattern — 4-for-4 Across Every US Midterm Election
The historical record, as presented in the analysis, is unambiguous in its consistency. Every US midterm election across four prior cycles preceded a significant Bitcoin price correction. The chart illustrates a descending zigzag structure — lower highs and lower lows across each cycle — with each recovery failing progressively before a steep final drop. The -30% annotation is placed directly at the “NOW” marker on the x-axis, aligning the current moment with the point of maximum drawdown rather than the beginning of one.
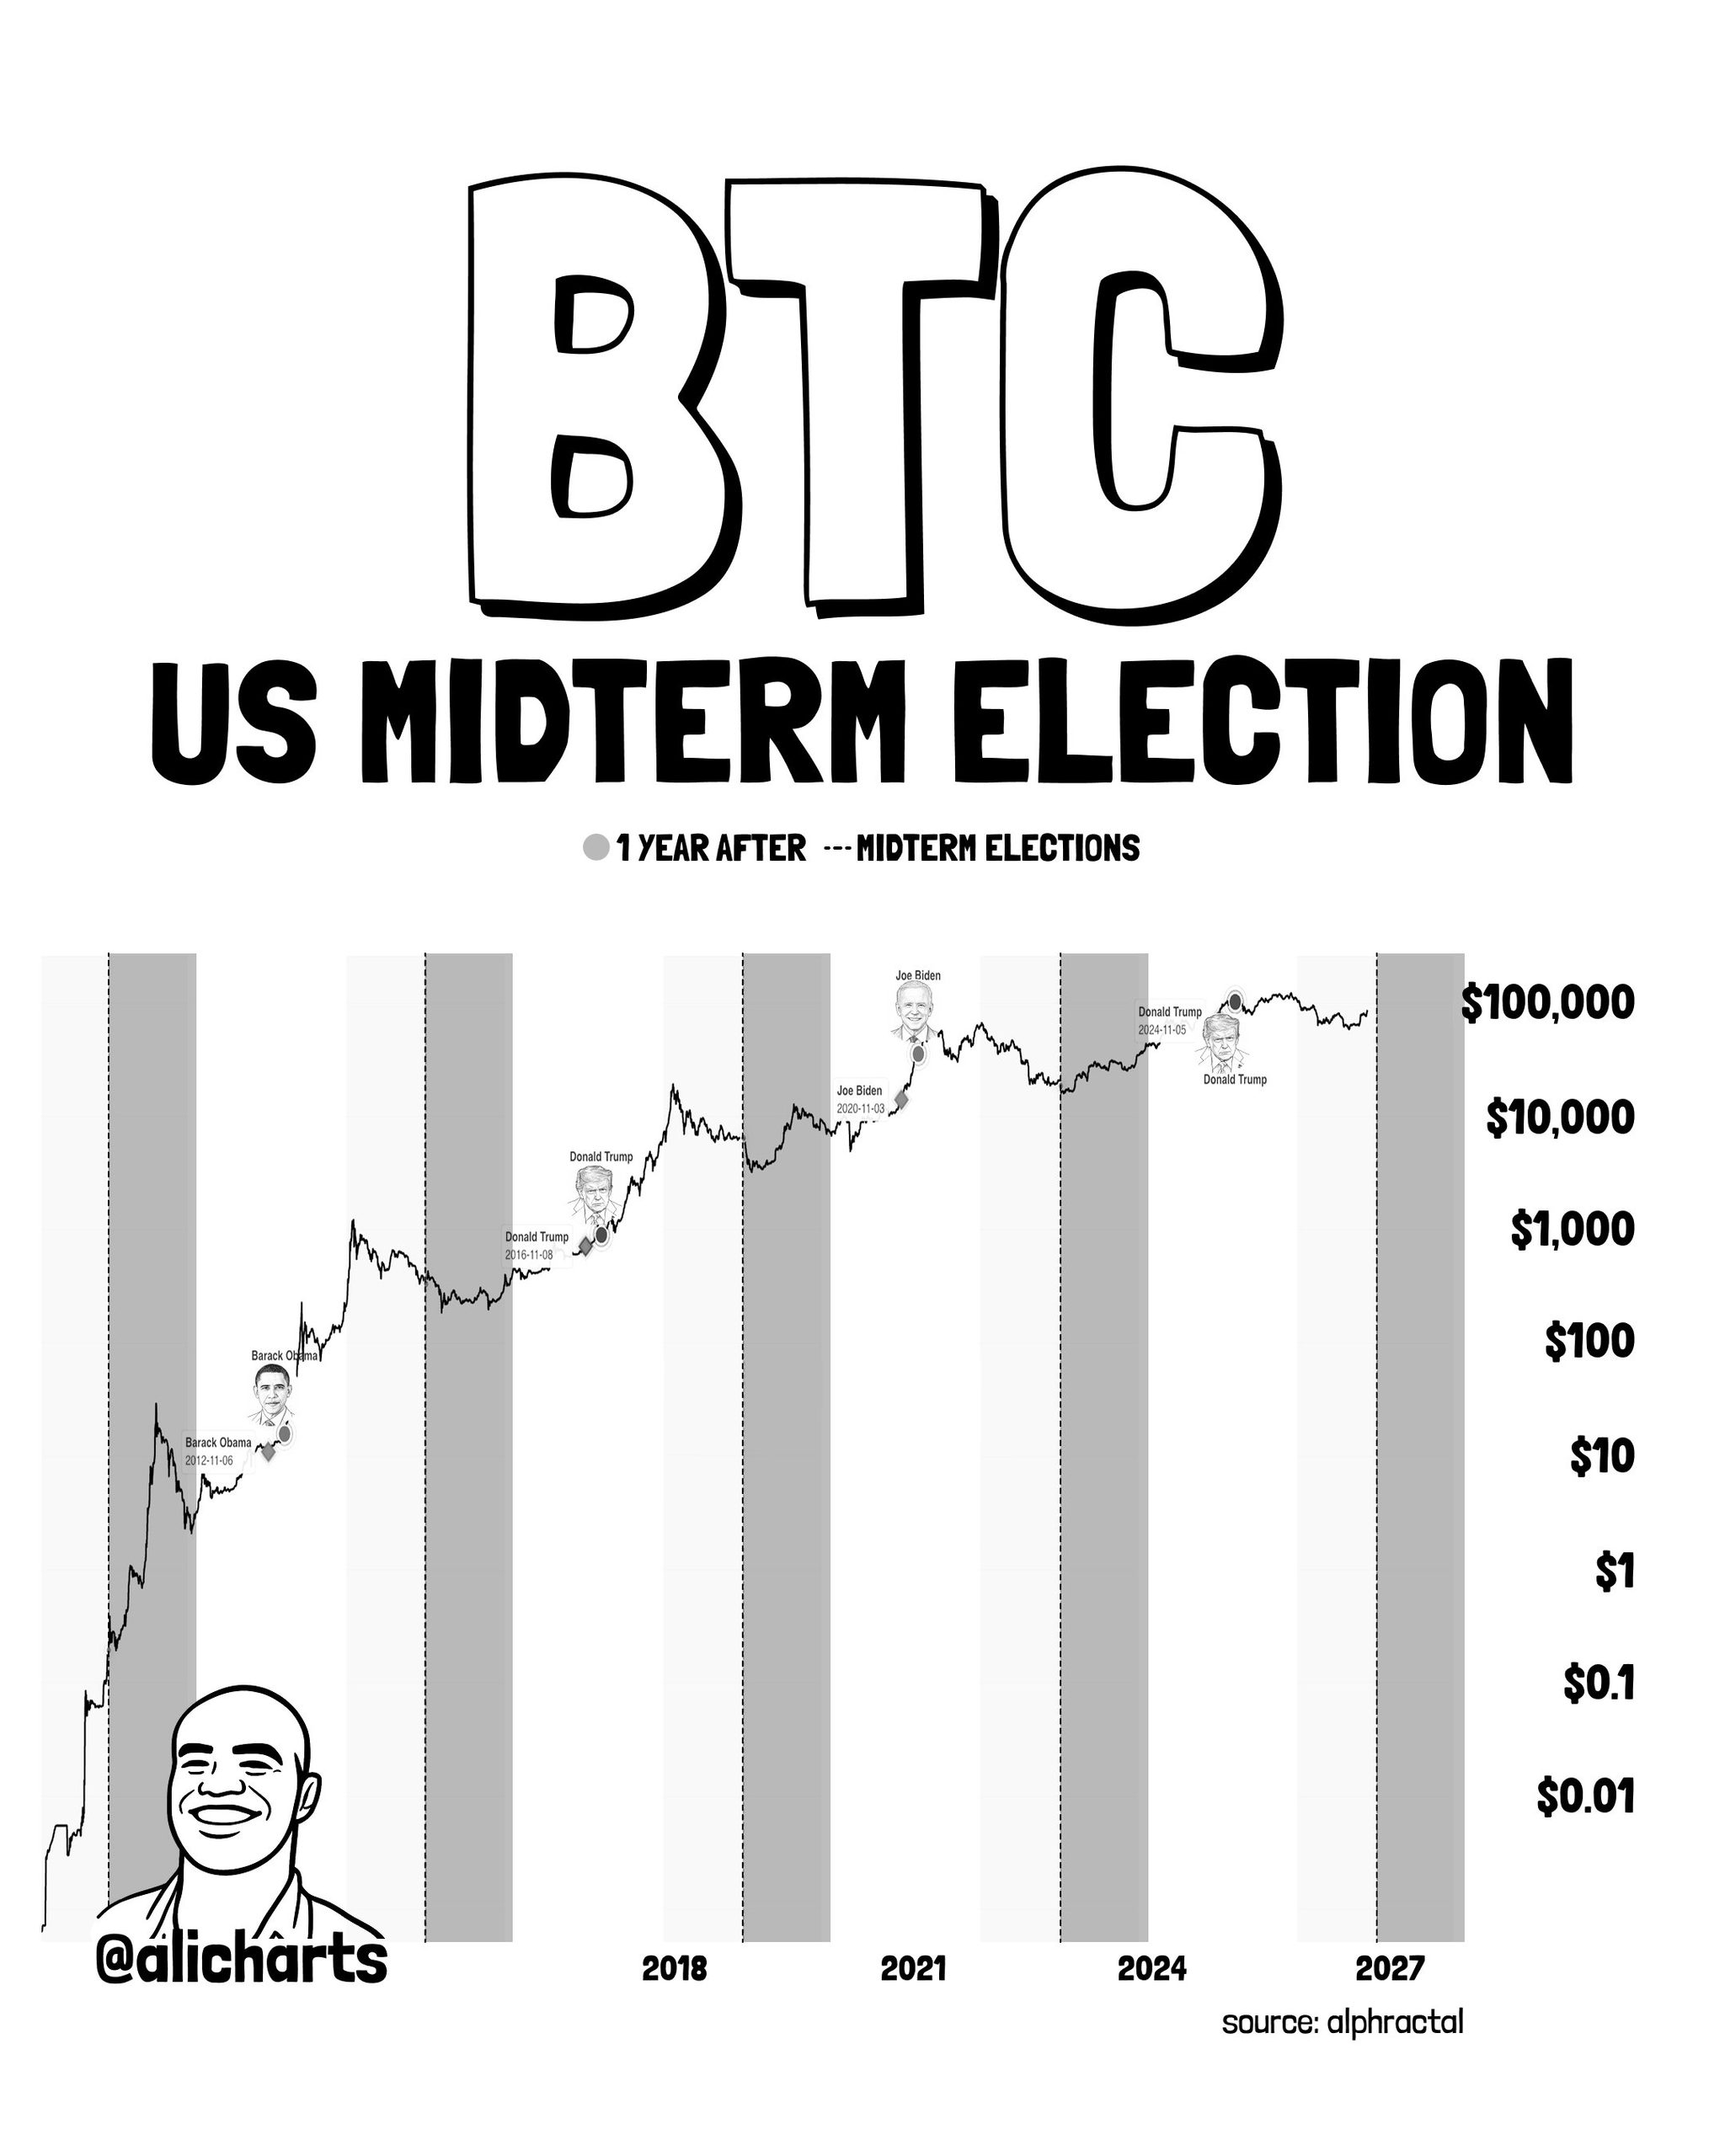
This is a non-trivial sample. Four consecutive instances of the same directional outcome — regardless of the macro environment, Bitcoin’s market cap at the time, or the political composition of the election — represents a 100% hit rate across the available dataset. The mechanism proposed is behavioral: midterm election uncertainty compresses risk appetite, and Bitcoin, as the highest-beta macro asset, absorbs the selling first.
It is worth noting what this pattern does and does not establish. It documents a consistent directional outcome — significant corrections — but does not specify depth beyond the approximate -30% referenced in the chart annotation, nor does it provide a recovery timeline or a recovery target. The chart’s -30% label is already aligned with “NOW,” meaning the analyst’s framing treats the current position as the arrival point of this correction, not its starting gun.
The ETF Layer — Institutional Money Is Already Moving
The macro pattern is not occurring in a vacuum. Spot Bitcoin ETF data via SoSoValue shows a single-day net outflow of $643.3M on October 30 — one of the largest daily outflow readings in recent weeks. IBIT alone saw $233.7M exit, followed by FBTC at $201.0M and GBTC at $53.3M. Total ETF net assets stand at $98.14B, down from recent peaks, with cumulative net inflows since launch at $56.98B.
The five-day trailing flow is net negative at -$202.6M, despite four of the five days registering inflows individually — meaning the single large outflow day overwhelmed a week of modest accumulation. This is consistent with the pattern the midterm thesis would predict: not a panic exit, but a quiet, sustained reduction in institutional exposure ahead of a political risk event. For further context on how exchange-level positioning has shifted recently, see Bitcoin Exchange Netflow Turns Positive for First Time Since September 21.
The FOMC Overlay — Rate Risk Compounds Election Risk
The midterm pattern arrives alongside an increasingly hawkish rate outlook. Markets are currently pricing a 72.6% probability of a rate hike to 4.00%–4.25% at the December 9 FOMC meeting, per SoSoValue data. By the January 27 meeting, the probability of a further hike to 4.25%–4.50% reaches 21.7%, with only 19.2% of market pricing expecting rates to hold flat.
A tightening rate environment is historically correlated with Bitcoin drawdowns — not because of any direct link between rates and Bitcoin’s protocol, but because rising rates increase the opportunity cost of holding zero-yield assets and reduce the liquidity conditions that typically support crypto market rallies. The combination of midterm uncertainty and a hawkish Fed path creates a two-front pressure scenario. Key macro data drops this week include Nonfarm Payrolls on November 6 and CPI on November 10 — both capable of accelerating or moderating the rate outlook in real time.
What the Pattern Says — and What It Doesn’t
The 4-for-4 midterm correction pattern is a track record, not a law. What it confirms: every prior US midterm election has been followed by a meaningful Bitcoin drawdown, and the chart places the -30% drawdown annotation directly at the current moment. What it does not confirm: the exact depth of any further move, the recovery timeline, or whether this cycle will extend the pattern or break it.
The most important distinction is timing. The analyst published this note on November 1, 2026 — two days before the November 3 election. If the historical pattern holds, the correction is not a future event to be anticipated but a present condition already underway. Bitcoin at $78,441 is already well off cycle highs, and the chart’s framing treats the -30% level as the “NOW” position, not a prospective target.
For a deeper look at how prior midterm cycles mapped to Bitcoin’s price structure, see Bitcoin vs US Midterm Elections — Three Cycles, One Pattern.
Strategy (MSTR) continues to hold 848,517 BTC with a latest purchase of 267 BTC for $22.1M, signaling that at least one major corporate holder is not reducing exposure ahead of the election — a data point that cuts against the bearish thesis, though it does not invalidate the historical pattern.
Bitcoin has never sustained a midterm election without a correction. Whether this cycle becomes the first exception — or confirms the fifth data point in a 5-for-5 record — will be answered in the sessions immediately surrounding November 3. Watch $78,441 as the reference level: a sustained move below it with accelerating ETF outflows would align with the historical correction thesis, while a reclaim of prior range highs would mark the first midterm exception on record.
Source: x.com
Frequently Asked Questions
Has Bitcoin always dropped during US midterm election years?
Why would a US midterm election cause Bitcoin to drop?
What do spot Bitcoin ETF flows show heading into the November 3 election?
What would break the midterm correction pattern for Bitcoin in 2026?
Source: Ali Charts · Published by CoinsProbe Markets Desk
The opinions and market insights shared on CoinsProbe represent the views of individual authors based on prevailing market conditions at the time of publication. Cryptocurrency investments carry significant risk and volatility. Readers are encouraged to conduct their own research and seek professional financial advice before making investment decisions. CoinsProbe and its contributors do not accept responsibility for financial losses or decisions made based on published content.
CoinsProbe may publish sponsored articles, affiliate links, or promotional collaborations. All sponsored material is clearly labeled to maintain transparency with our audience. Our editorial decisions remain fully independent, and advertising partnerships do not influence reviews, rankings, or published opinions.
Since 2023, CoinsProbe has delivered reliable insights on cryptocurrency, blockchain, and digital assets. Our content is created by experienced researchers and analysts who follow strict editorial standards focused on accuracy, transparency, and credibility. Every article is carefully reviewed and verified using trusted sources and current market data. We provide unbiased analysis and timely updates covering everything from emerging crypto projects to major industry developments.